With the upcoming SpaceX IPO and Anthropic also filing a confidential draft S-1, IPOs are in the news, to say the least. I thought it would be interesting to look at some historical stats on IPOs, and conveniently, Professor Jay Ritter at the University of Florida maintains a comprehensive IPO data hub covering IPOs from 1980 to 2025.
One thing to know about the data is that Ritter is conservative in how he defines an IPO, generally excluding SPACs, ADRs, closed-end funds, REITs, banks, and penny stocks, whereas general industry counts often include all of these. He is also consistent with those definitions over time, so we can compare apples to apples across 45 years.
The metric Ritter first considers is the first-day return, which is simply the difference between the first-day closing price and the offer price. That first-day “pop” is interesting, but what ultimately matters is the long-term return, both on its own and relative to the market (as in, are you better off buying the IPO or just buying the broad market?). With that, here are six big-picture observations.
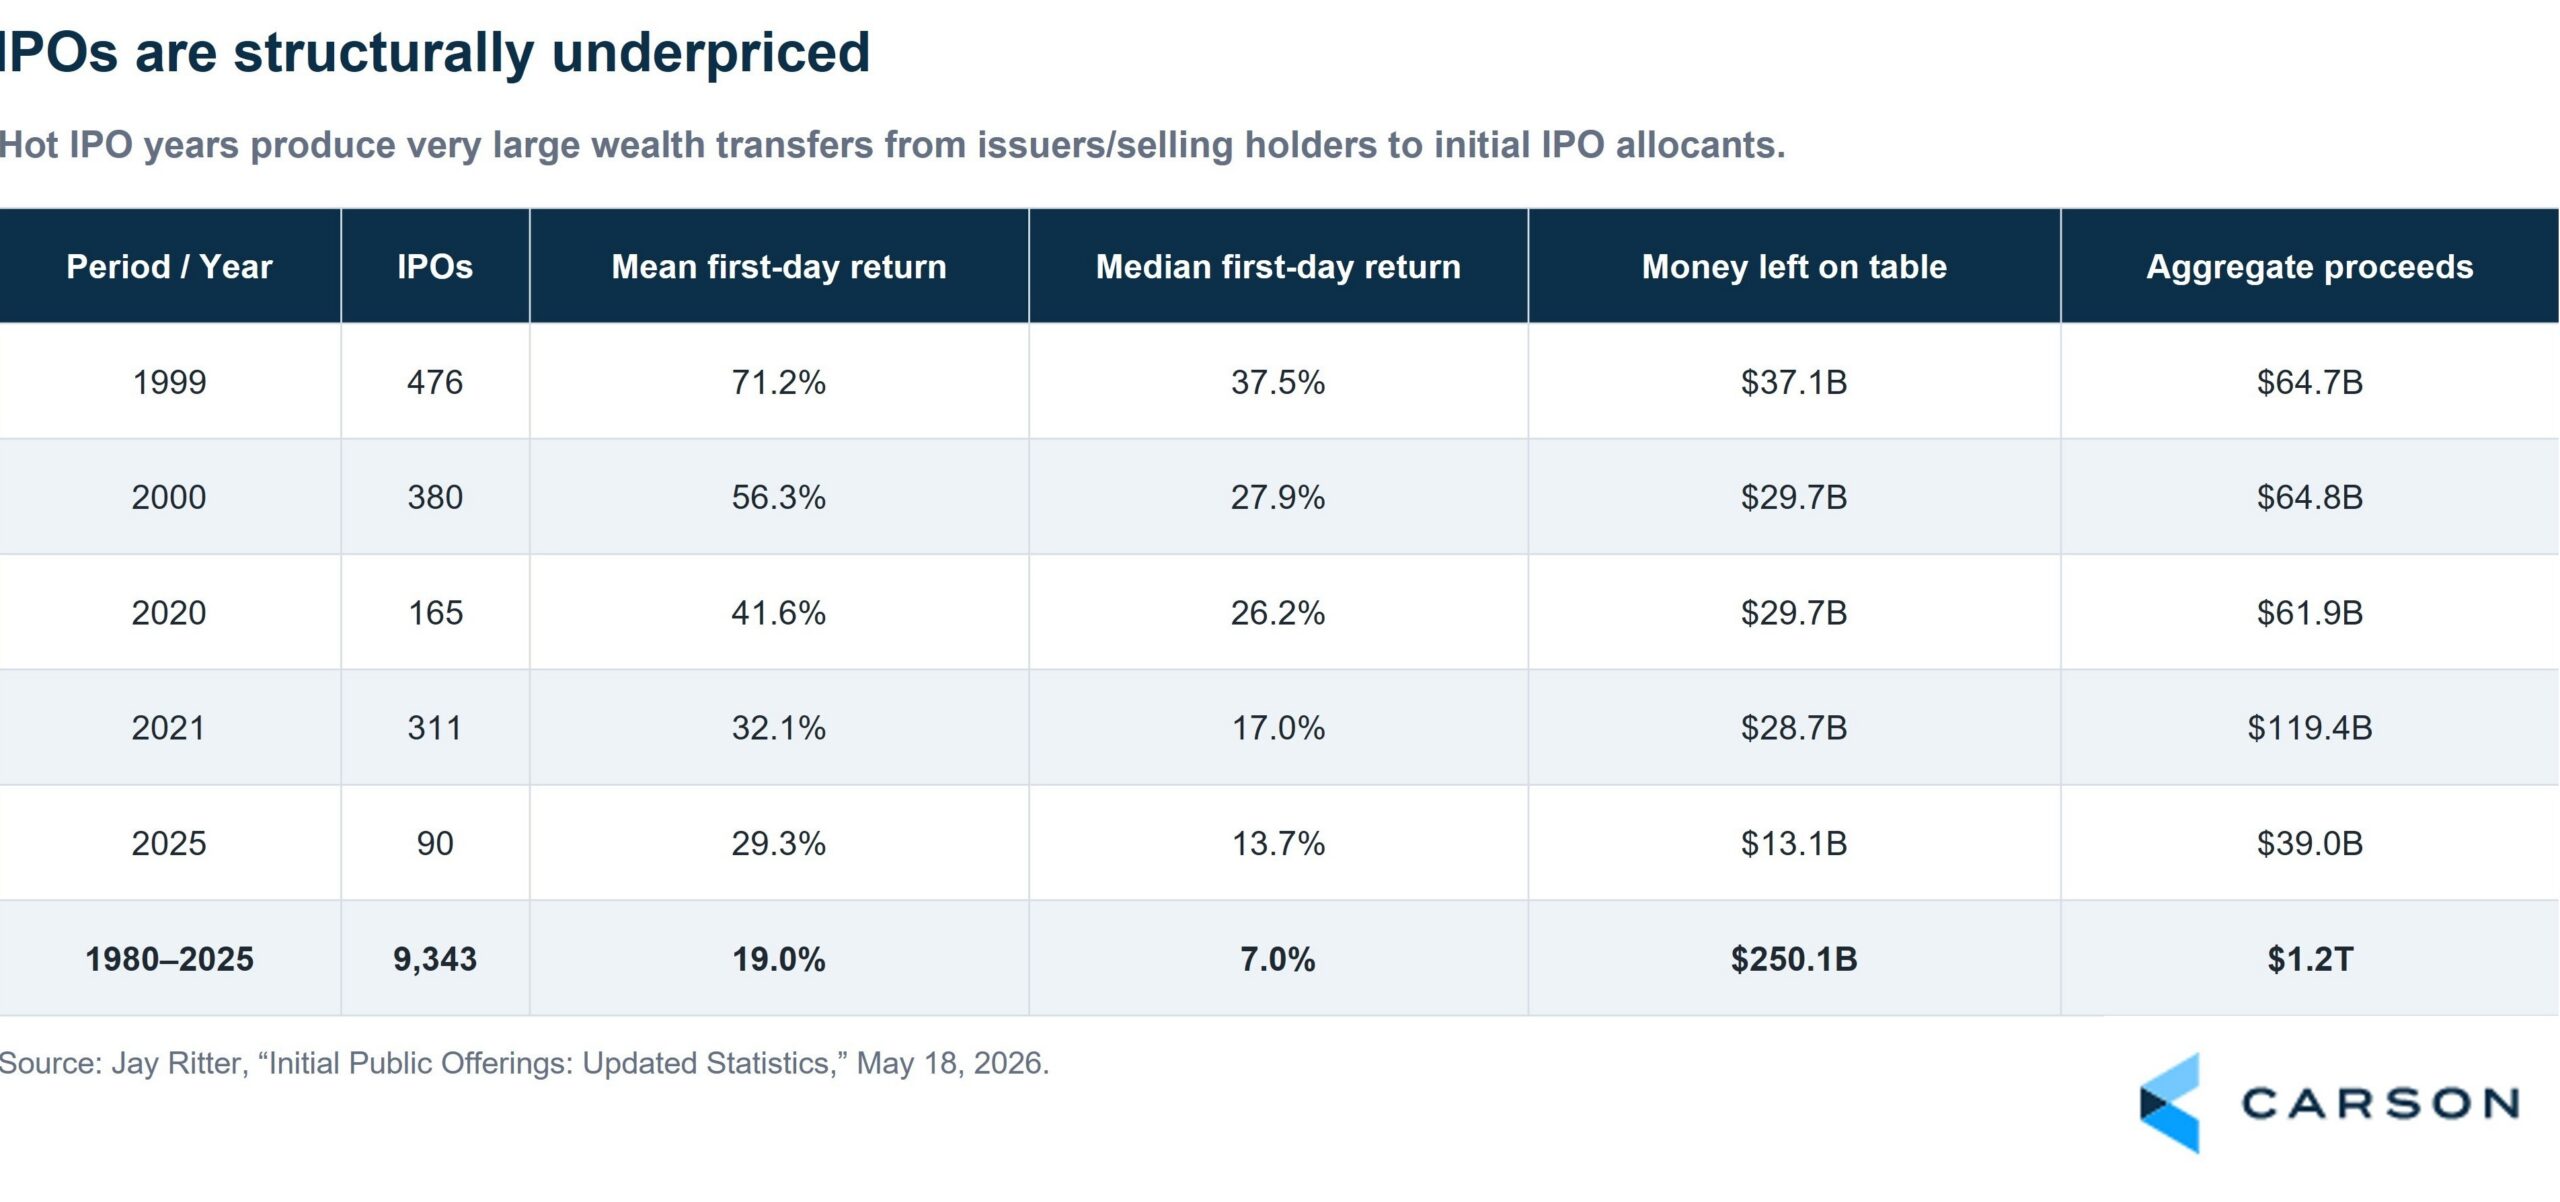
One: IPOs are structurally underpriced
From 1980 to 2025, Ritter’s sample includes 9,343 IPOs. The mean first-day return was 19.0%, with much higher returns in hot IPO years like 1999, 2000, 2020, and 2021. The median first-day return was 7.0%. Aggregate proceeds came to $1.2 trillion, but there was another $250 billion of what Ritter calls “money left on the table.”
What does that mean? Money left on the table is the first-day closing price minus the offer price, multiplied by the number of shares offered. In plain terms, it is the extra money the company and its selling shareholders could have raised if the IPO had been priced at the first-day closing price instead of the offer price. A quick example: say a company sells 10 million shares at $20, raising $200 million. If investors are willing to pay $30 by the close on day one, those same shares are now worth $300 million. That $100 million gap is the money left on the table. The winners are the investors who got an allocation at the offer price, not the company, which already sold at that lower price. In 2025 alone, across 90 IPOs, the money left on the table totaled $13.1 billion, about 33% of the proceeds.
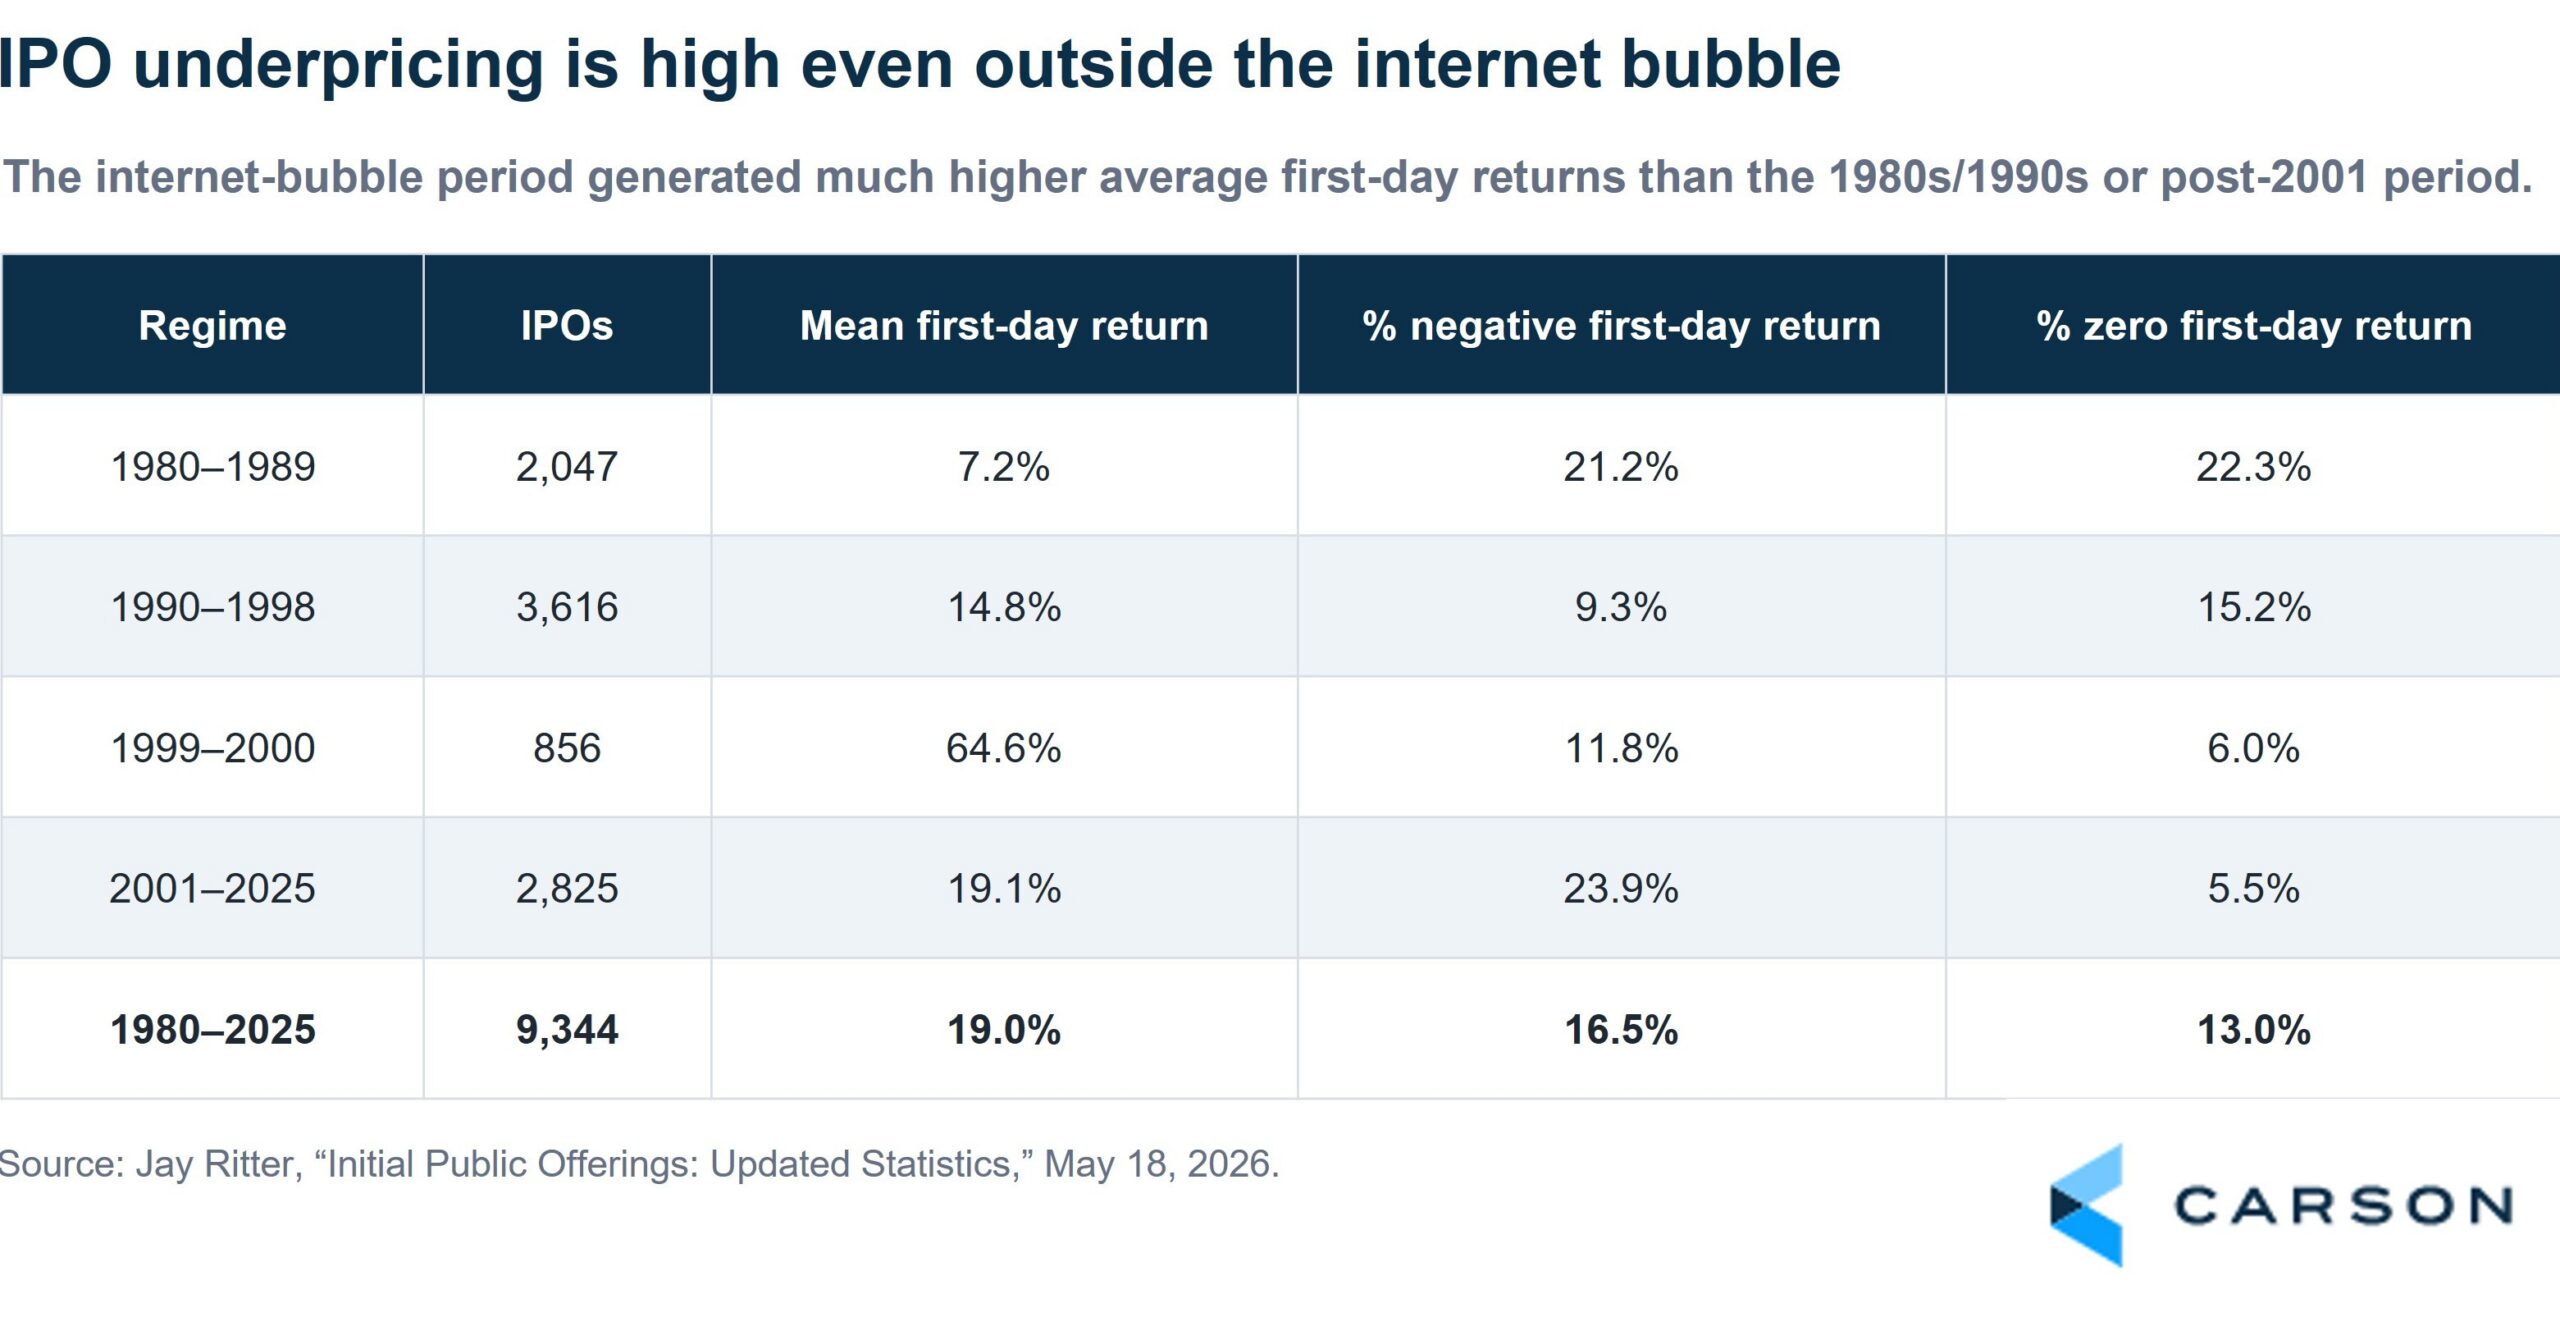
Two: IPO underpricing is high even outside the Internet bubble
During the internet bubble of 1999 to 2000, the average first-day return was a massive 64.6%. But even outside that period, first-day returns are large. Since 2001, the average has been 19.1%.
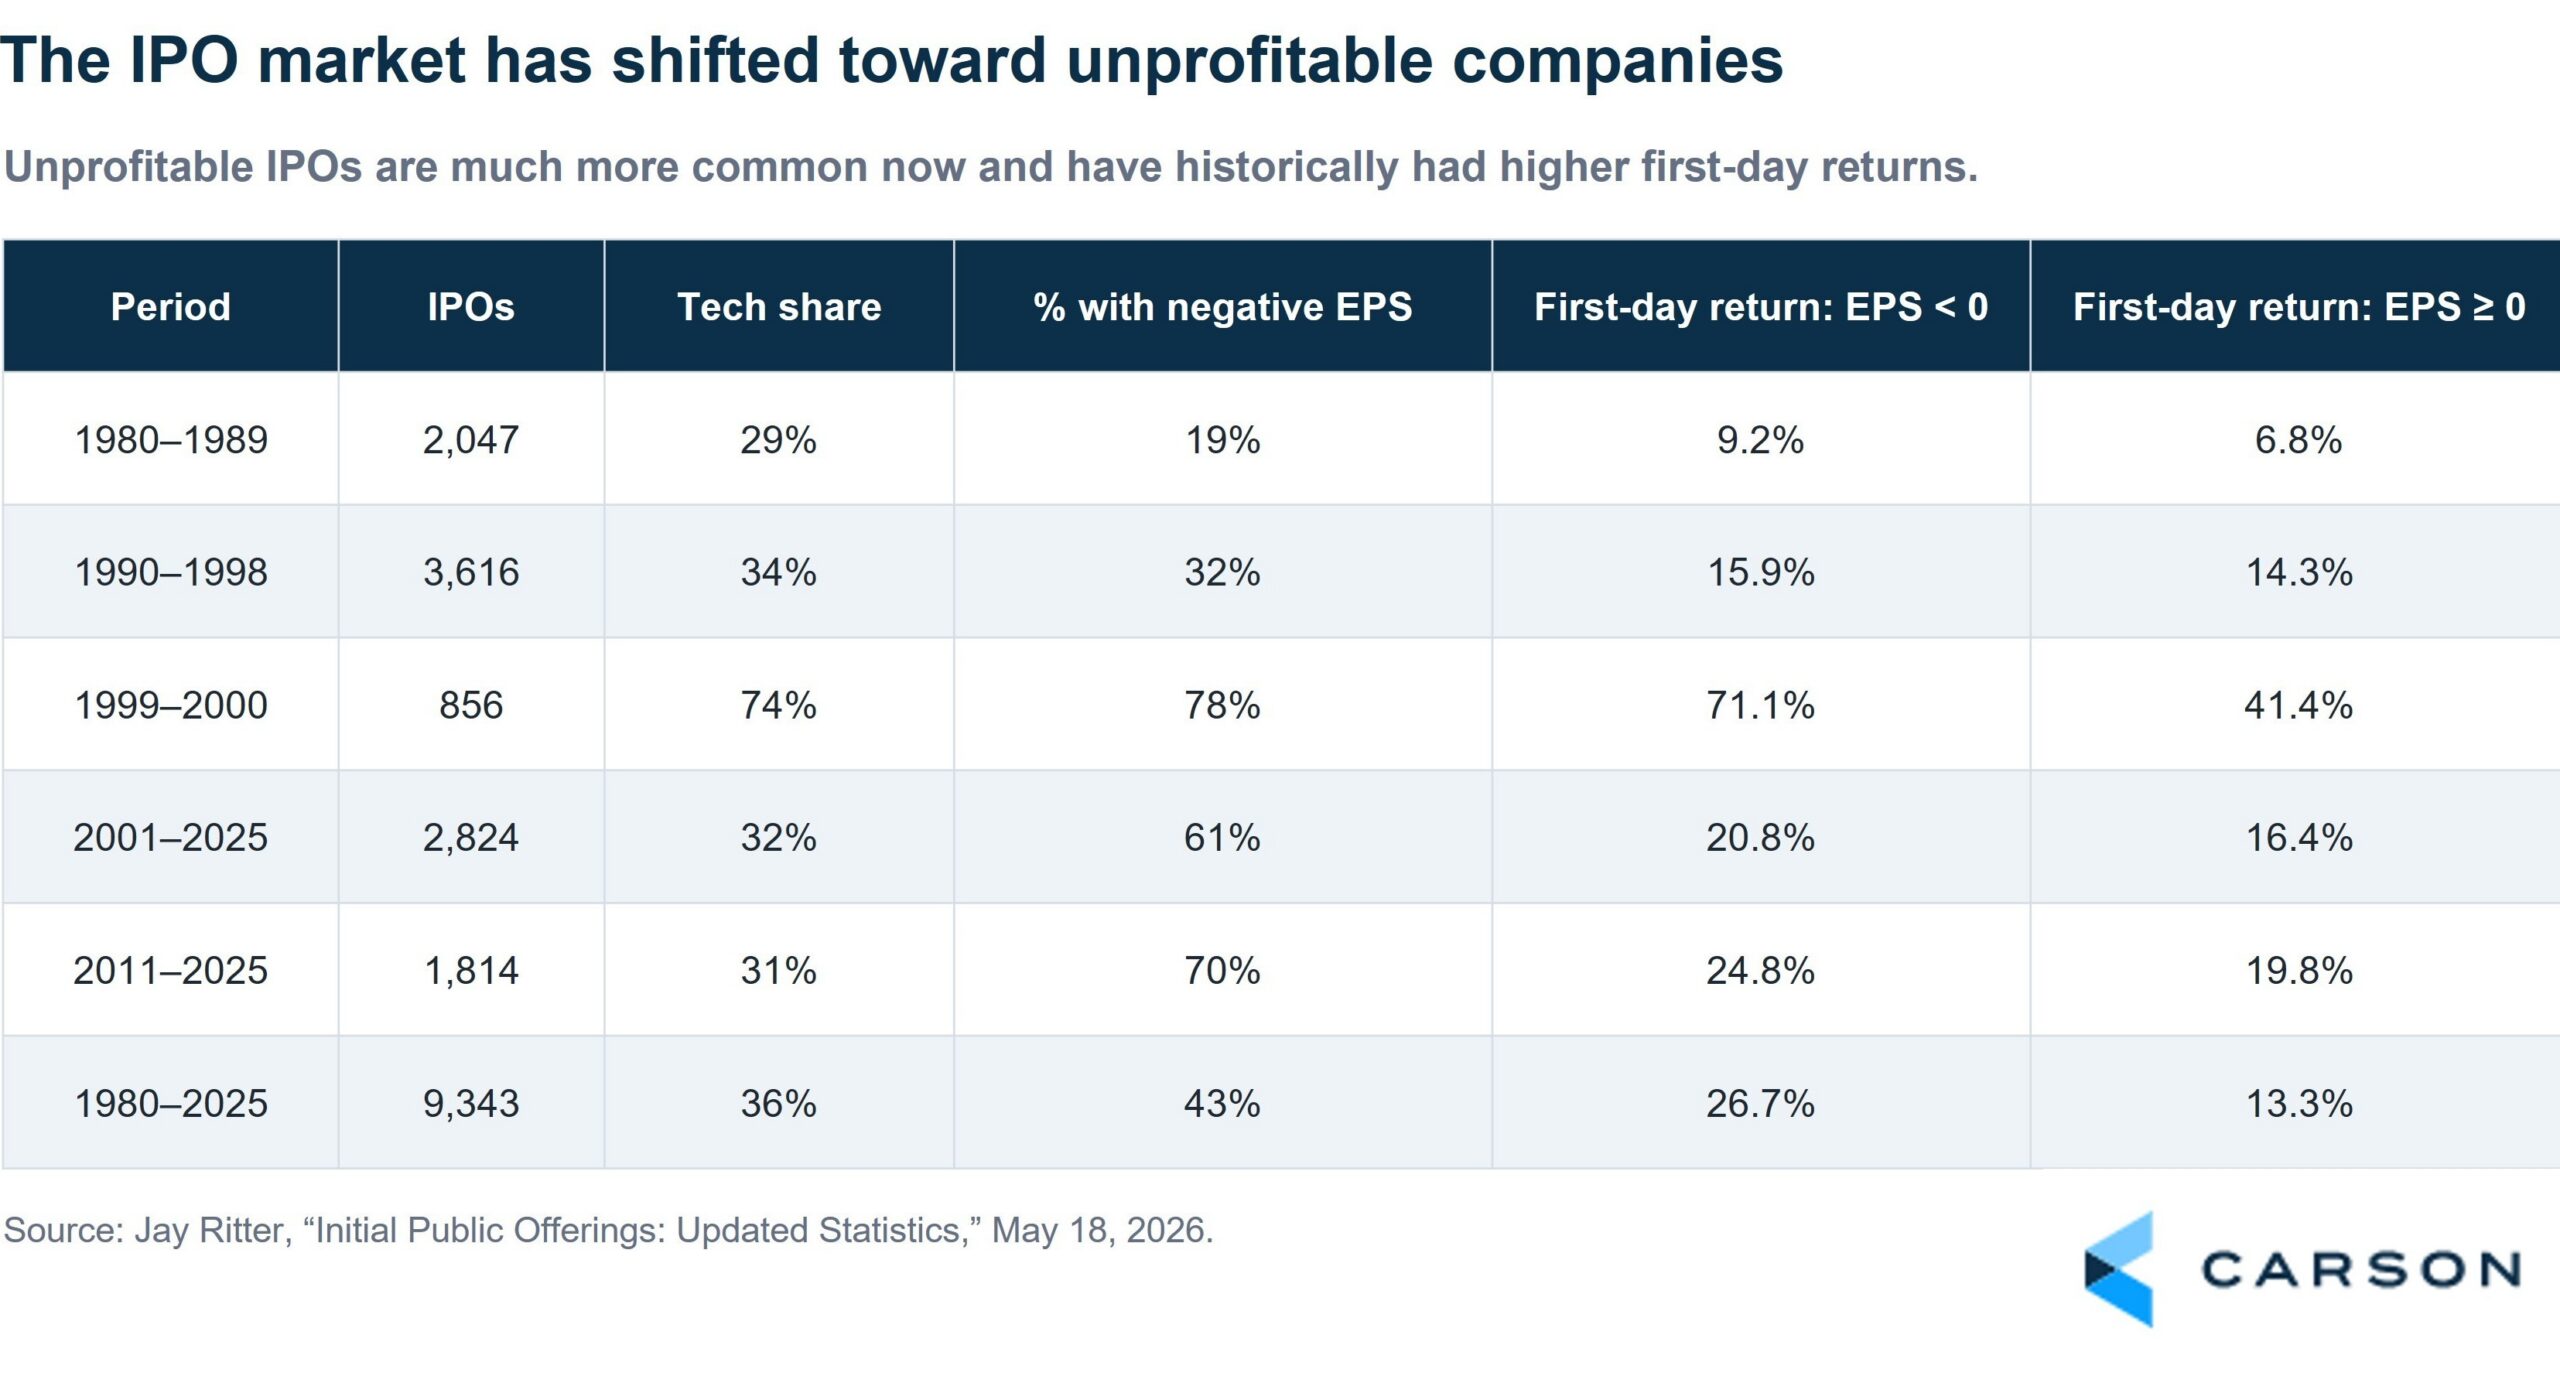
Three: IPOs have shifted toward less-profitable companies, but those have higher first-day pops
From 1980 to 2025, 43% of IPOs had negative trailing earnings, and that share has shifted higher over time. It was 19% in the 1980s, rose to 32% from 1990 to 1998, surged to 78% during the 1999 to 2000 bubble, and ran at 61% from 2001 to 2025 (and 70% from 2011 to 2025). Interestingly, the average first-day return for IPOs with negative earnings was 26.7%, higher than the 13.3% average for IPOs with positive earnings.
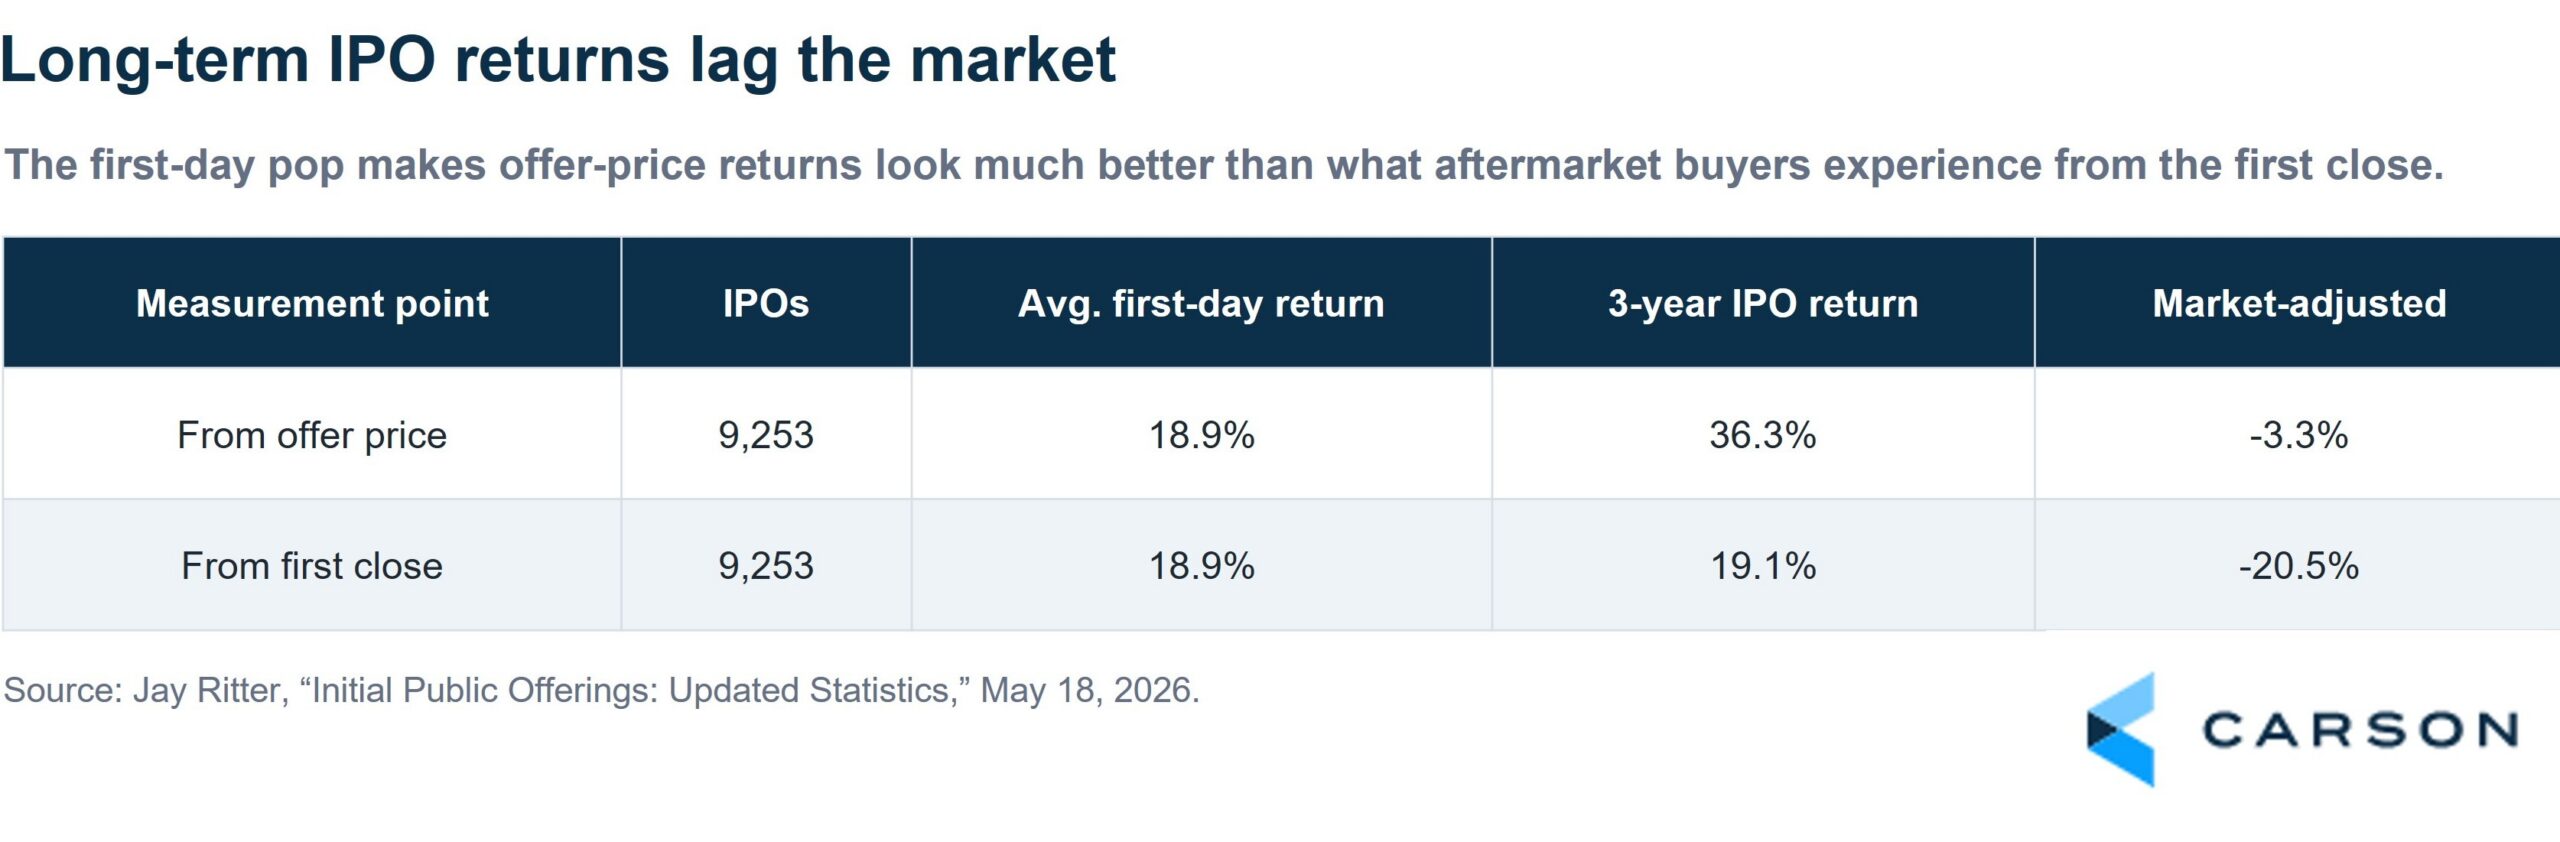
Four: Long-run IPO returns lag the market
If you are holding for three years, you are generally better off buying the broad market than the IPO. The average three-year buy-and-hold return from the first-day close was 19.1%, which lagged the market by 20.5 percentage points. Returns look better if you can get in at the offer price, with an average of 36.3%, but even that lagged the market by 3.3 points. The “market-adjusted” column below is the IPO’s three-year return from the first close minus the compounded market return over the same period.
Stay on Top of Market Trends
The Carson Investment Research newsletter offers up-to-date market news, analysis and insights. Subscribe today!
"*" indicates required fields
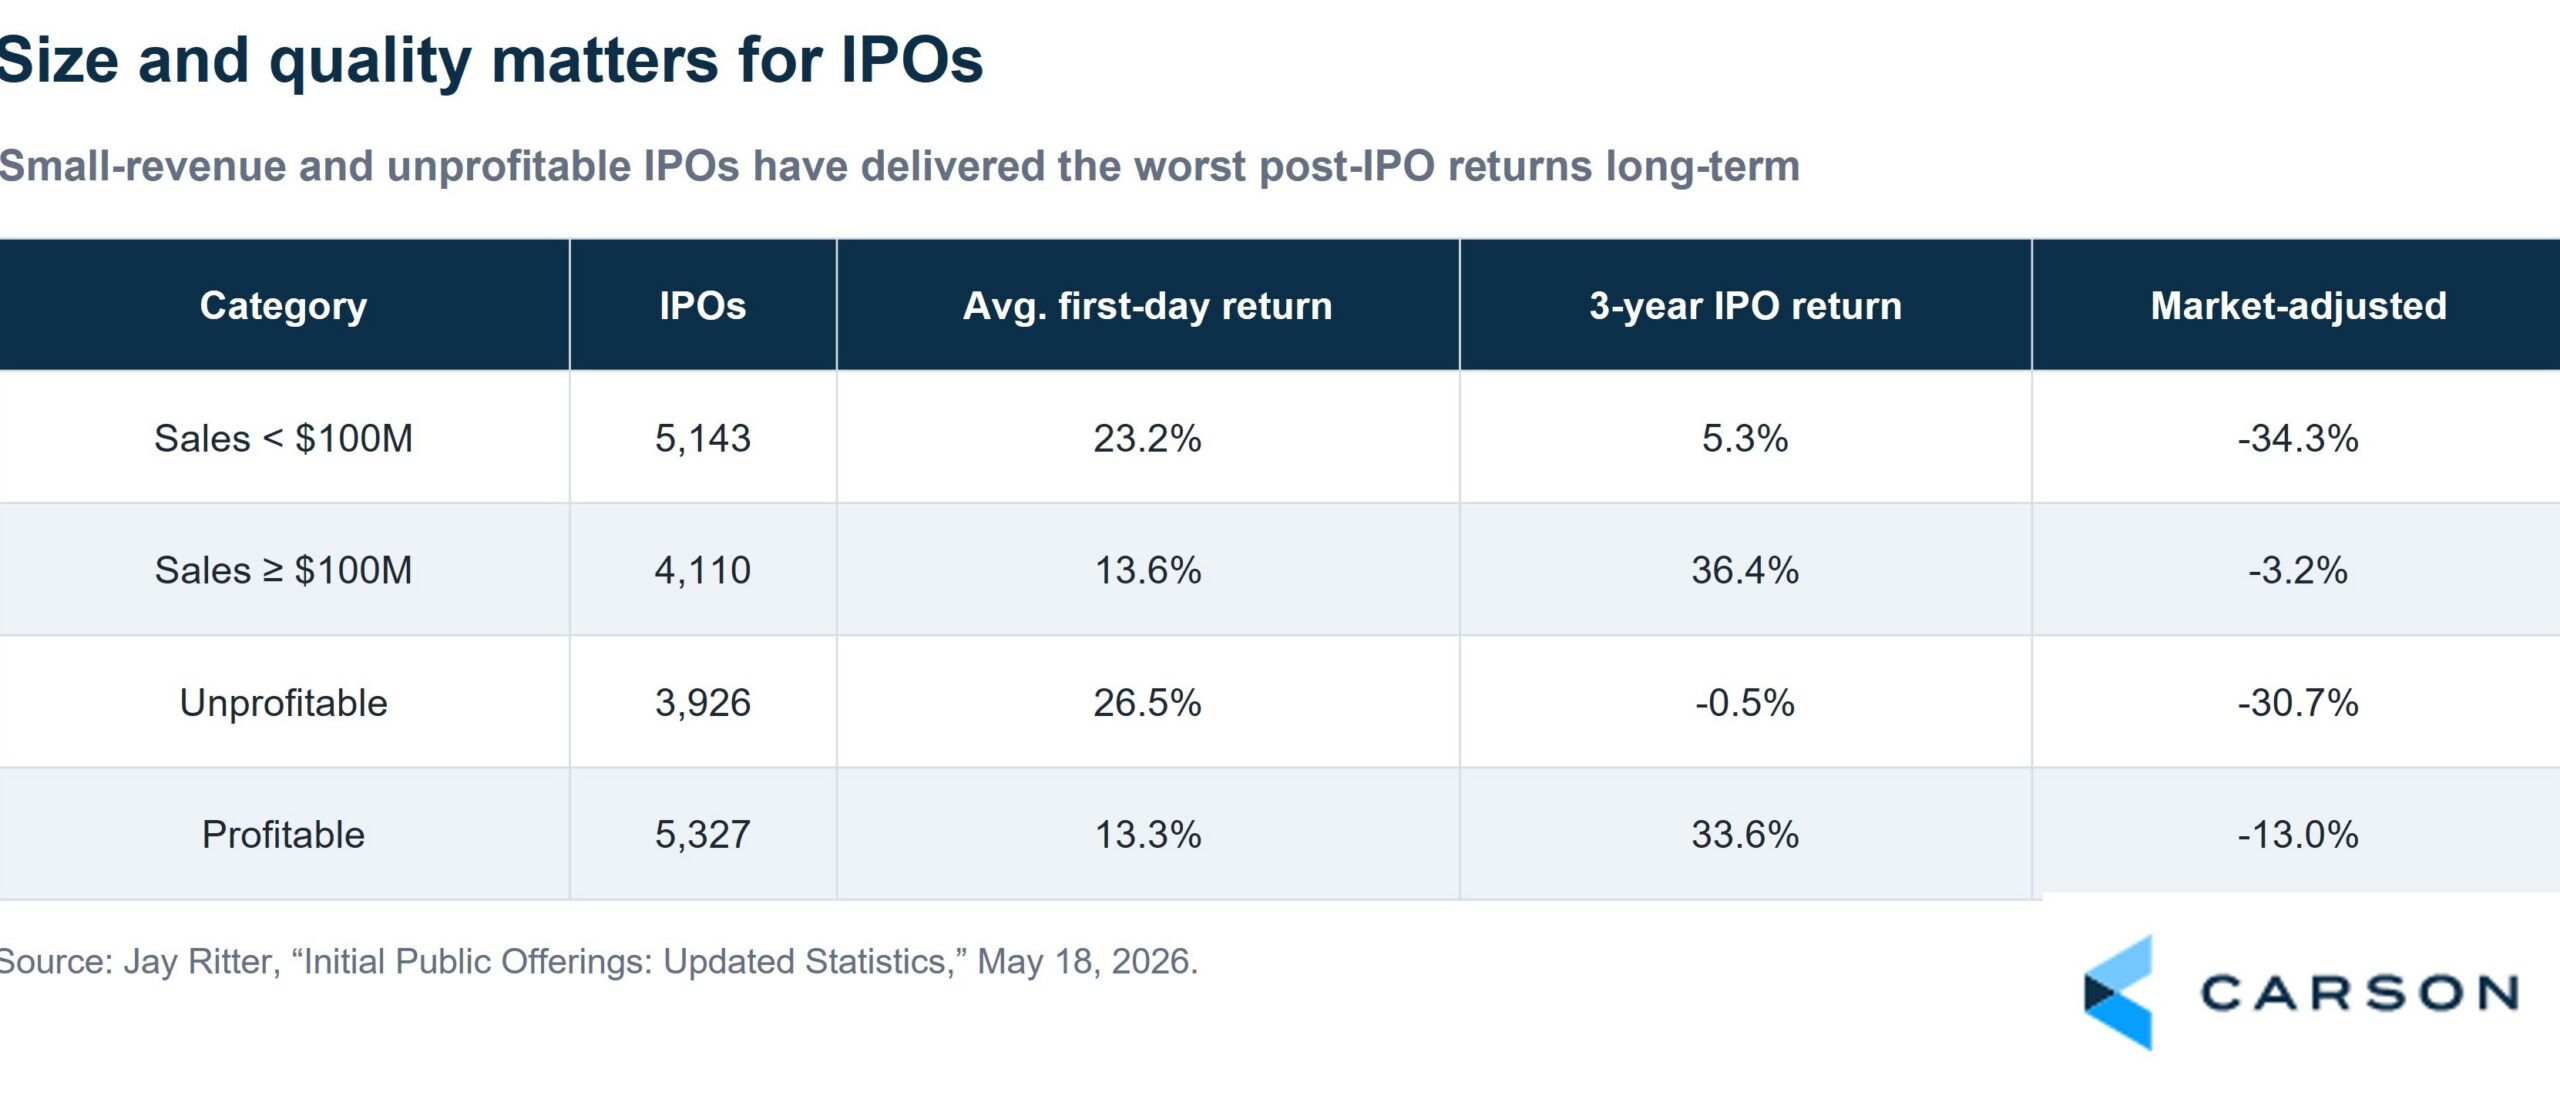
Five: Larger and more profitable IPOs fare better over the long term
Size and quality matter. Splitting by sales, IPOs with less than $100 million in sales had an average first-day return of 23.2% but a 5.3% three-year return, lagging the market by 34.3 points. IPOs with more than $100 million in sales popped less (13.6%) but returned 36.4% over three years, lagging by just 3.2 points. Splitting by profitability tells the same story: unprofitable IPOs popped 26.5% on day one but returned negative 0.5% over three years (lagging by 30.7 points), while profitable IPOs popped 13.3% and returned 33.6% (lagging by 13 points).
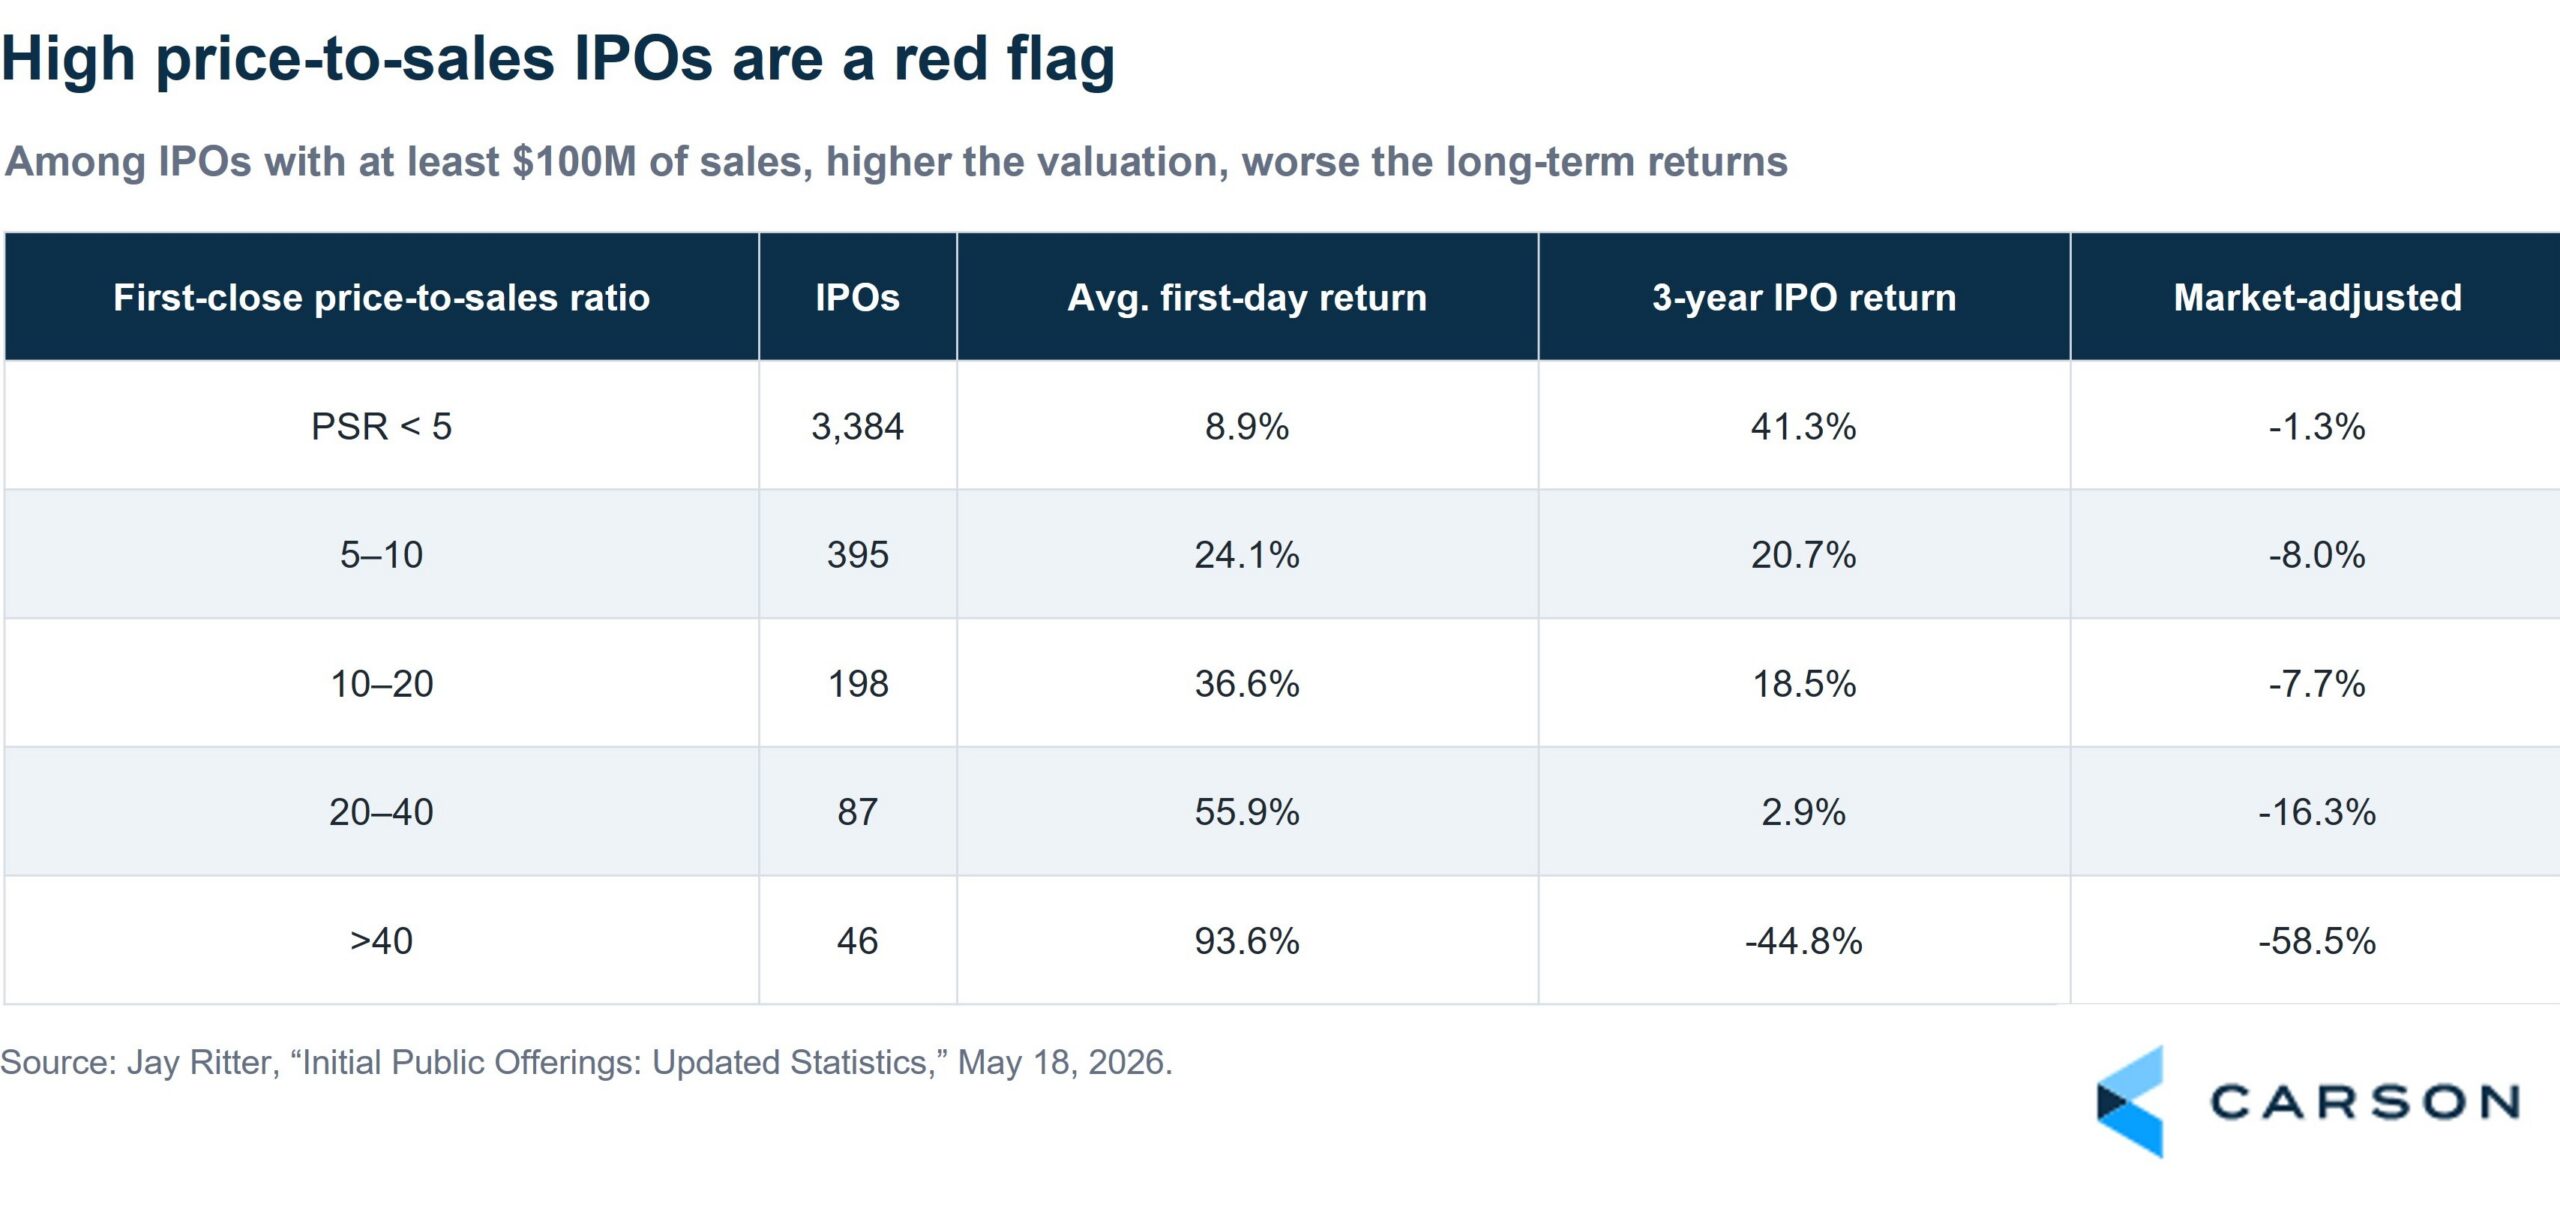
Six: High price-to-sales (P/S) ratios are a red flag
Among IPOs with at least $100 million in sales, the most expensive ones had the biggest first-day pops and then lagged the market badly. IPOs trading above 40 times sales popped 93.6% on day one but lost 44.8% over the next three years, lagging the market by 58.5 points. The cheapest, below 5 times sales, popped just 8.9% but returned 41.3%, lagging by only 1.3 points.
So, what about SpaceX?
A few numbers from the SpaceX S-1 are worth running through this same lens. Its 2025 revenue was about $18.7 billion, well above the $100 million mark. But assuming a $1.7 trillion valuation, the price-to-sales ratio would be roughly 91 times, off the right side of the chart above. And SpaceX is unprofitable, reporting net losses of $4.9 billion in 2025 and $4.27 billion in the first quarter of 2026. Just based on history, you would expect a very large pop on day one, followed by a slog over the long term.
The bigger picture: a flood of new stock
There is a market-wide angle here, too. When a company goes public, it creates new shares for investors to buy, so a wave of giant IPOs means a lot of new stock hitting the market at once, and there is only so much investor cash to absorb it.
According to Goldman Sachs (via the Financial Times), 2026 U.S. IPO volume could reach $225 billion. SpaceX alone could raise around $75 billion, more than the total of every 1999 IPO combined. And the IPO is only the first wave. Insiders, such as founders, employees, and early investors, are usually restricted from selling for about 180 days after the IPO, a period known as the lock-up period. When those lock-ups expire, a second wave of shares becomes available to sell. Goldman estimates that recent and upcoming IPOs could unlock roughly $500 billion in additional shares in 2026, with even more in 2027.
Why does this matter? For most of the past two decades, companies were actually shrinking the supply of stock through buybacks, which helped push prices higher. That is now reversing, as heavy AI spending eats into buybacks while a record amount of new equity arrives. Some strategists point out that big IPO years have often lined up with market tops, partly because insiders tend to cash out when they sense the public is paying up. It is something to keep an eye on, even if it is far from a sure thing.
The bottom line
None of this means you should avoid IPOs. It means being selective and not getting swept up in the day-one excitement. The companies that reward long-term holders tend to be larger, profitable, and reasonably valued. That aligns with what we found in our first Earnings Check-In: Q1 was strong, but the gains were concentrated in profitable, high-quality companies. Quality tends to win over time.
One thing is certain. With SpaceX potentially becoming the largest IPO in history, and OpenAI and Anthropic lining up right behind it, this summer is shaping up to be one of the most remarkable stretches for IPOs we have ever seen. However it all plays out, we are about to watch some history get made, and we will be watching closely.
For more content by Sonu Varghese, Chief Macro Strategist, click here.
8959717.1. – 3JUNE26A