Perhaps more than stocks, the bond market usually tells a tale of what investors expect in terms of economic growth, Federal Reserve (Fed) policy, and inflation expectations. It doesn’t mean the bond market will be correct, but it’s useful to understand what the message of the bond market is.
We’ve seen the yield curve steepen quite rapidly in recent weeks and months, especially since Liberation Day on April 2. At the time, growth expectations were ratcheted down amid the tariff chaos. So, you would expect the curve to steepen, as short-term yields fall (on expectations of rate cuts) and longer-term yields also fall to a lesser degree, reflecting slower growth and the probability of a recession. Now growth expectations haven’t rebounded to where they were at the start of the year, but recession odds have certainly fallen. Despite this, the curve has continued to steepen.
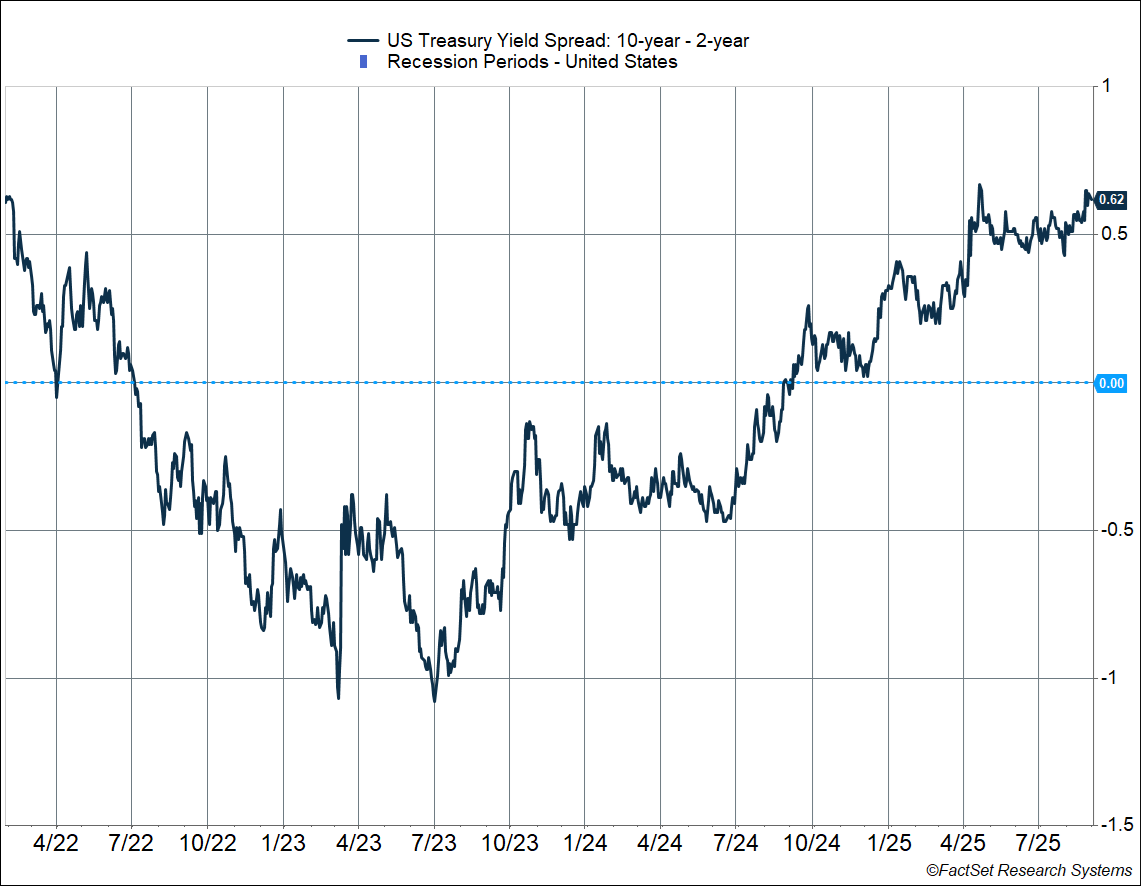
Let’s look at the spread between 10-year and 2-year Treasury yields (“10y/2y spread”):
- Latest (September 2, 2025): +62 bps (note: 1 bp = 0.01%)
- April 2, 2025: +29 bps
- December 31, 2024: +33 bps
As you can see, the 10y/2y spread is well above where it was at the start of the year. But that’s weird. When investors expect strong growth, like at the start of the year, we would expect a steepening of the yield curve—expectations for rate cuts fall (thus keeping short-term yields steady) and long-term yields rise on the on the back of higher economic growth expectations.
However, growth expectations have fallen this year, especially after Liberation Day, in which case we’d expect to see:
- Rate cut expectations rise, sending 2-year yields lower
- Lower growth expectations sending the 10-year yield lower as well
In other words, we ought to have seen some sort of a parallel shift in the yield curve. Instead, the 10/2y spread has widened to almost twice what it was at the start of the year. The spread is now close to its highest level since February 2022 (before the Fed started raising rates rapidly). For two whole years, the 10y/2y spread was negative as the Fed ratcheted up policy rates to fight inflation, sending short-term yields above long-term yields.
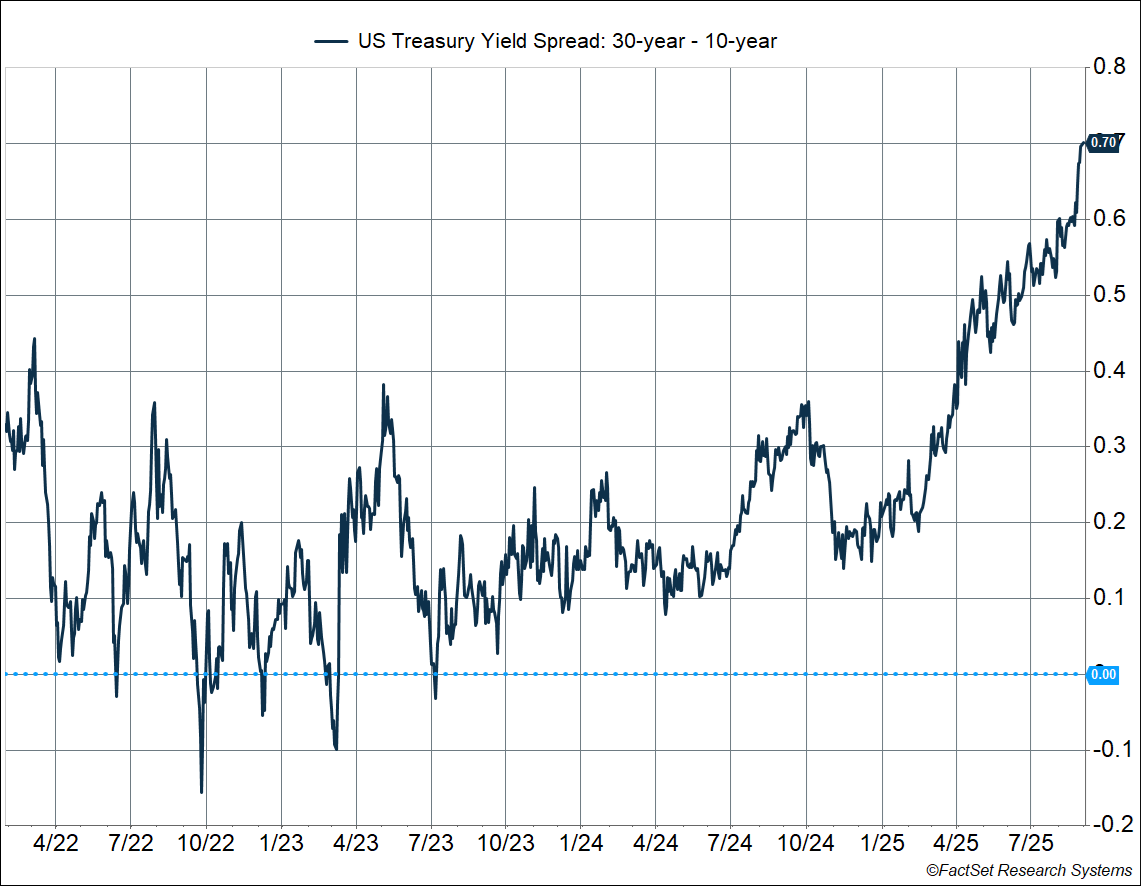
In fact, we’ve seen a similar dynamic even at the very long end of the curve. Looking at the spread between the 30-year Treasury yields and the 10-year Treasury yields (“30y/10y spread”):
- Latest (September 2, 2025): +70 bps
- April 2, 2025: +36 bps
- December 31, 2024: +21 bps
This has mostly come on the back of higher 30-year yields, as 10-year yields have mostly stayed steady since Liberation Day, and actually have fallen since the start of the year.
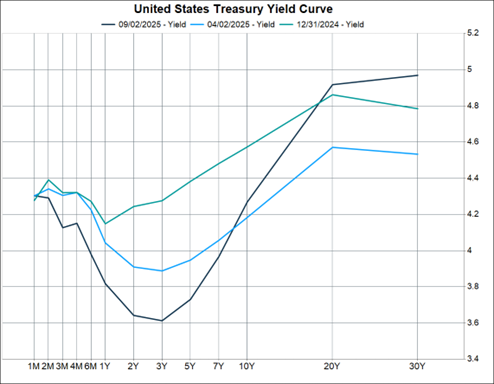
It’s probably useful to look at the full yield curve as well, and compare its current shape to that on April 2 and end of last year. Here’s the story:
- Yields pulled back across the board between the end of last year and Liberation Day as investors priced in a weaker economy.
- But since Liberation Day, we’ve seen a pivot around the 10-year, with short-term yields falling a lot while long-term yields have risen.
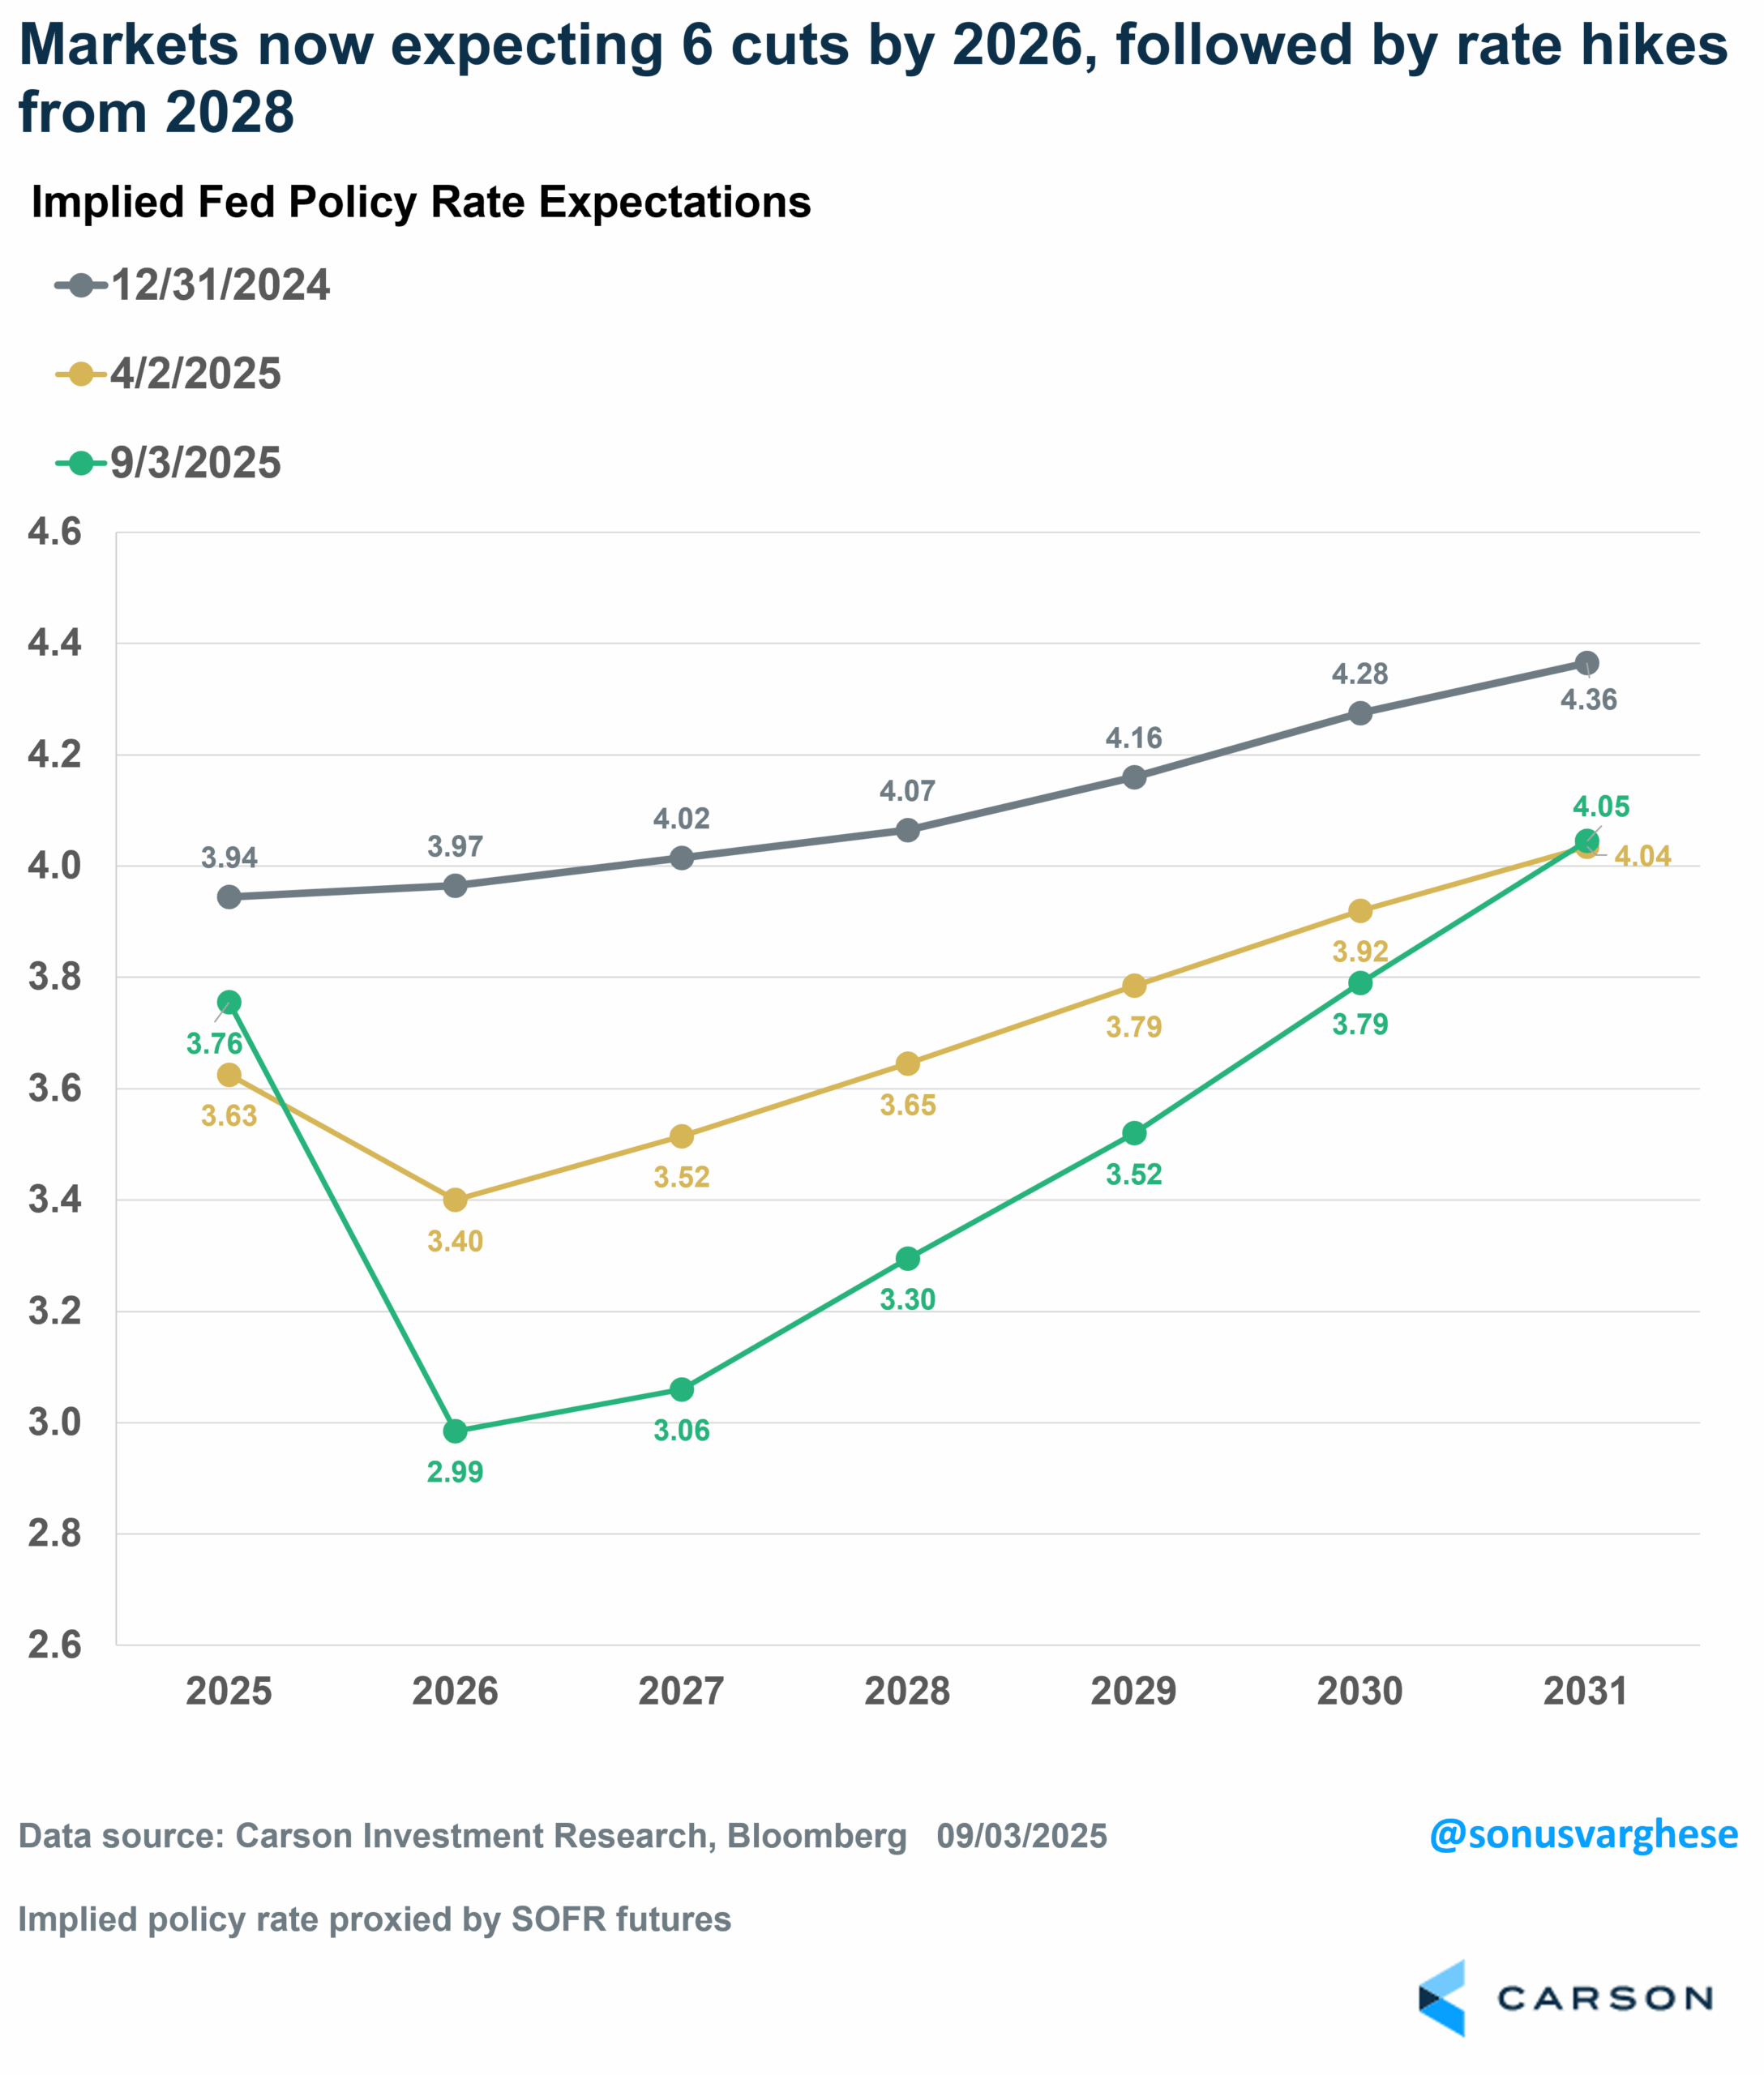
Since short-term yields mostly track implied Fed policy rate expectations in the near term, let’s take a look at what happened there. At the start of the year, markets were expecting just about 2 cuts in 2025, or a policy rate of ~ 3.9% (versus the current level of 4.4%), and none in 2026. No surprise, that fell to about 3.6% after Liberation Day, implying 3-4 cuts in 2025 (each worth 25 bps), followed by another cut in 2026, taking the Fed policy rate to around 3.4%. Then it got funky.
Since Liberation Day, recession odds have fallen and growth expectations aren’t as bad (but I still wouldn’t call it great, especially relative to the start of the year). Right now, markets expect the fed policy rate to end 2025 around 3.8%, implying about 2 cuts (with about 20-30% probability of a third). However, markets now expect 3-4 more cuts in 2026, taking the policy rate to around 3%.
To summarize:
- Investors expected 2 cuts in 2025-2026 at the start of the year.
- After the chaos of Liberation Day, and a severe cutback in growth expectations (and much higher recession odds), markets priced in a total of 4 cuts across 2025-2026.
- Recession odds have fallen since Liberation Day, but markets now expect 6 cuts across 2025-2026.
The chart below shows implied policy rate expectations for upcoming years and compares the curve at the three different points in time. You can see how markets now expect many more rate cuts in 2026 than at the start of the year or even on Liberation Day. Investors think the Fed will even start hiking rates in 2028. So we have pretty accommodative policy priced in for the next two to three years.
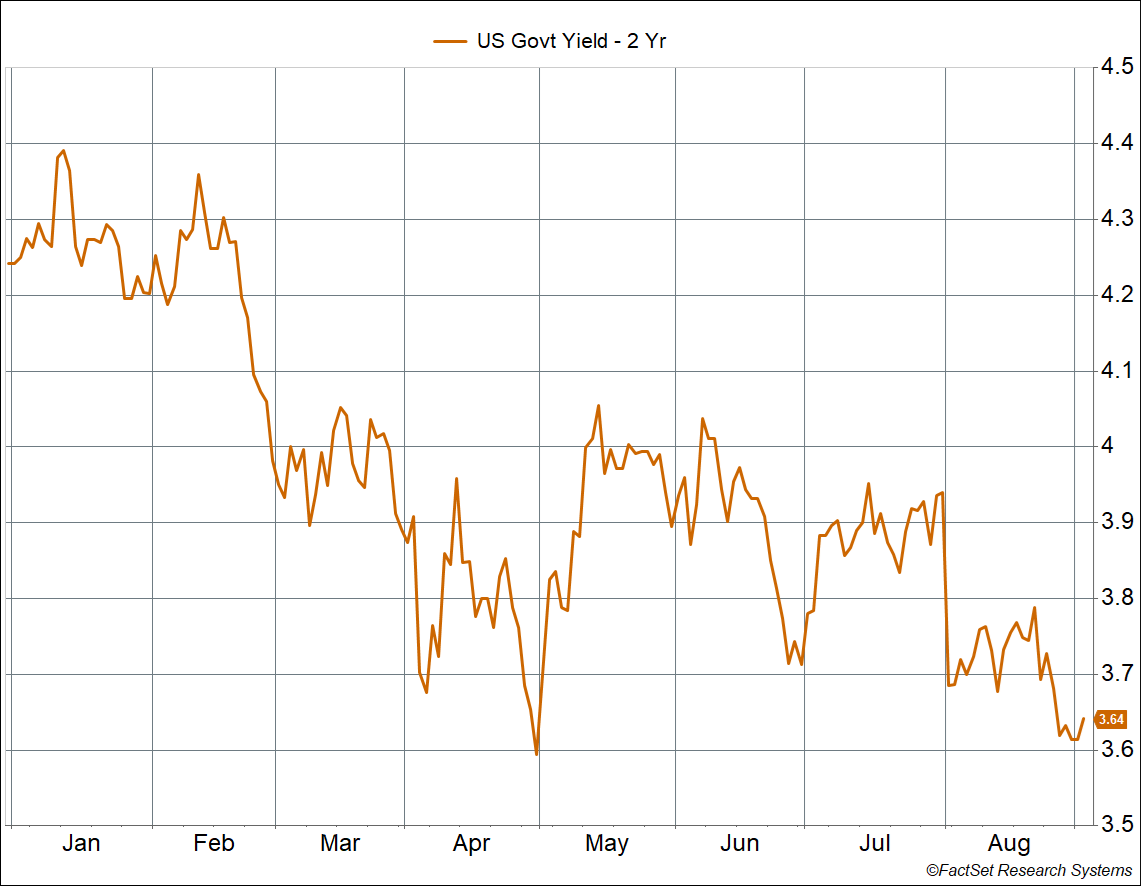
This brings us back to why 2-year yields, which are an approximation of average expected policy rates over the next 2 years, have plunged to levels we saw during the worst of the tariff chaos in April. Simply put, markets expect a lot more rate cuts. In fact, what’s surprising is that the 2-year hasn’t fallen even more—the 2-year yield is at 3.6% whereas it should be about 20-30 basis points lower based on implied policy rate expectations. But it’s early days yet.
Meanwhile, Inflation Expectations Are Higher
It would be one thing to expect a lot more rate cuts if:
- Growth expectations were collapsing and a recession was on the horizon, and/or
- Inflation was headed lower
We have neither right now. The economy is certainly not running as fast as it was in 2023-2024, and expectations are a lot lower. But it’s not as bad as it was in April and odds of a recession have fallen since that time.
But the market’s inflation expectations have been surging, not going down.
I usually use the difference between “nominal” and “real” yields (from Treasury Inflation Protected Securities – TIPS) to gauge inflation expectations. But this is useful for only the 5-year and 10-year mark, with anything below that extremely noisy Instead, for short-term expectations I like to look at inflation swaps.
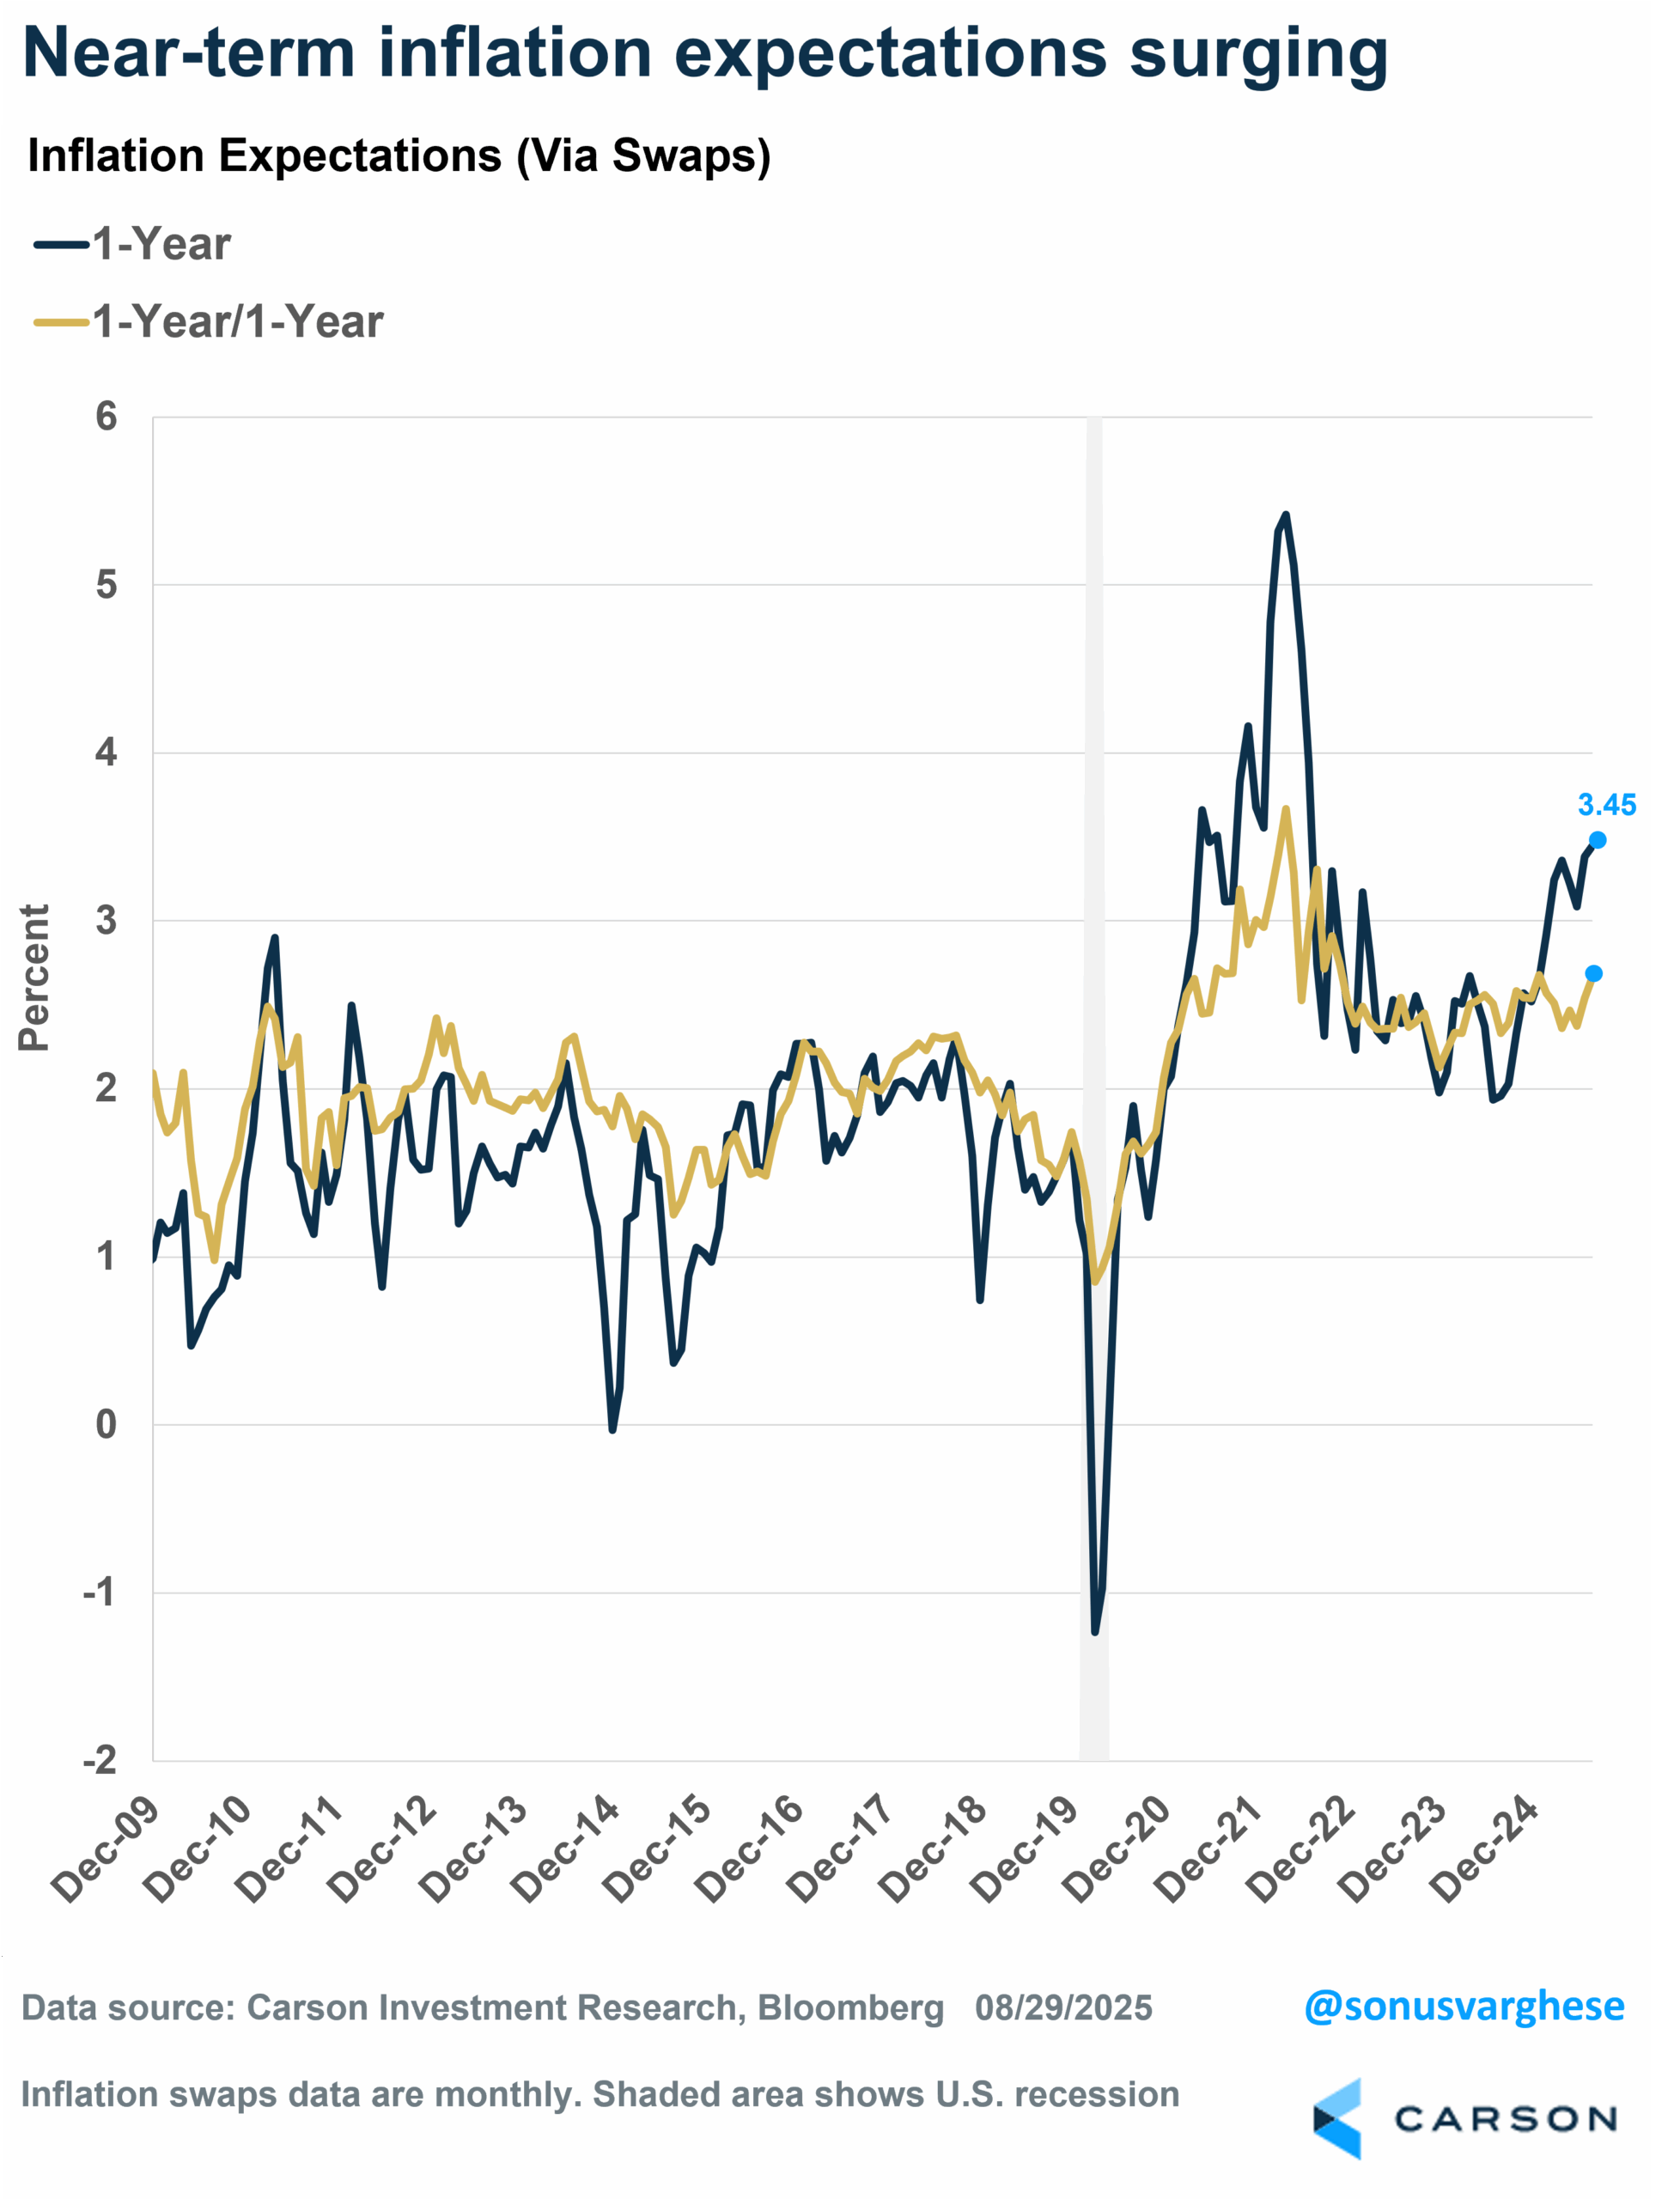
1-year inflation swaps have surged over the last 2 months, heading close to 3.5%—that is the highest level since early April (post-Liberation Day). It was closer to 2.5% at the end of last year and about 3.1% two months ago (end of June). The current level is the highest we’ve seen since August 2022. A couple of things are likely driving the recent surge:
- Inflation remains elevated, with the tariff impact beginning to show up and expected to increase.
- We have dovish policy by the Fed even in light of higher inflation, which could potentially fuel the inflation problem.
I also calculated “1-year/1-year” expected inflation, using data for 1-year and 2-year inflation swaps, which is inflation expected over the year after the 1st year. Note that 2-year inflation is the average of the first two years and can be skewed by high inflation in the first year.
Usually 1-year and 1-year/1-year inflation expectations are correlated and move in the same direction, though 1-year expectations are more volatile. But we’re not seeing the same surge in 1y/1y expectations that we are for 1-year expectations, so it looks like markets also expect the inflation surge to be “transitory.”
But it’s elevated. 1-year/1-year inflation expectations are close to 2.7%, up from 2.4% at the end of June and higher than anything we saw in the 2010s. Note that 2.3% would be consistent with the Fed’s 2% target, since swaps track CPI data and CPI runs about 0.3%-points hotter than PCE.
Near-term inflation expectations are also elevated relative to what we saw pre-pandemic. Interestingly, even during the 2018-2019 trade war inflation expectations (1-year and 1-year/1-year forward) were running around 2%. And keep in mind this isn’t a survey (which tends to be more influenced by politics). These are market-based expectations.
What’s incredible is that the market is pricing in a lot more rate cuts even as inflation is expected to be well above the Fed’s target over the next year, and heading in the wrong direction. And here’s one big takeaway: Investors seem to be pricing in a full capture of the Fed by the Trump administration by next year. From that perspective, what happens this year almost doesn’t matter, as markets are already looking beyond the next few months.
A Fed that cuts while inflation is running hot is very dovish, and I don’t see how that is not really bullish for equities in the near term. Nominal GDP is likely to run quite hot, even as real GDP is held back by:
- Falling real incomes
- Lower aggregate income growth due to a big pullback in immigration
Keep in mind that profits are keyed off of nominal GDP growth, not real growth (a key part of why I believe stocks should be considered real assets). Then it’s just a question of how much of the inflation costs companies can pass through to consumers, versus taking a hit to their margins. Lower real growth means lower real income growth, which would be a hit to consumption. But if rates are low, consumers will likely start funding consumption with debt. That’s ok, for a while at least. Consumer leverage is at 25-year lows and so there’s a lot of “dry powder.” The match needed is lower interest rates, and it looks like we may get it (assuming the market is right—it has a way of changing its mind).
Ryan and I talked about a lot about what’s happening in markets now, Fed policy, and inflation, in our latest Facts vs Feelings episode. Take a listen below.
8352524.1-03Sept25A
For more content by Sonu Varghese, VP, Global Macro Strategist click here.
