
The recent drawdown from all-time highs (-5% intraday at the time of this writing) has done nothing to tarnish a great year for broad equity markets. With any strong run in the market, examining where valuations end up as a result is a worthwhile exercise. Often, price appreciation is warranted on the back of strong earnings growth and fundamentals – something we are no doubt seeing today. As third-quarter earnings season comes to a close, 82% of companies have beaten expectations and the year-over-year growth rate is more than 13% (according to FactSet)! Those are fantastic numbers, yet despite the strong earnings growth we still see valuations for certain segments of the market at elevated levels. Having a broadly diversified portfolio that’s not “all in” on more expensive parts of the markets helps to provide balance going forward.
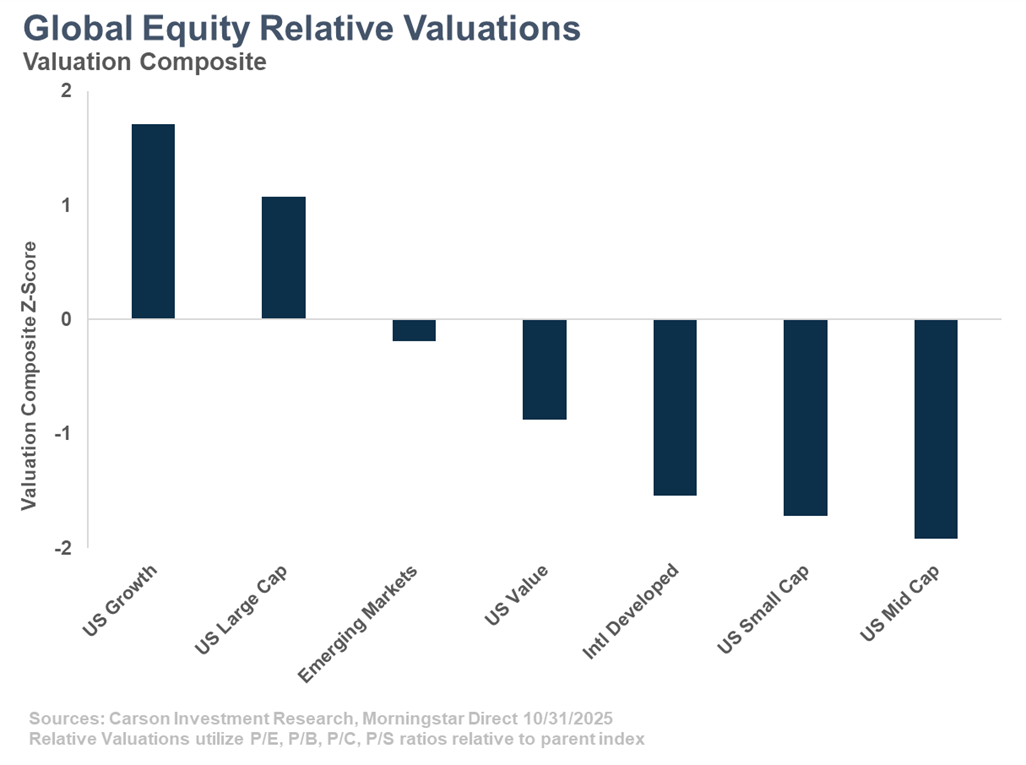
Looking at valuations at a global equity level, the same story that has been true for the better part of the last several years is playing out on the “expensive” side. US large cap and growth stocks are trading at higher valuations relative to their history than smaller-cap stocks and those overseas. As we have witnessed, this spread can persist for a long period of time, but at a certain point expectations for growth become exceedingly difficult to beat, with the opposite being true for beaten-down smaller cap stocks. It is interesting to note that despite a very strong year for developed international stocks, relative to their history they are still quite attractive from a valuation standpoint.
Looking at sectors, change is also minimal from what we’ve seen earlier in the year and corresponds with the same theme – tech and everything else. Generally, the more defensive areas of the market are trading cheap relative to their history, which is to be expected with a market run like we’ve seen. By definition, these areas of the market tend to hold up better when markets stumble like we saw in March and April. If stocks fall due to valuation concerns about certain pockets of the market, it’s a good bet these defensive areas could fare better.

A natural question to ask when looking at these relative comparisons is whether to remove – or at least minimizing – the amount of technology and technology-related exposures from the analysis. One simple way to do this is to look at the S&P 500 on an equal-weight basis. The equal-weight index has less than half the exposure to technology and communication services than the cap-weighted index, and no single stock is more than a few tenths of a percent (depending on last rebalance). Looking at these two indices in comparison using the same valuation composite but in absolute terms, we can see a widening spread between the capitalization-weighted and equal-weighted index. What’s important here is not necessarily the widening spread between the indices, but more that once you strip out the effects of the mega caps, there is a better and reasonable value proposition in the index than many valuations measures might give credit for. This connects back to the first chart, indicating that outside of mega cap growth there is plenty of attractive value for an investor to rotate into.

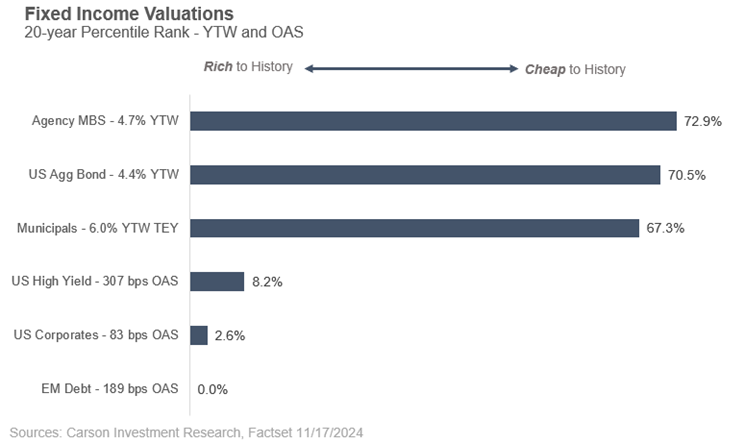
Fixed income can be looked at in a similar manner. For investors that hold a long-term spot in a portfolio for bonds, being cognizant of certain valuation measures within the components of portfolios is important. In the chart below, a higher value is better, indicating that the relative level of yield relative to what that asset class has offered historically is attractive. What is nice about this analysis is that with bonds, math rules the day. Bonds mature at par (barring default), and so returns can be predicted in a more accurate manner. High quality fixed income still looks good, agency mortgages and the broad aggregate bond index (of which a large portion is agency mortgages and Treasuries) trade at reasonable yield profiles. Spread sectors like corporates, high yield, and emerging markets, however, continue to trade at very tight spreads. In fact, based on our data, emerging-market debt (USD-denominated) has never traded at a tighter spread than right now. While these sectors may continue to offer decent absolute yields, the potential for additional spread tightening (and thus capital appreciation) remains quite low. Risks skew to the downside (i.e. spread widening), leading us to prefer taking risk in equities or alternatives while keeping fixed income high quality.
As always, the caveat to valuations is that they don’t matter until they do. Over- and under-valuation situations can remain that way for many years, but in certain choppy periods we have seen the market punish areas that are more expensive. As we look into 2026, the market continues to present many opportunities if you know where to look.
For more content by Grant Engelbart, VP, Investment Strategy & Research click here
8618486.1.-19NOV25A
