
“Not everything that can be counted counts.” -Albert Einstein
As you’ve probably heard many times by now if you follow the headlines, the US consumer is flush with debt and about to go under in a surge of bankruptcies and the end of civilization could be near. I’m joking, of course. We don’t think that’s actually true. But you still see that view plenty, unfortunately. Here’s one recent example.
Why does the consumer matter? Household consumption makes up close to 70% of our economy and if they are strong, safe to say a recession isn’t likely to happen.
Let’s not waste any more time here. The consumer actually appears quite healthy and we need to push back against the constant doom and gloom crowd.
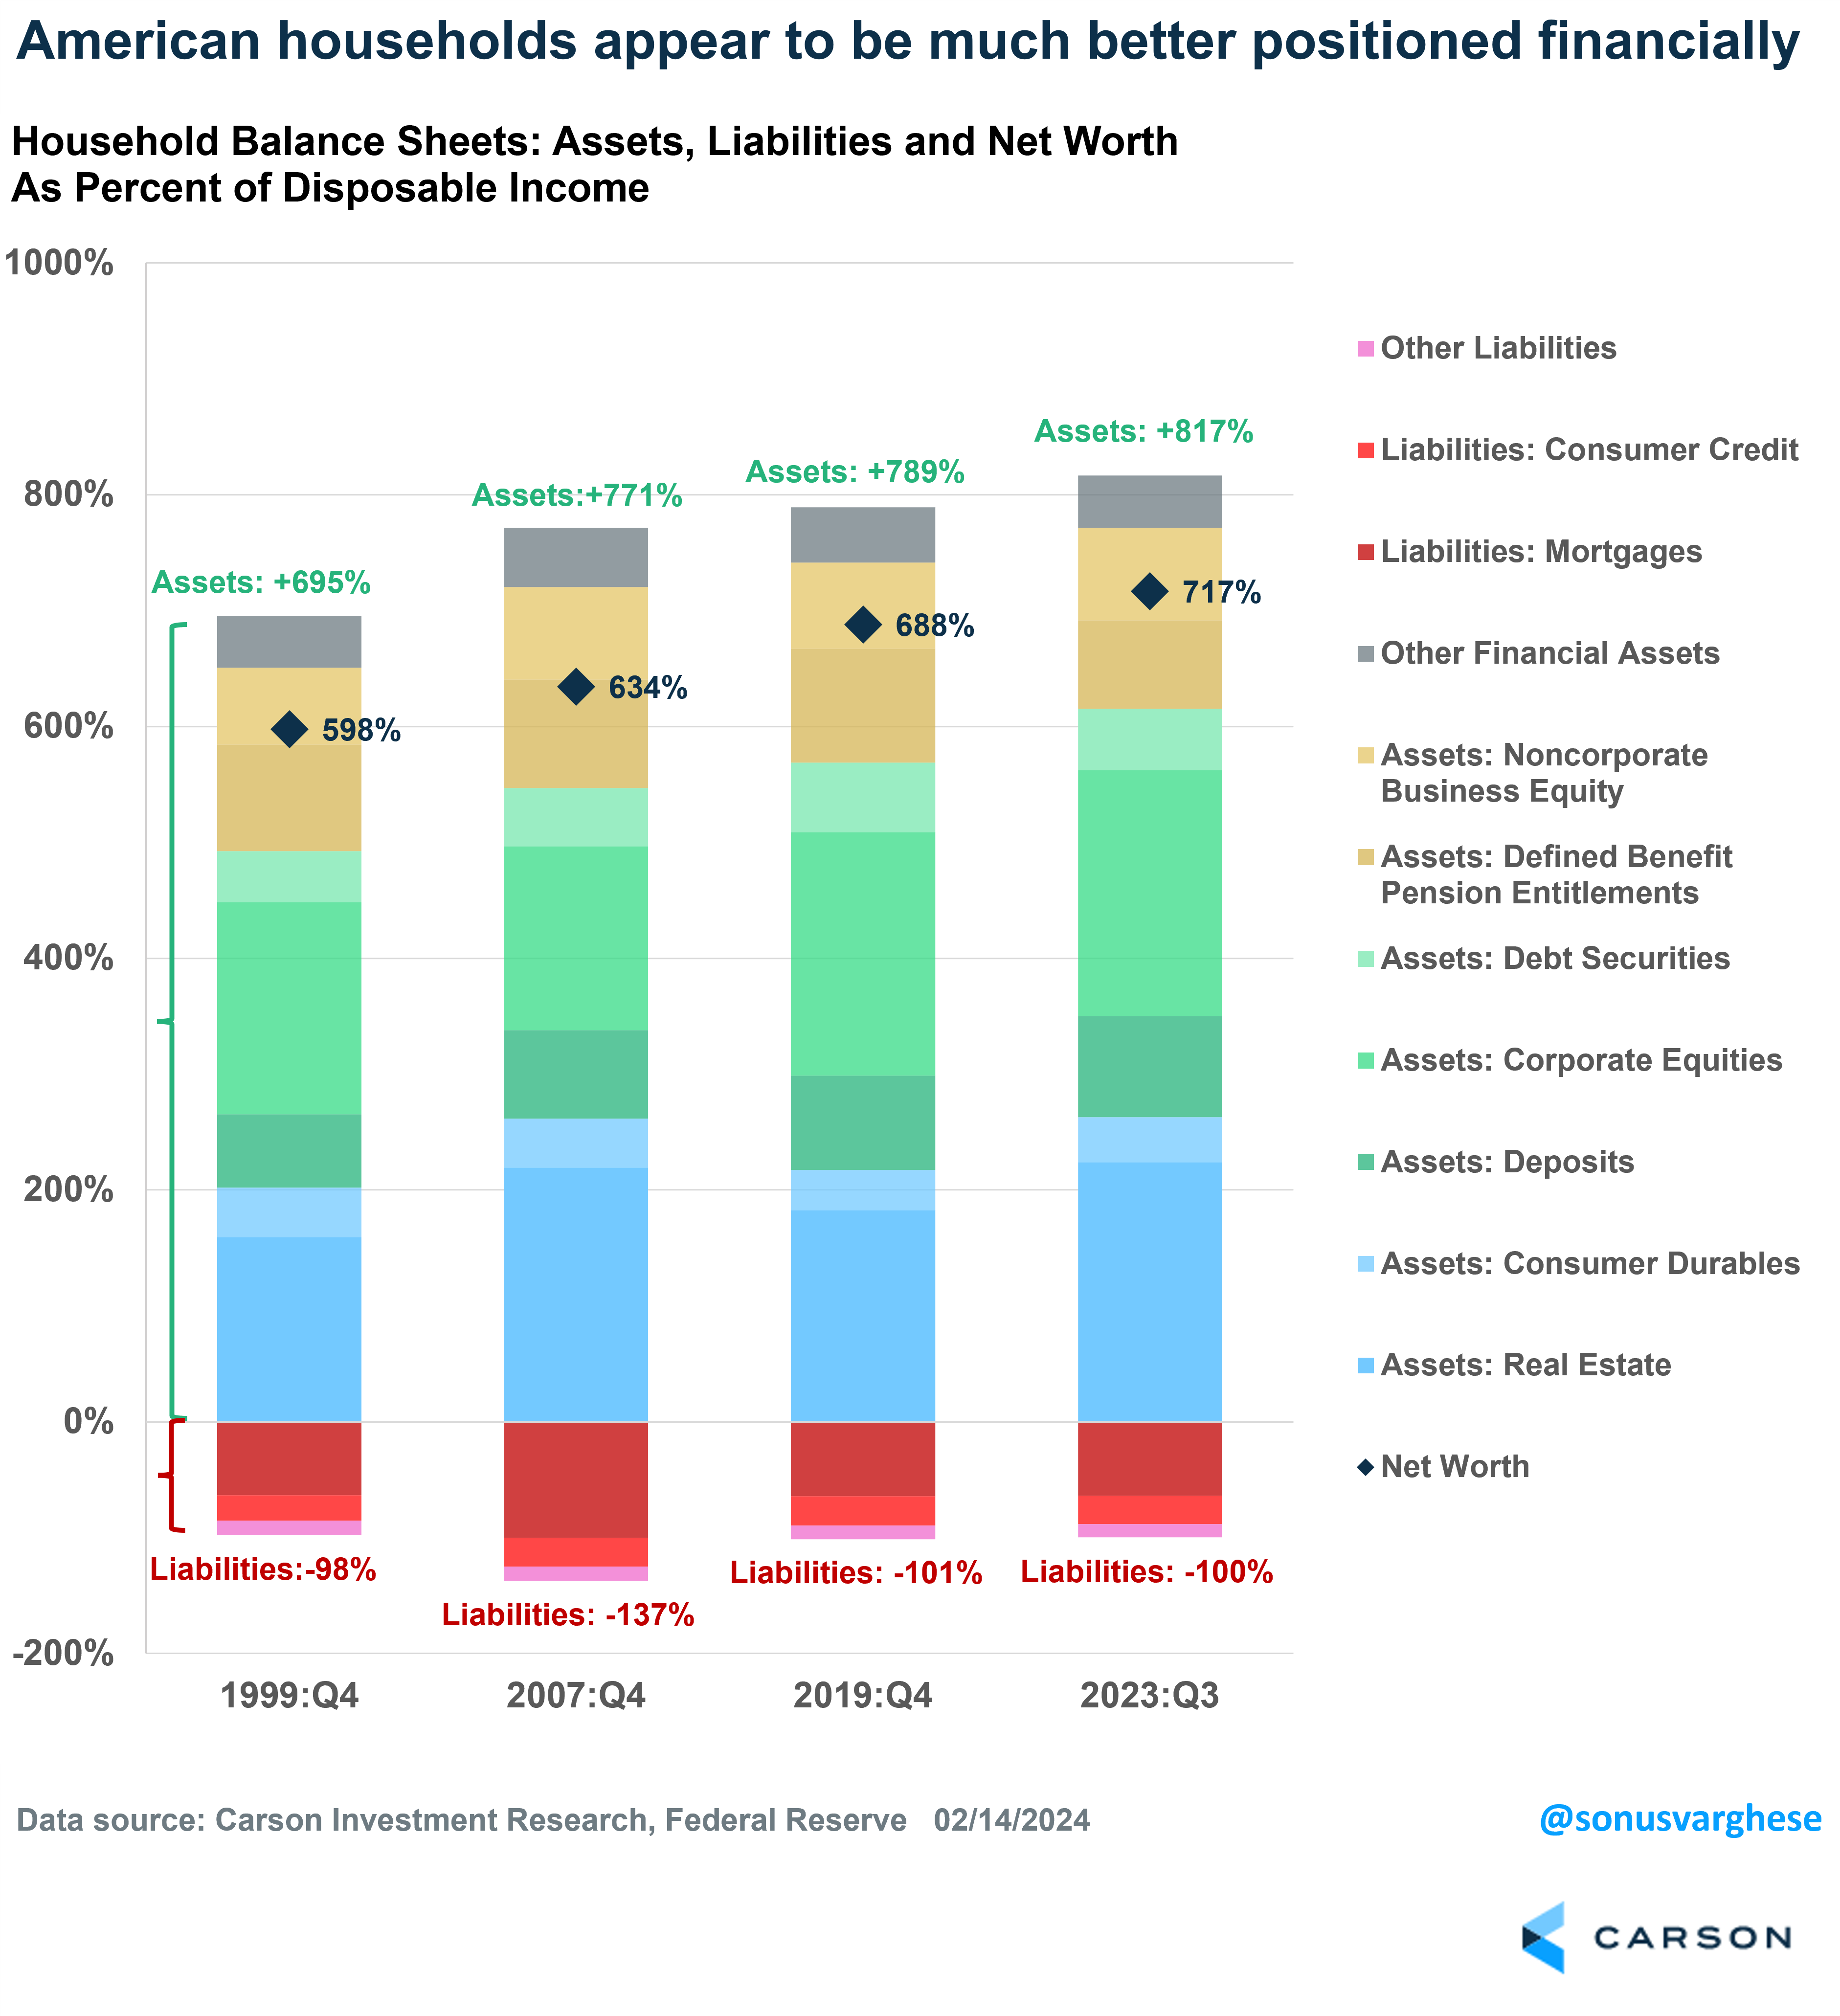
Household Balance Sheets Are the Best They’ve Been in Decades
Yes, we have a lot of debt (liabilities), as we hear about all the time. But what they don’t tell us about is equity (assets) are significantly higher. Have you owned a home or stocks the past five years? Safe to say your overall wealth has increased substantially as a result.
Stay on Top of Market Trends
The Carson Investment Research newsletter offers up-to-date market news, analysis and insights. Subscribe today!
"*" indicates required fields
Here’s a great chart from Sonu Varghese, Global Macro Strategist, that breaks down household balance sheets. He looked at assets (housing, stocks, cash, etc.), liabilities (mortgages, car loans, credit cards, student loans, etc.), and net worth, but as a percent of disposable income. Doing this showed that although we hear all the time about how much debt there is, it is right where it was in the late 1990s when looked at as a percent of disposable income (right near 100%). In fact, we might have more overall debt now than any time in history, but it is well off what we saw right before the Great Financial Crisis (GFC) started as a percent of disposable income (137% then versus 100% now). This happened because debt might be up, but disposable incomes are up substantially as well. (Many tend to focus on only the numerator, ignoring the denominator. We call this denominator blindness). Then as you can clearly see below, assets and net worth have increased more over time, suggesting household balance sheets are as good as they’ve been in decades. Again, this isn’t what the nightly news tells us when they talk about the consumer.
What About $17.5 Trillion in Debt?
Recent data from the New York Federal Reserve showed that overall total debt for US households was up to a record $17.5 trillion. How worried should we be? That’s a LOT of debt last I checked.
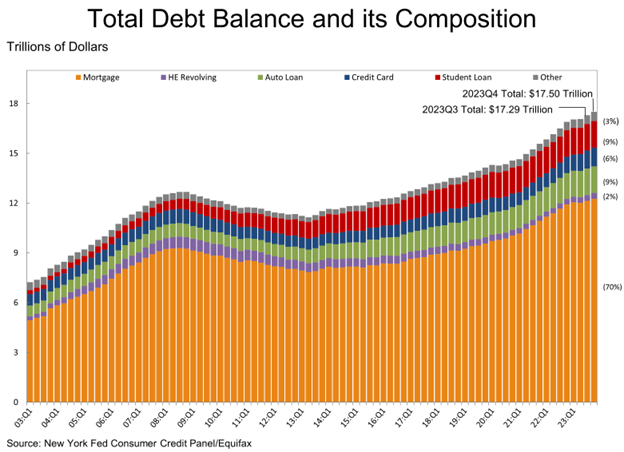
Overall debt has grown by $988 billion over the past year, consisting of:
-
- Mortgage debt: +583B
- Home equity: +$38B
- Auto loans: +$83B
- Credit card: +$204B
- Student loans: +$27B
The pace slowed to a 1.2% gain in the fourth quarter from a 1.3% jump in the third quarter. But here’s the real interesting take on this – disposable income increased $1.33 trillion! or 6.9% last year, well above any inflation metric you want to use.
It is quite rare to see disposable income grow more than overall debt. Also, since disposable income is used to service debt, households became less leveraged last year.
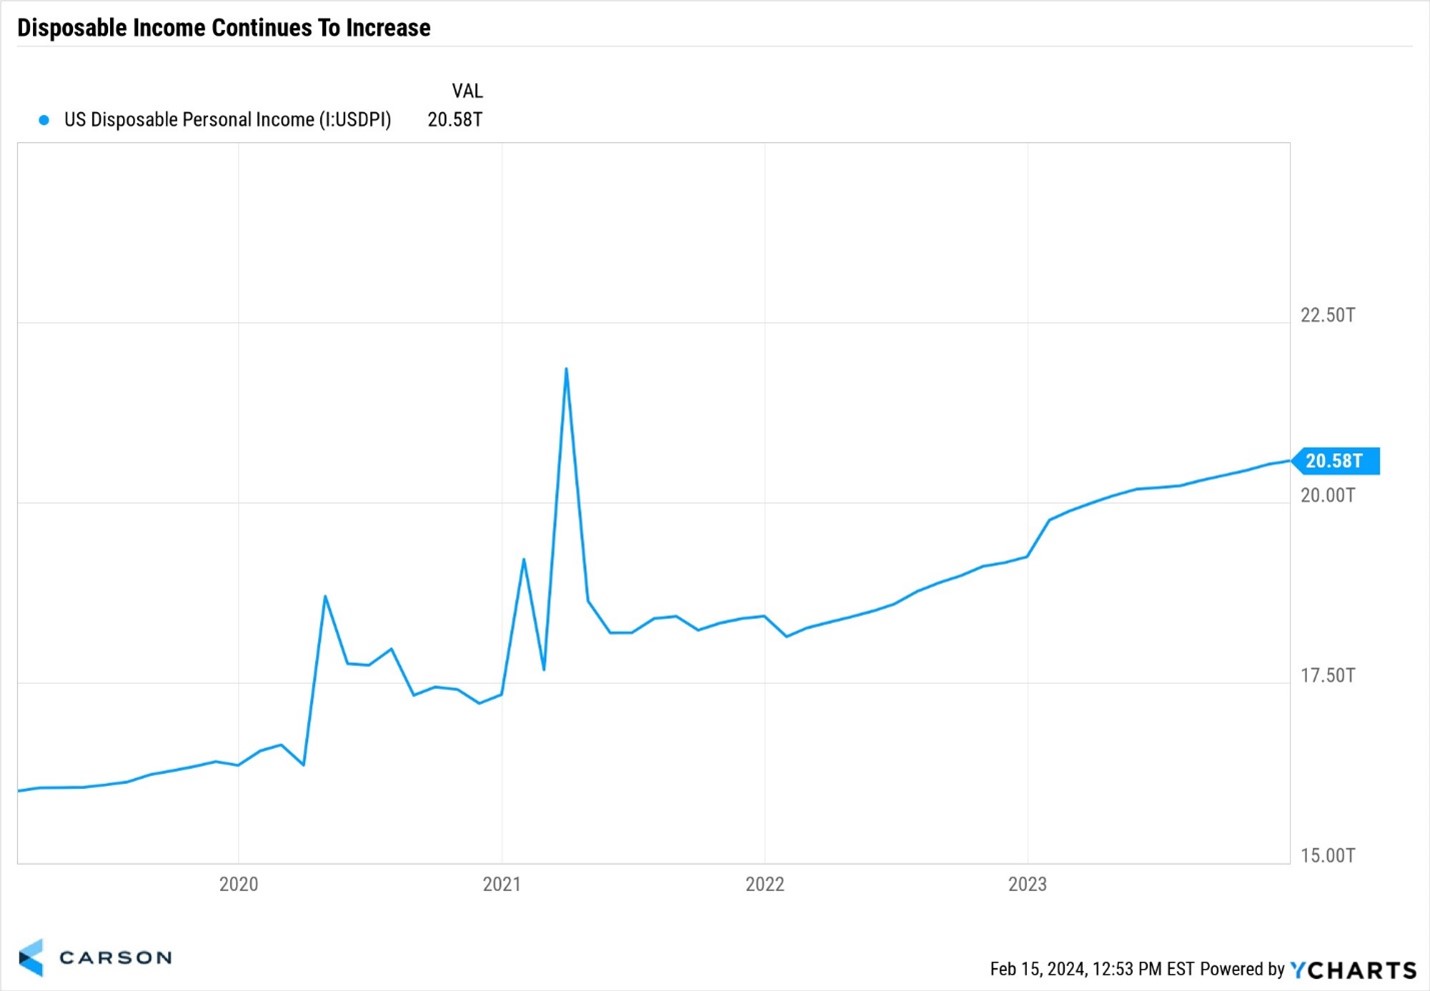
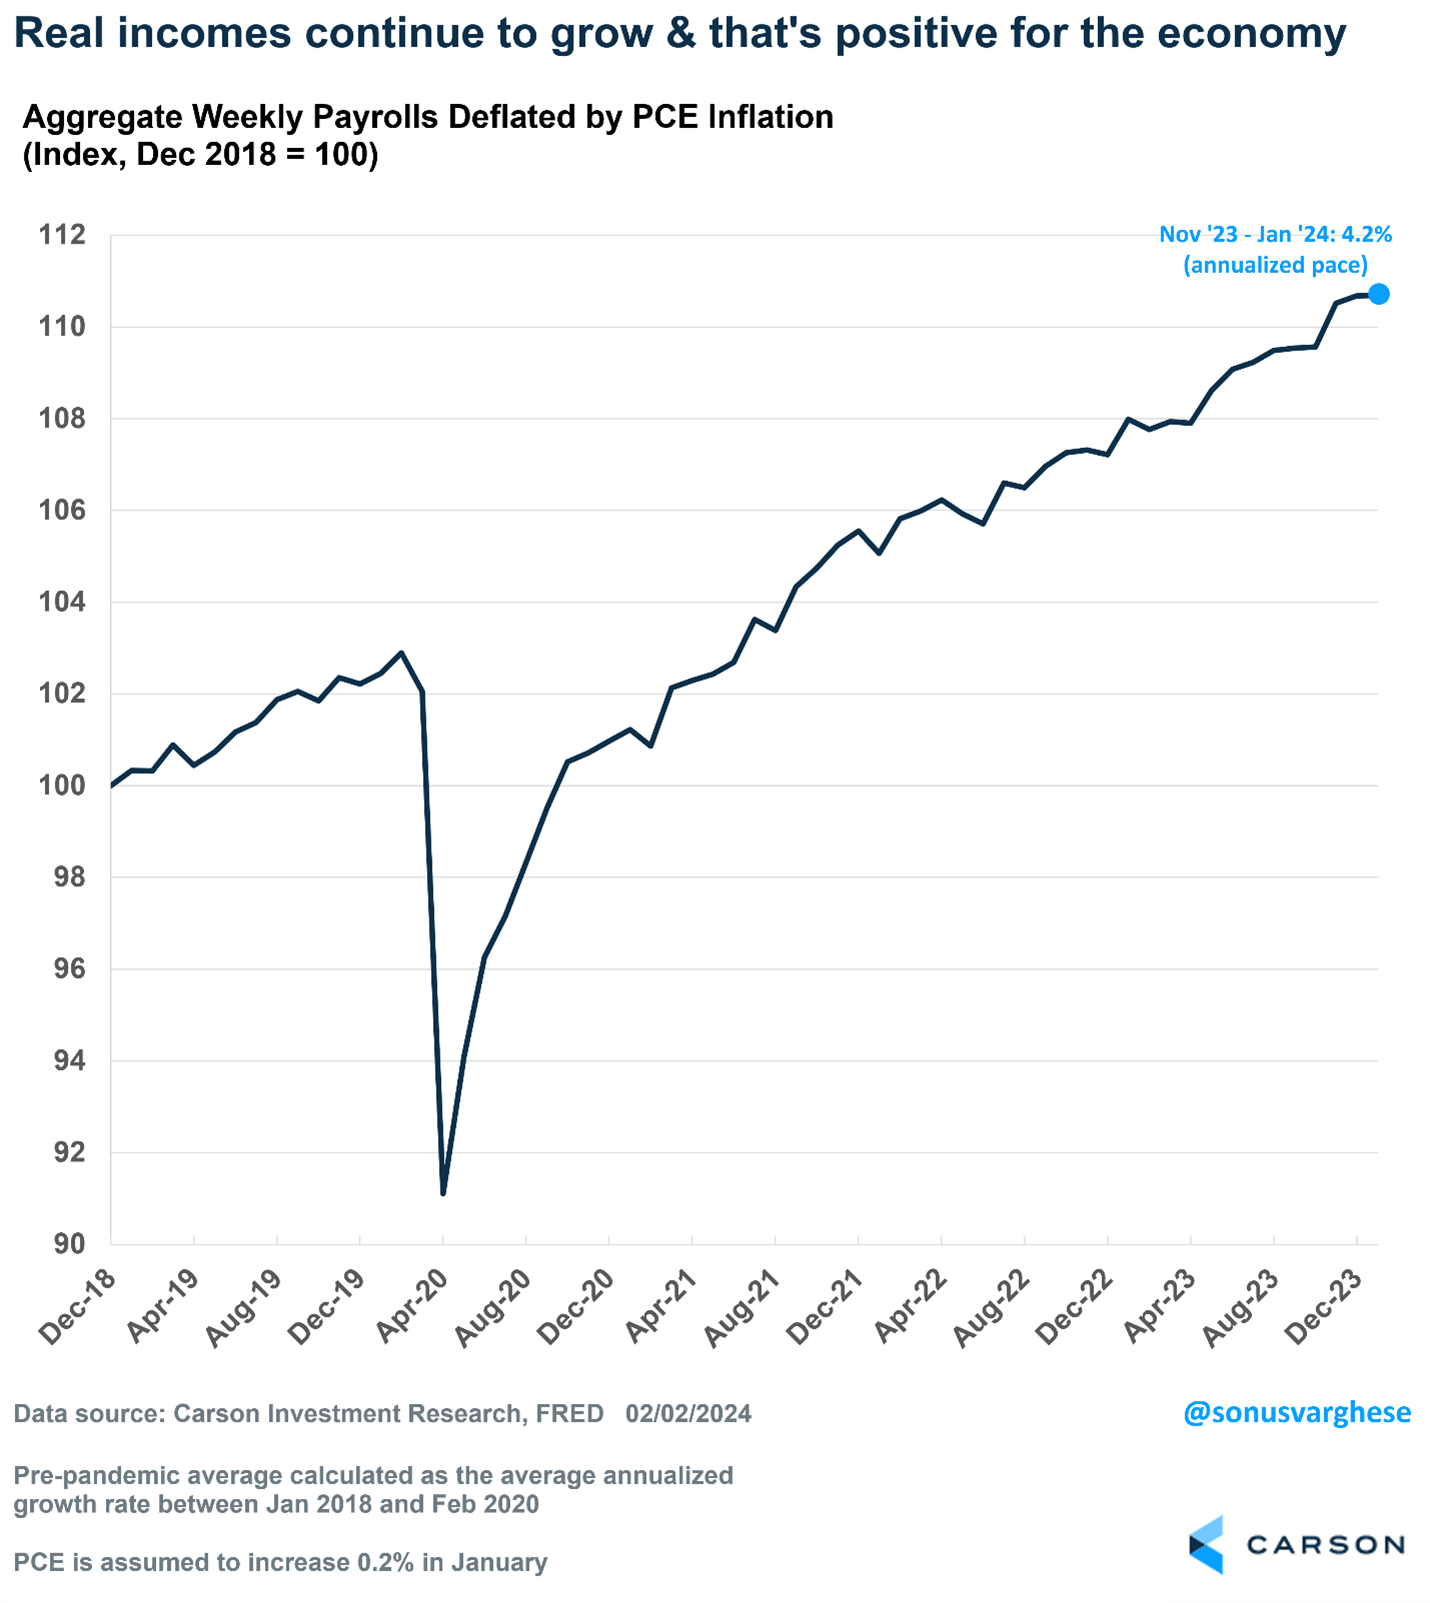
Incomes Continue to Increase
Jobs are plentiful and wages are still paying more than inflation, which is a nice combo for the consumer. If people were worried about their jobs or their pay was taking a cut, it isn’t unreasonable to think the consumer could be in trouble. Fortunately, we aren’t seeing that currently.
In fact, incomes adjusted for inflation continue to move to new highs. We actually noted this a year ago as a reason not to expect a recession in ’23 and not much has changed.
Oh No, Credit Card Debt Is HIGH!
We hear this one all the time. Credit card debt is at an all-time high, over $1 trillion. Yes, this is a huge number, but again, you need to look at this number compared to other factors.
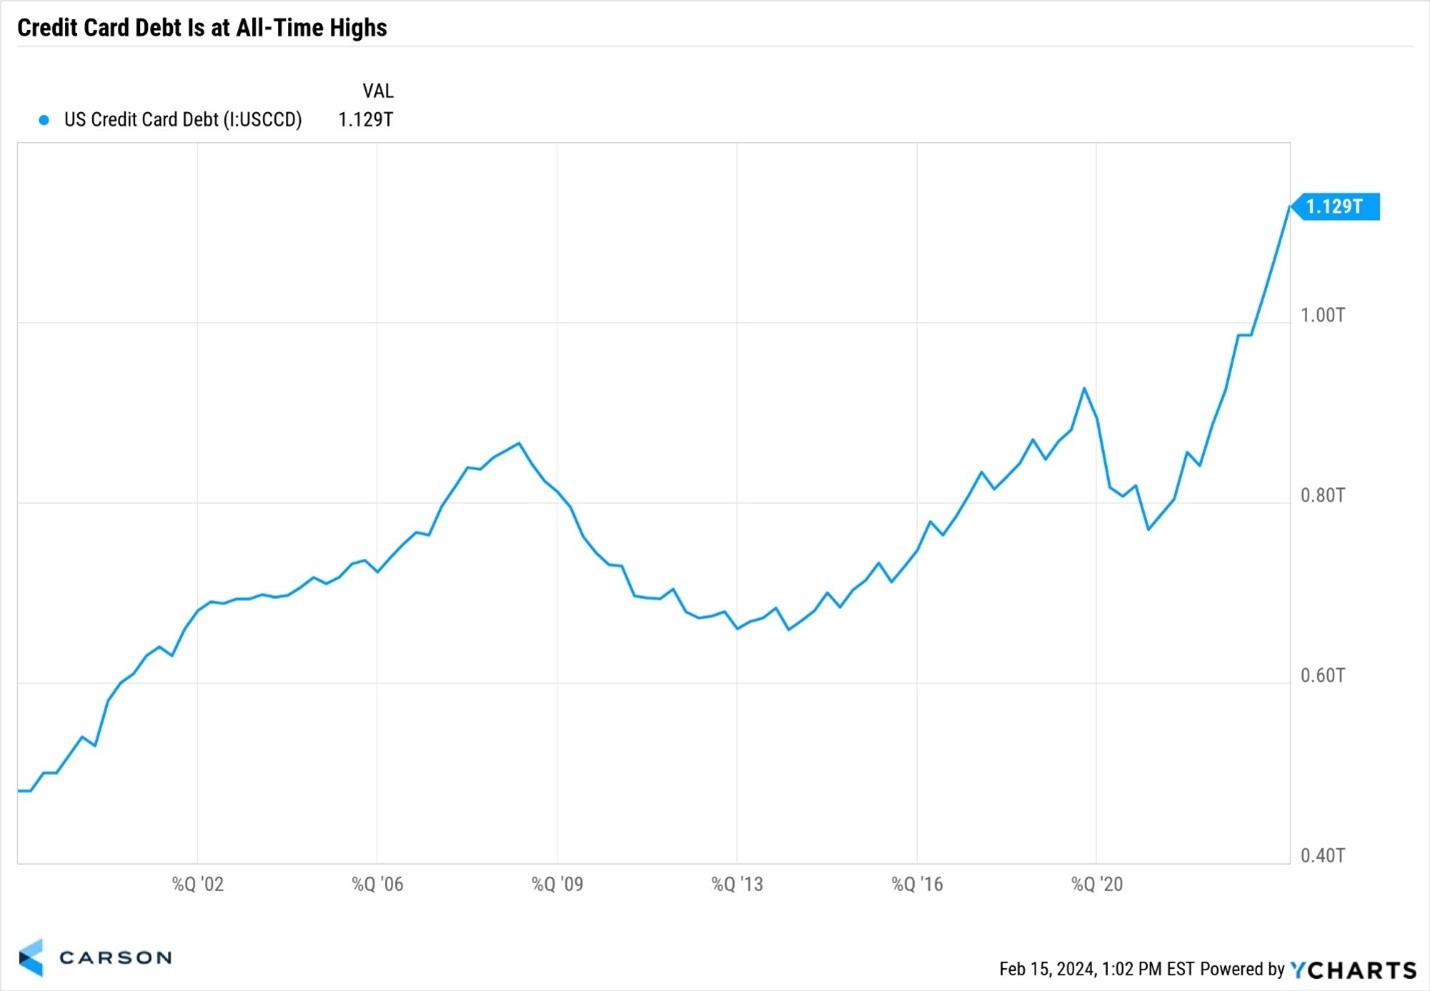
$1.13 trillion is a lot of credit card debt. But remember from above there is $17.5 trillion in total household debt (and we already put that in context), so credit card debt is only about 6% of overall debt, with mortgages making up most of it at more than $13 trillion.
Let’s think about this another way. People are worth a lot more over the past few decades. In fact, since 2000, net wealth is up more than 250% compared with credit card debt, which is up only 125%. Again, if you are worth more, you might have more debt.
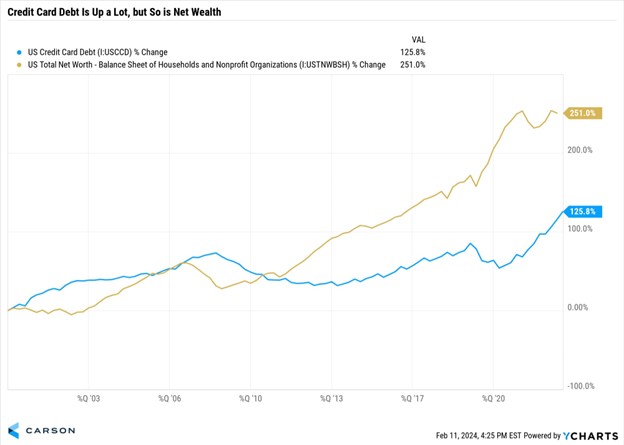
Now back to disposable income. If you have more income coming in, you might have more debt. I know. I have three kids and one just got a car. I have more debt thanks to that auto loan, but fortunately over the years my disposable income has increased to help offset that new monthly payment and big jump in insurance!
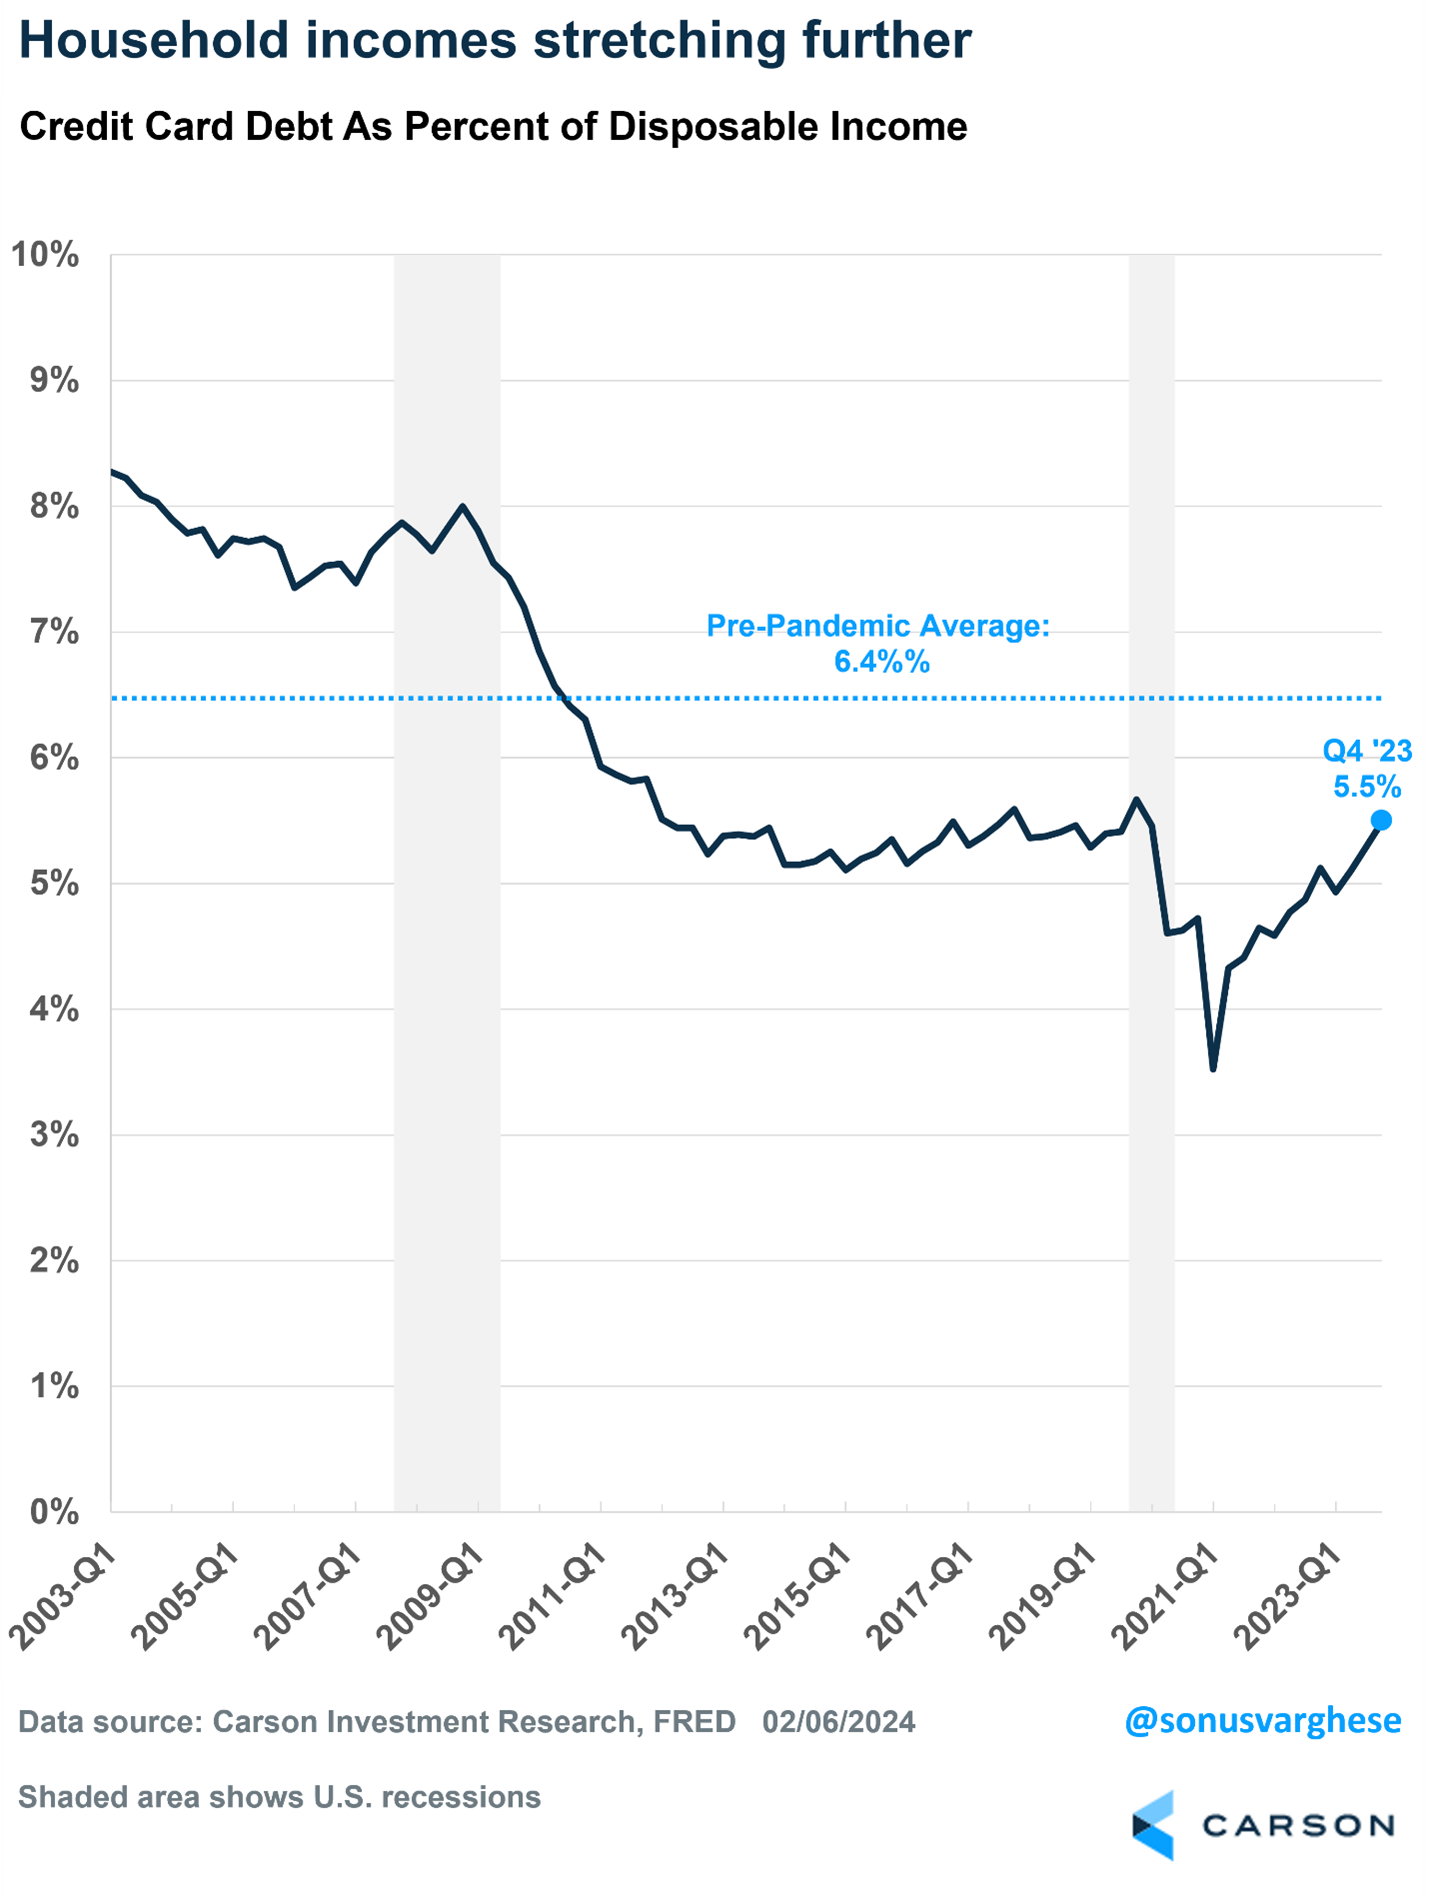
Looking at credit card debt as a percent of disposable income shows we are simply back to pre-pandemic levels at around 5.5% versus 7-8% during the GFC.
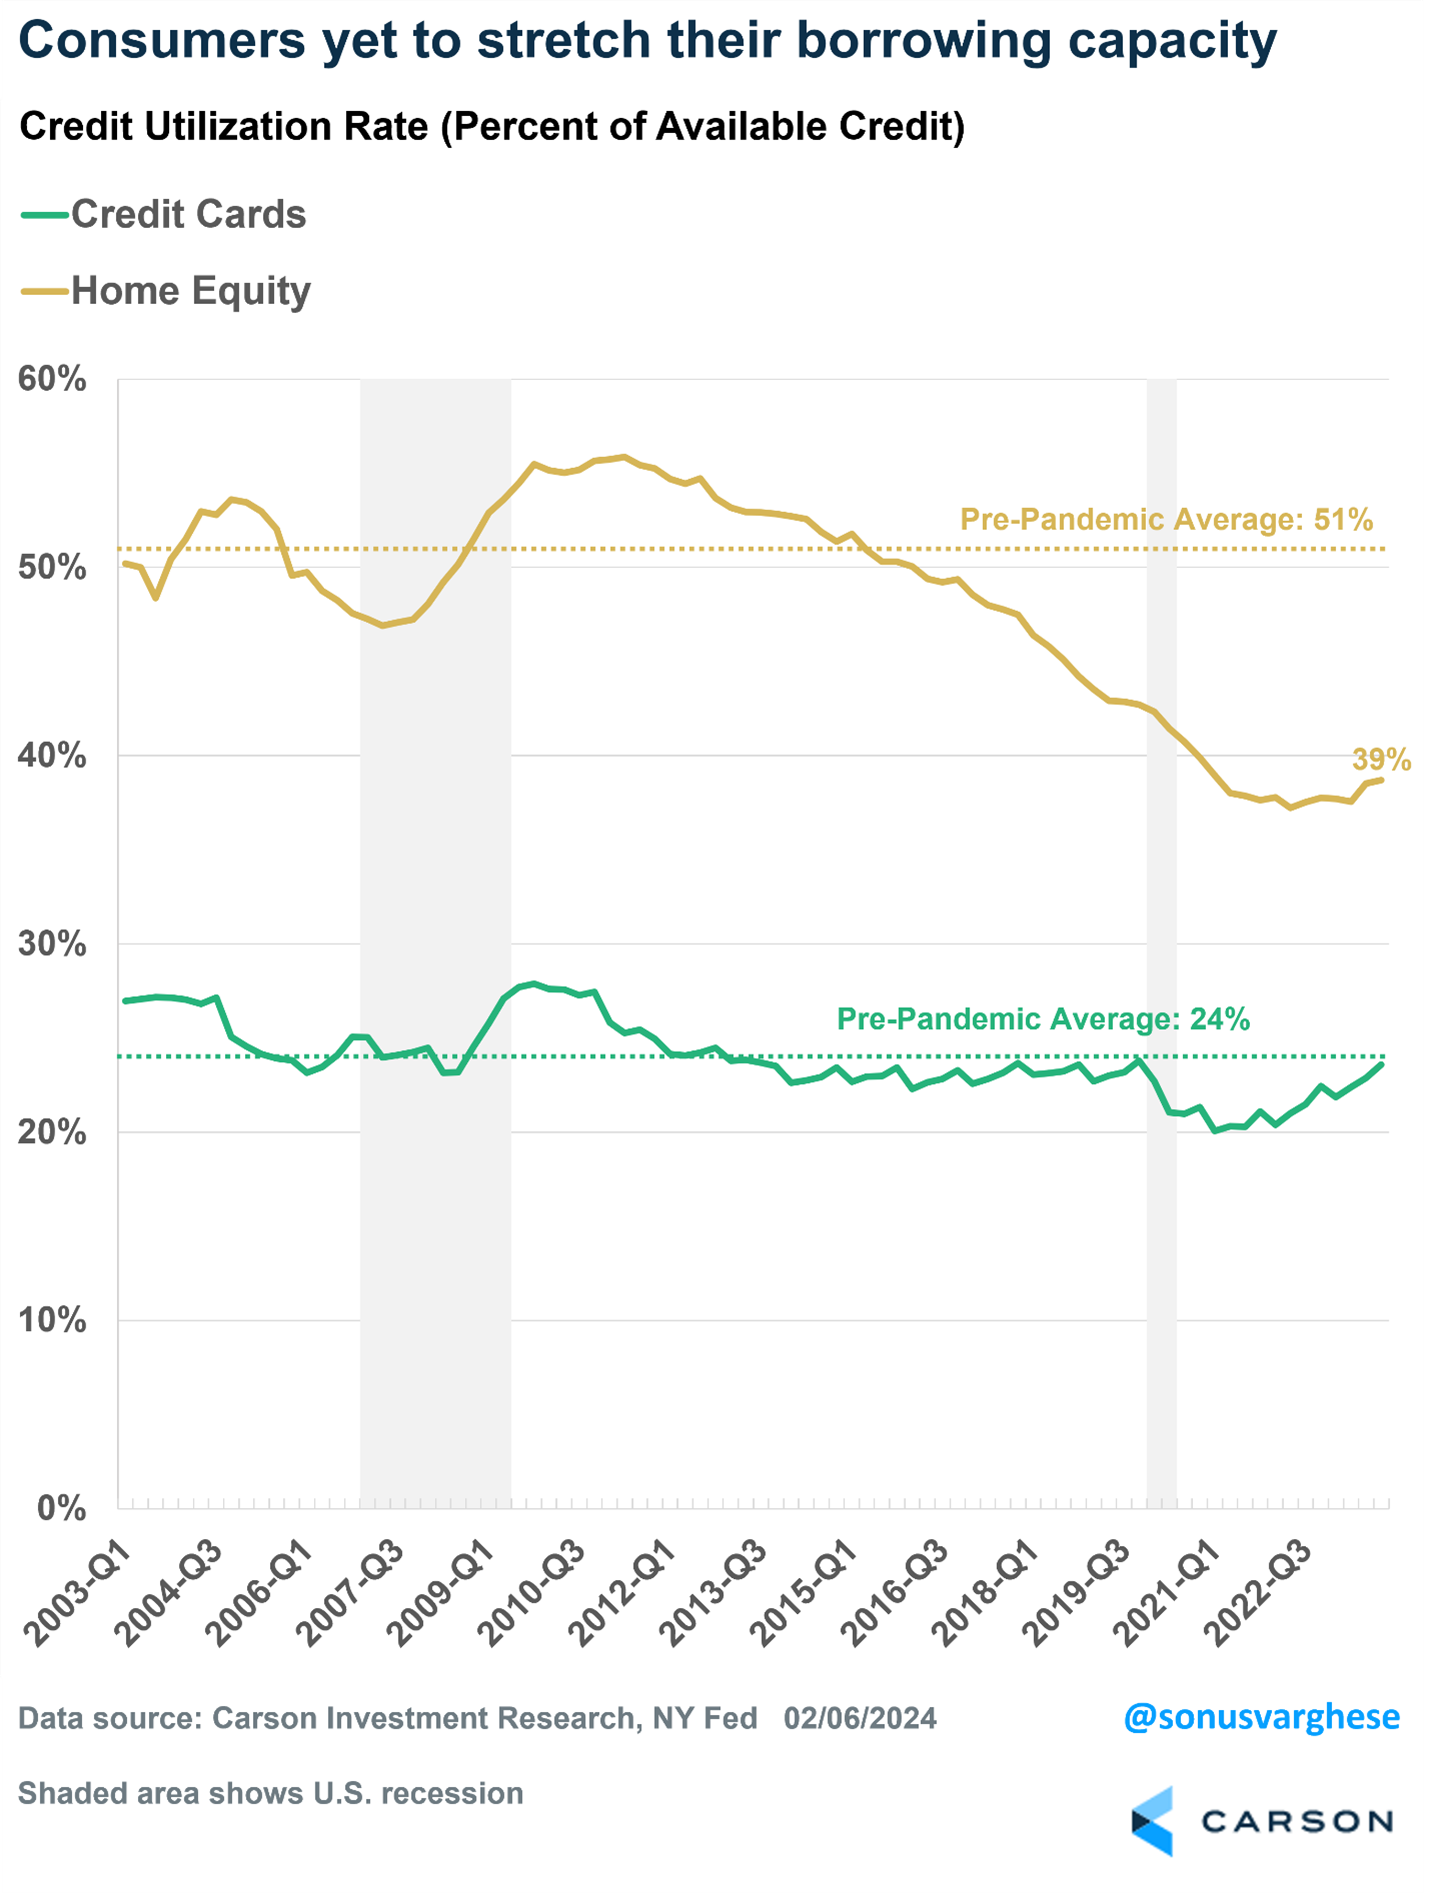
Another thing we hear is consumers are maxing out their credit cards to keep things going, but looking at the data shows that simply doesn’t appear to be true. Looking at how much consumers use on their credit cards relative to their overall line of credit is called credit utilization. Would you believe this is running at 24%, the pre-pandemic average? Home equity credit utilization, meanwhile, is nowhere near previous levels. This could be another big positive for consumers down the line as they tap into the massive gains from their homes. It simply doesn’t appear that consumers are maxing out their lines of credit.
Payments Are Late or Are They?
One of the better ways to know how much trouble the consumer is really in is if they have stopped paying back debt. The chart below indeed shows we’ve seen a jump in credit cards that are in serious delinquency (90 plus days with no payment), potentially the canary in the coal mine.
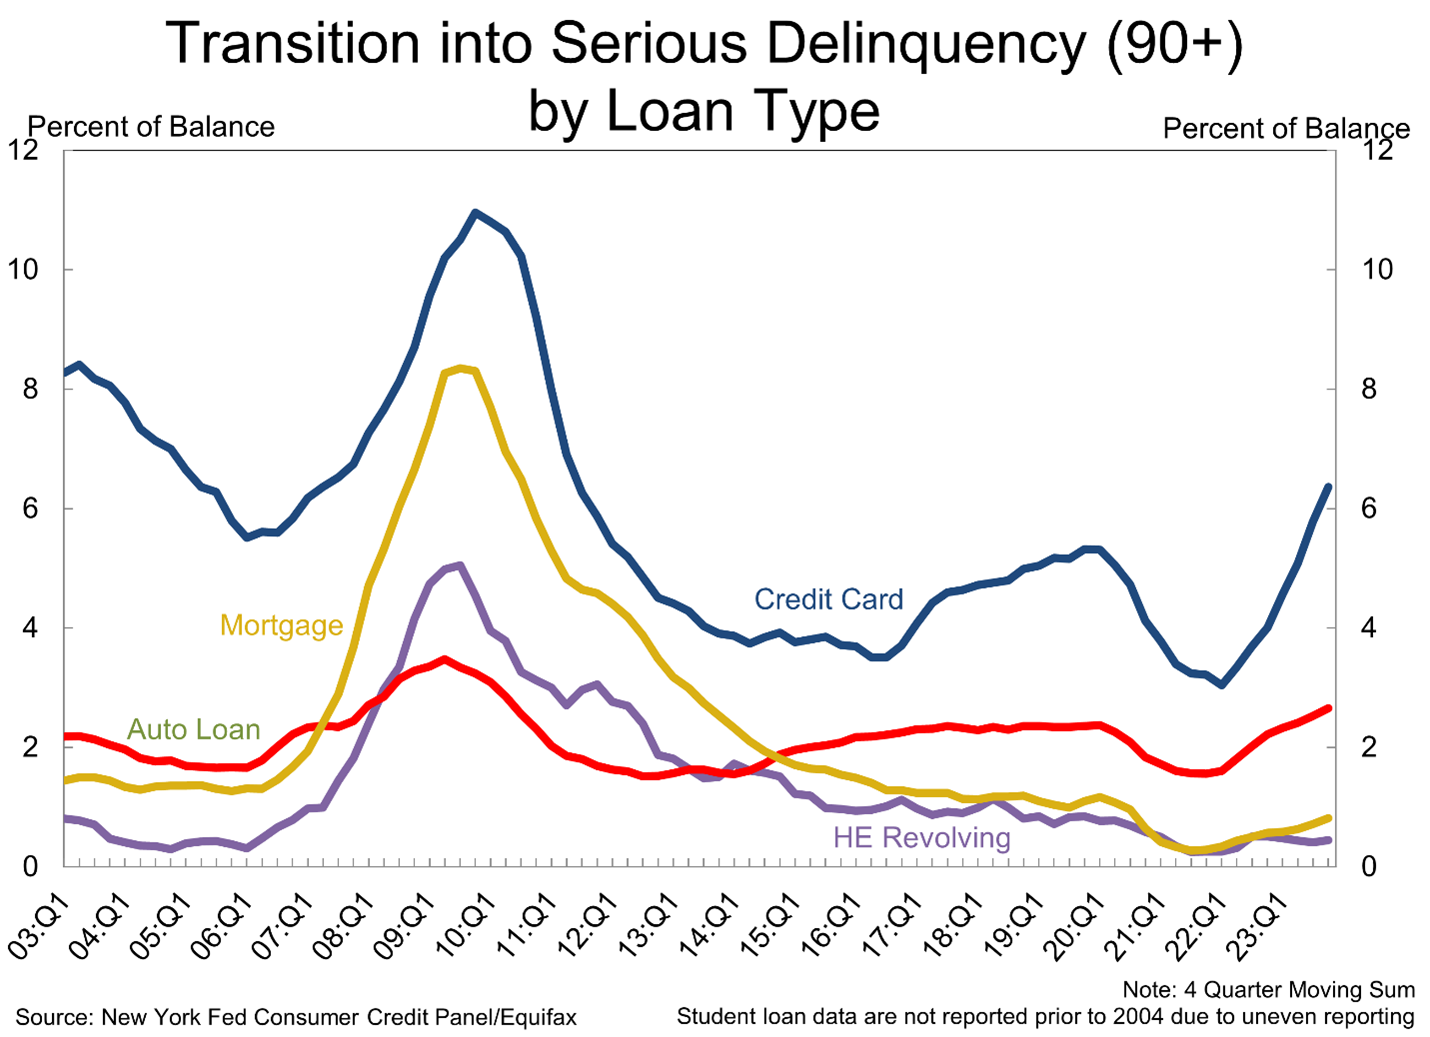
But as we mentioned already, credit cards are only about $1 trillion of the overall $17.5 trillion in debt. Not to mention we’ve seen data suggest it is younger people who are getting in trouble with credit cards, not the high-income earners who move the needle on overall consumption.
Looking at all the debt out there shows a much better backdrop, as 96.9% of all payments are on time, compared with 95.3% at the end of 2019 (a solid economy) and 93.3% at the end of 2007 (right before massive trouble). Also note that the most severely derogatory balances are only 1.5% of all total balances. This was running close to 2.8% pre-pandemic and 3% before the GFC.
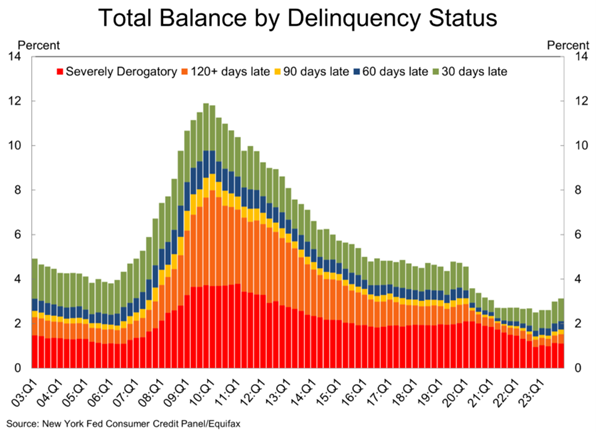
This data is updated by the New York Fed quarterly and we will continue to monitor it closely, but at this time we simply aren’t seeing any major cracks in the consumer.
Bankruptcies and Foreclosures Are Soaring
Well, no they aren’t is the quick answer. Here’s the truth.
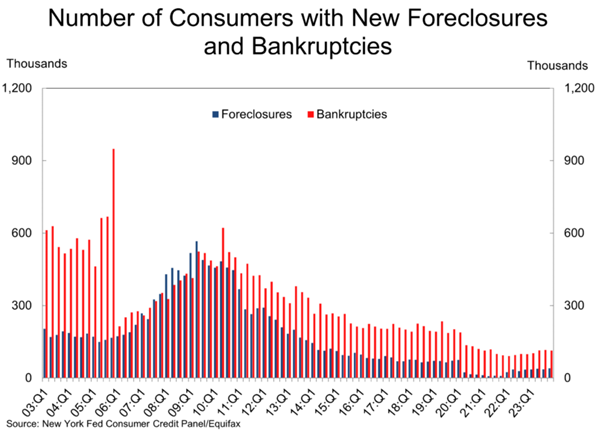
- The number of consumer foreclosures rose from 36,100 to 40,220 in Q4, which was well below the Q4 2019 level of 71,420.
- The number of consumer bankruptcies fell from 115,660 to 113,600 in Q4. It was running at 201,820 in Q4 2019.
Let’s say that again: The number of bankruptcies FELL last quarter. Yes, this can change and change quickly, but until we see this actually start to increase, it is hard for us to say the consumer is doomed. Again, this all tells us how strong household balance sheets really are relative to history (even a fairly solid period like 2019).
I’d like to thank Sonu for putting together many of these charts. In fact, for our latest thoughts on the market and the new Bitcoin ETFs, please listen to or watch our latest Facts vs Feelings podcast below as Sonu and I were joined by Matt Hougan, CIO at Bitwise.
For more of Ryan’s thoughts click here.
02119494-0224-A
