We finally got more timely data on the labor market and since it’s been a while, I thought I’d put together 11 charts showing what’s happening in the labor market. The big picture is that the labor market continues to cool, with weak hiring but also relatively low firings.
Job Growth Cools, A Lot
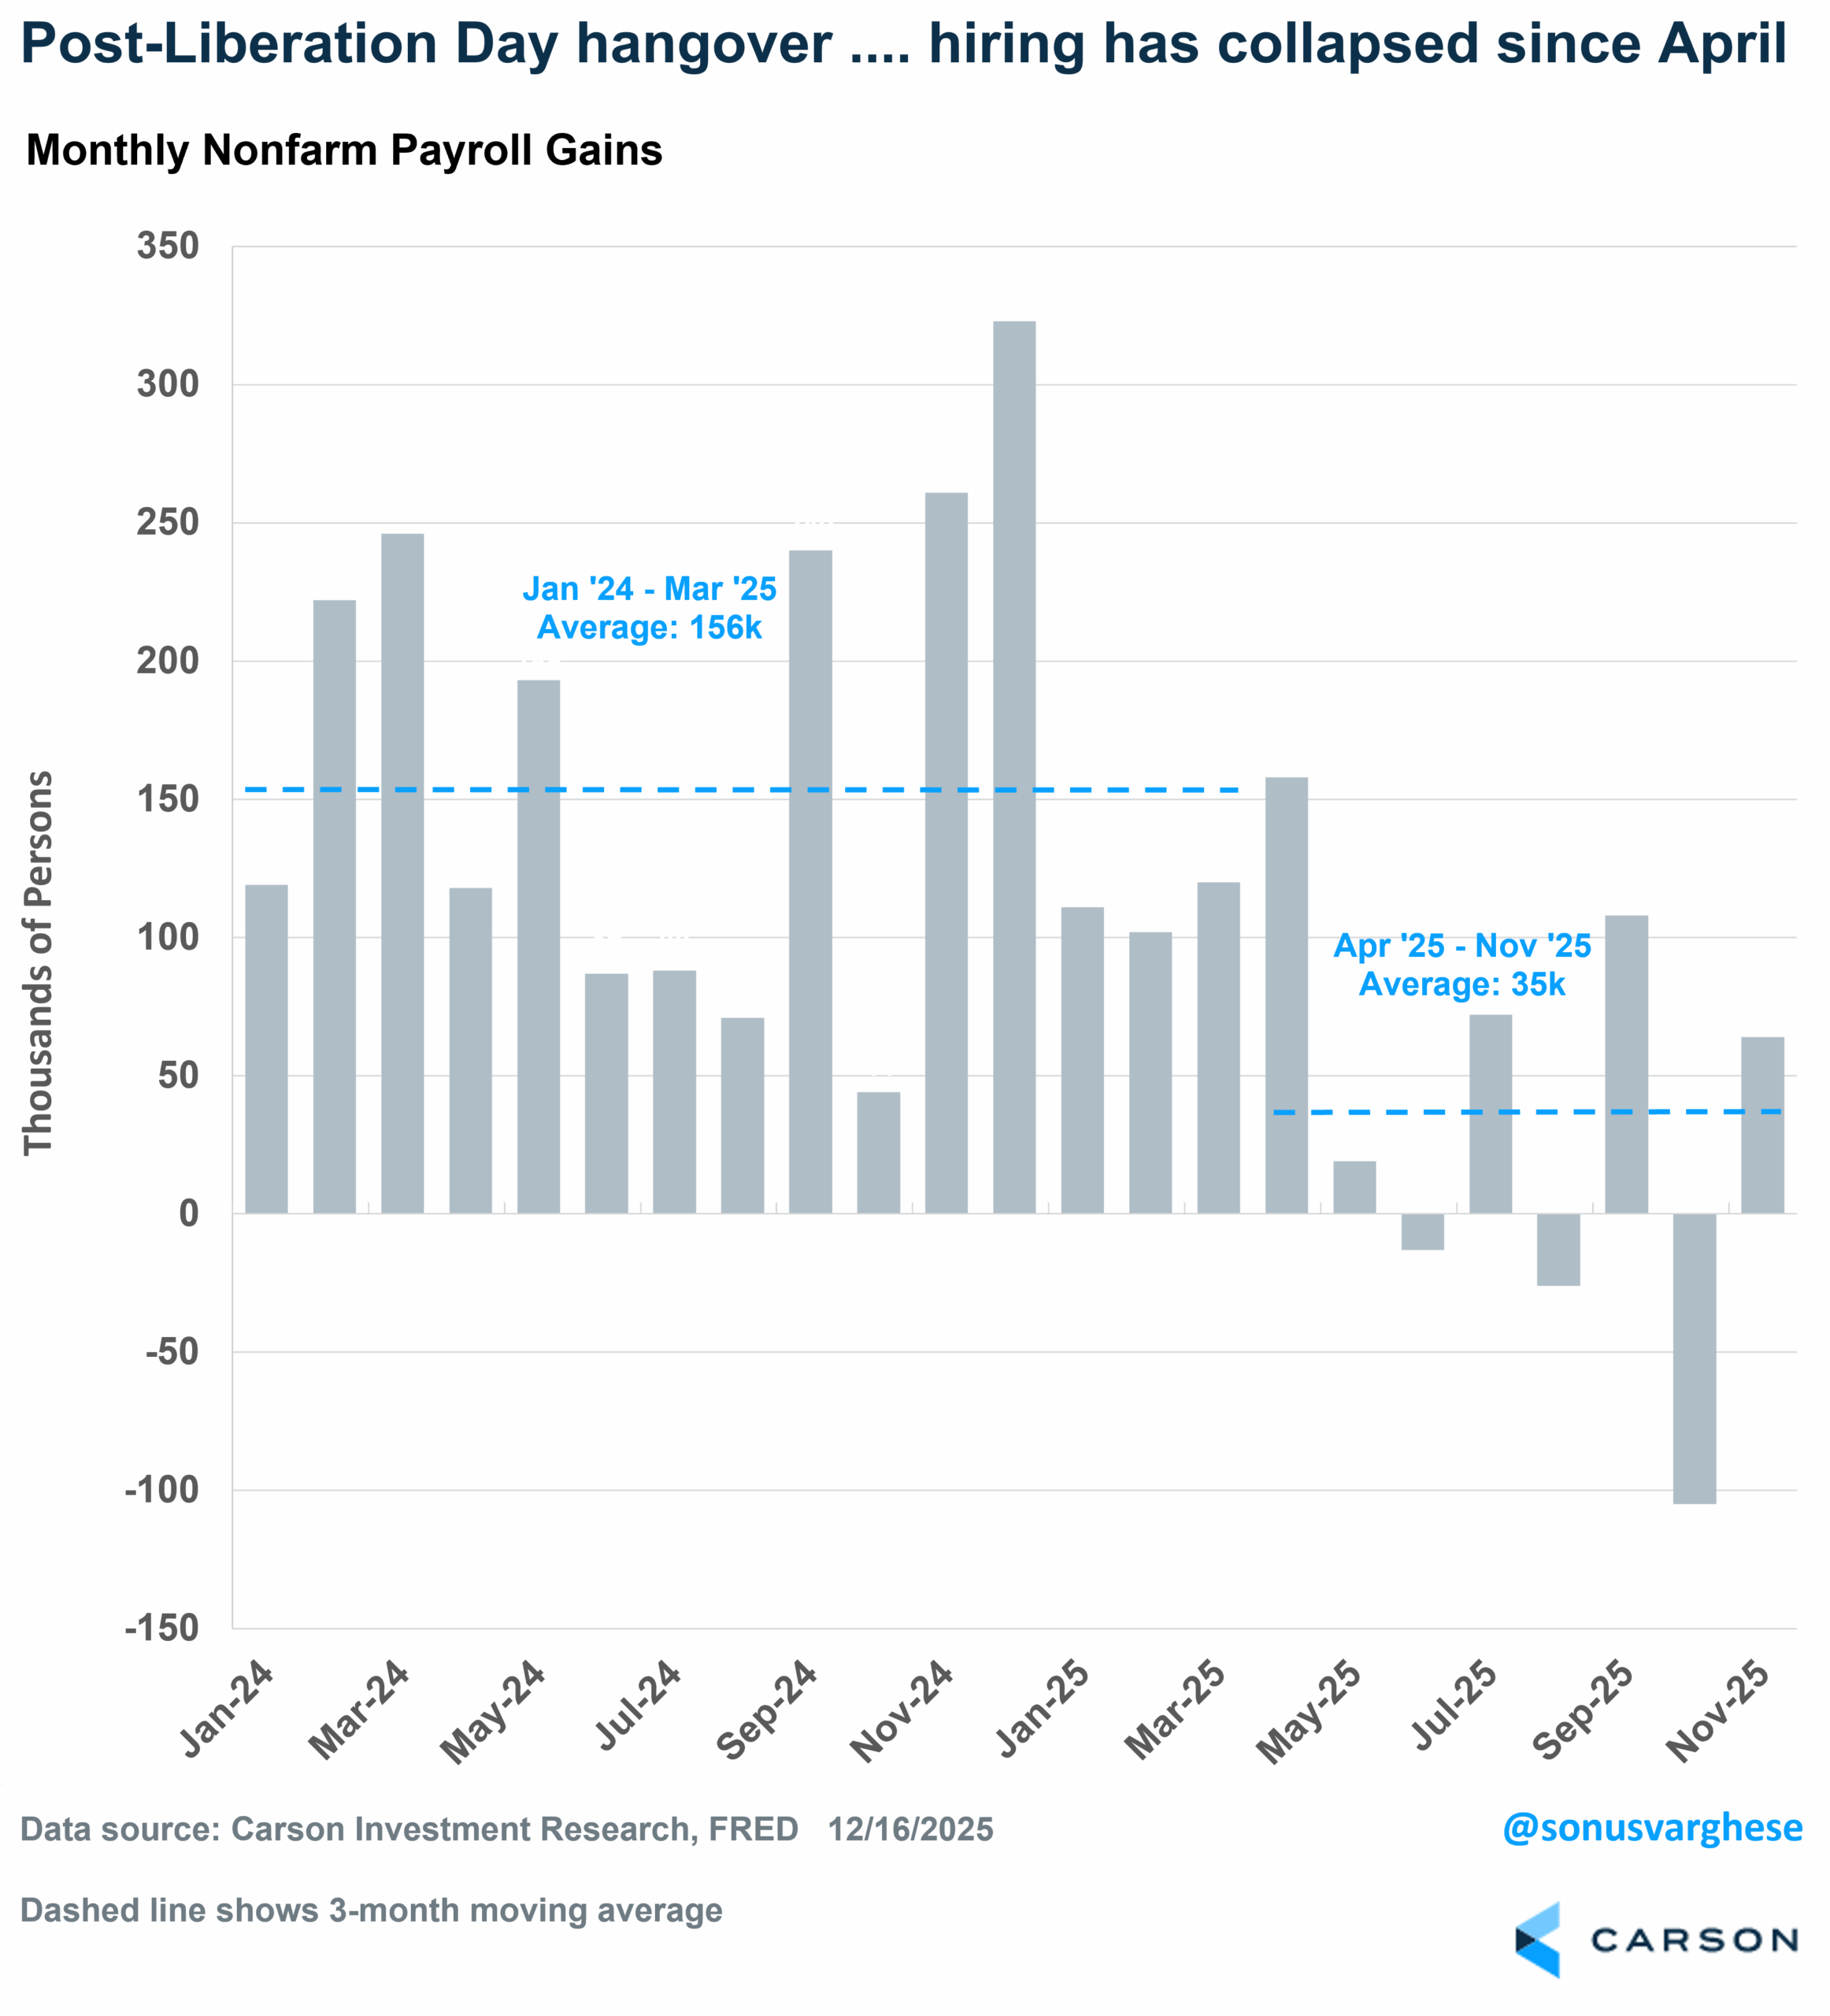
Let’s start with the big one, which is payroll growth. It’s pretty much collapsed since April, after Liberation Day. Over the 15 months from January 2024 through March 2025, the economy created an average of 156,000 jobs a month, since then (April–November) it’s averaged just 35,000 per month. Over the past three months, the average is just 22,000. One asterisk to job growth in the twelve months through March 2024 is that it’s going to be revised down significantly, and so the average will fall below 100,000/month. But in any case, payroll growth has slowed to a crawl over the past few months, including a few months with negative readings (which is never good). This is where the tariff chaos has really had an impact, with uncertainty leading to much lower hiring — and the break (pre- vs post-Liberation Day) is clear in the data.
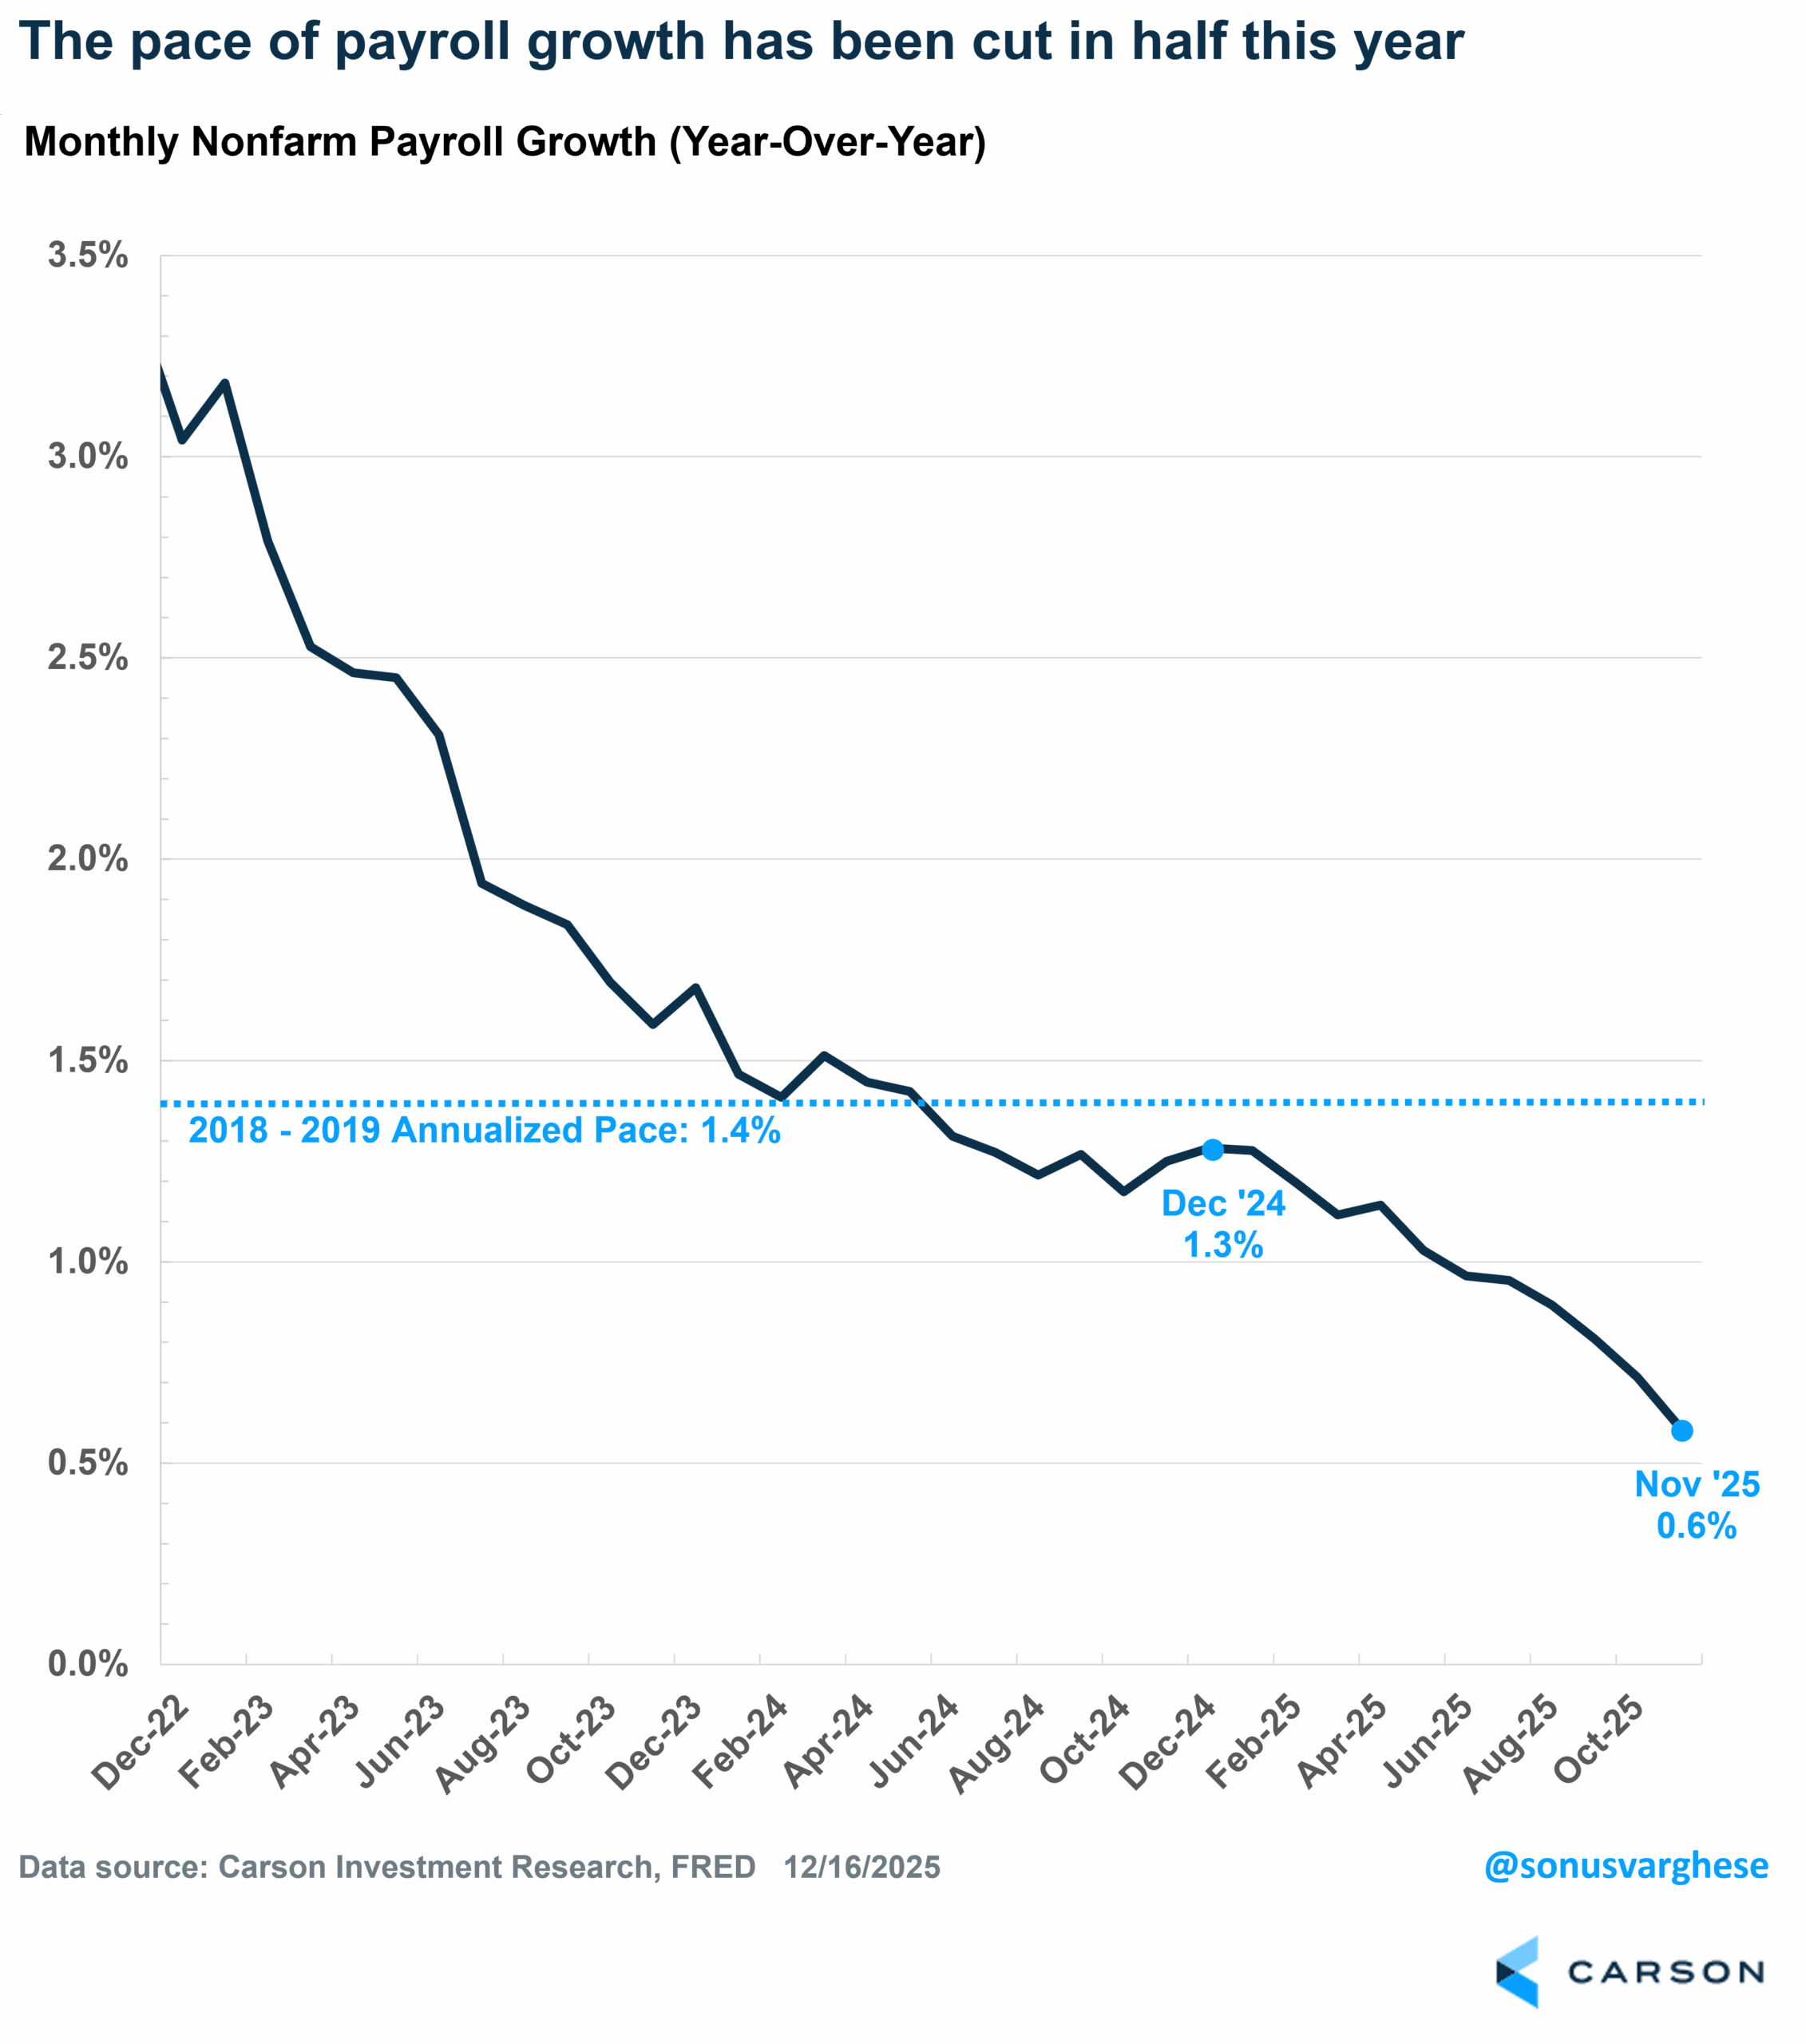
Another way to see the slowdown: payrolls have grown 0.6% over the past year, a marked slowdown from the 2024 pace of 1.3%. By comparison, during the relatively strong pre-pandemic labor market from 2018–2019, payrolls grew at an annual pace of 1.4%.
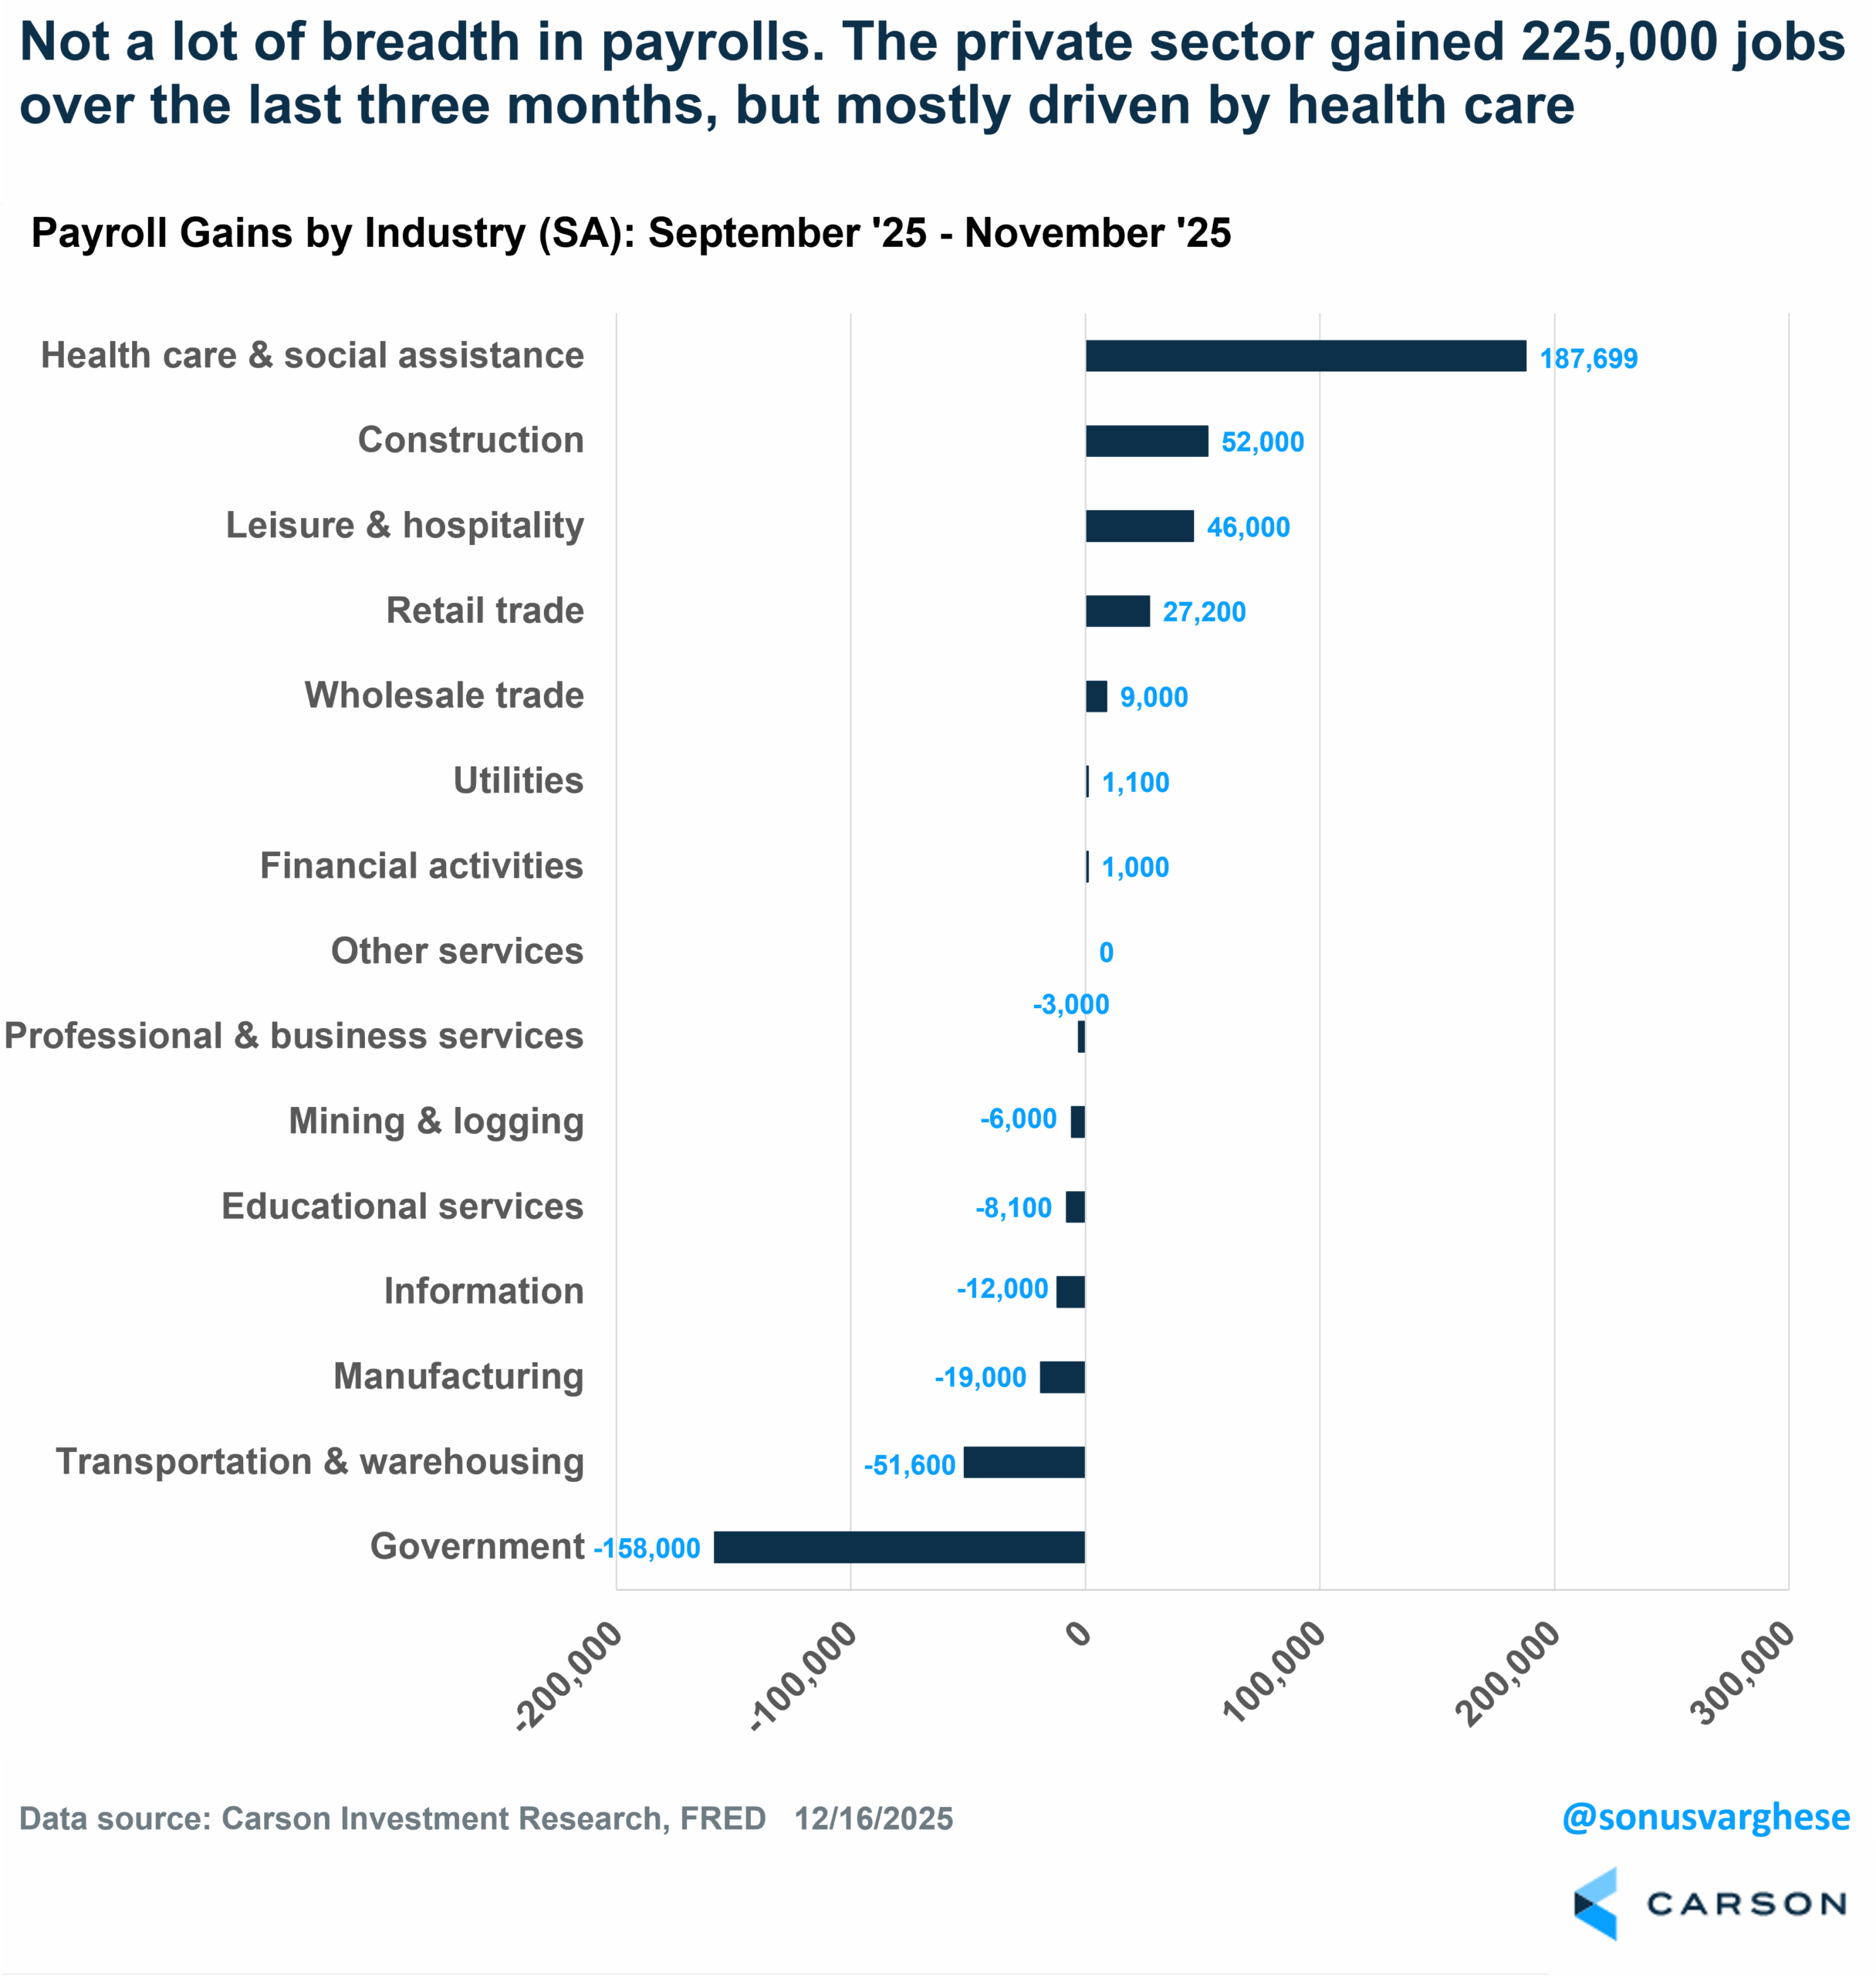
One reason behind the pullback in job growth over the past three months is that government payrolls fell 105,000 in October. This is a one-off and due to the federal government’s deferred resignation program. Excluding government jobs, private payrolls have grown 225,000 over the past three months, or an average of 75,000 per month. That’s good news, but most of that has come from the non-cyclical health care sector (+188,000 total). Construction jobs also rose by 52,000, though it was driven by the non-residential side (like data centers) rather than residential.
Unemployment Rises as Hiring Weakens
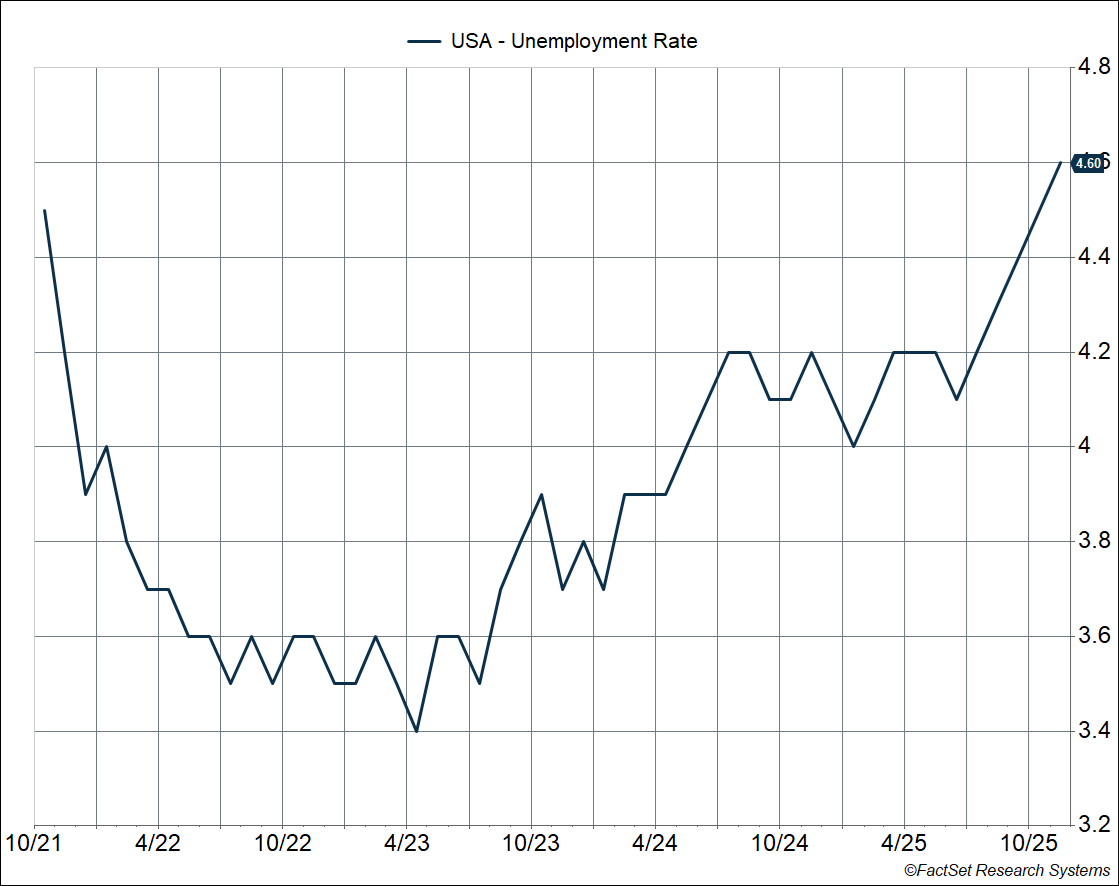
The slowdown in job growth is not just a story of weak demand for labor. There’s a supply-side story here too, especially with the big collapse in immigration. So the “breakeven” number of jobs needed to keep up with population growth has likely fallen to around 50,000 or so, if not even lower. The problem is the economy is not even creating enough jobs to maintain breakeven, and so the unemployment rate is rising.
- It was 4.01% in January 2025.
- It was 4.12% in June.
- It hit 4.56% in November, the highest in over four years and also higher than the Fed’s projection for 2025
That’s a 0.4%-point increase over the last five months. Historically, when the unemployment rate starts to move higher, it’s likely to continue to climb. This solidifies the Fed’s case for cutting rates by 0.75%-points over the last three months and increases the odds of another cut in January (especially if the unemployment rate stays at this level).
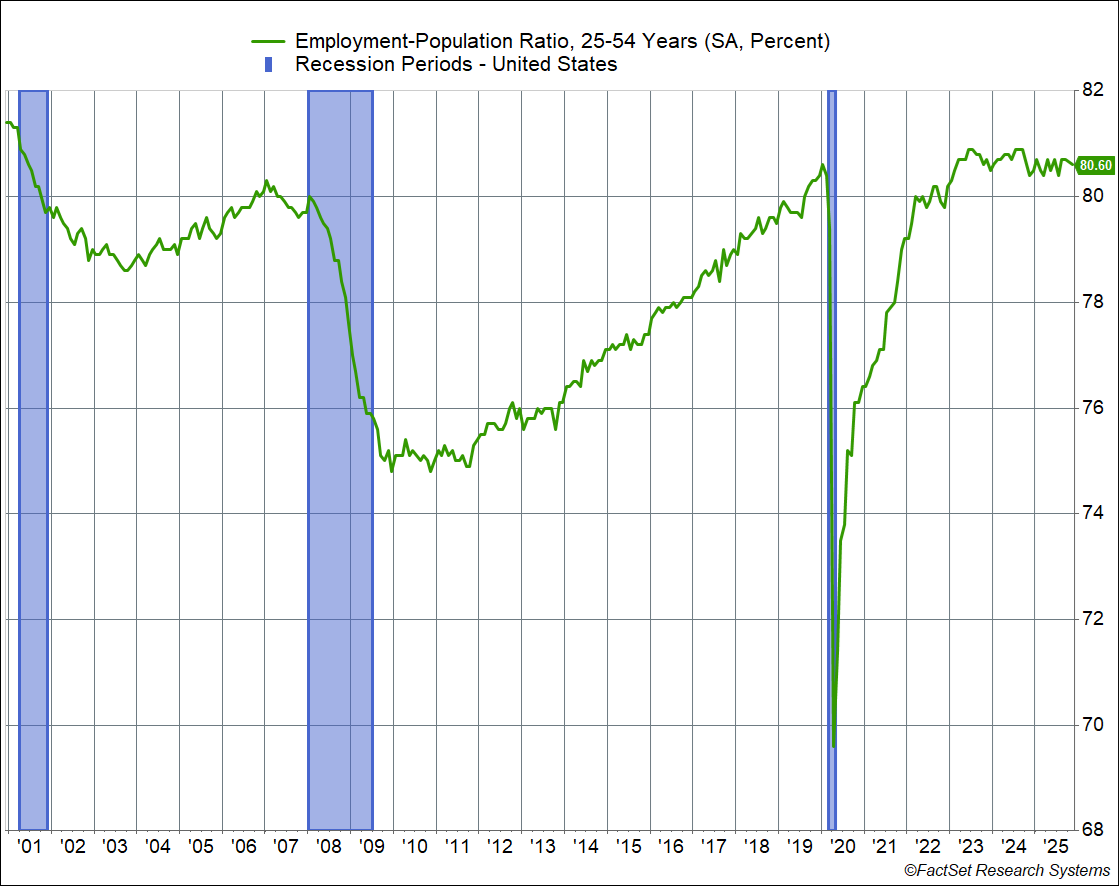
One positive is that the prime-age (25-54) employment-population ratio is at 80.6%—only slightly behind the peak we saw last year (80.9%) and matching the highest we saw in the 2000s and 2010s expansion. This metric overcomes some of the issues with defining who is unemployed (since it measures who’s employed instead) and demographics (an aging population). While prime-age employment helps smooth out these issues, in fact unemployment has risen for young people:
- 16-19 years: 16.3% versus 13.1% a year ago
- 20-24 years: 8.3% versus 7.8% a year ago
Stay on Top of Market Trends
The Carson Investment Research newsletter offers up-to-date market news, analysis and insights. Subscribe today!
"*" indicates required fields
A Low Hire, Low Fire Economy
Overall hiring has collapsed since last year, with the hire rate (hires as a percent of the labor force) falling to 3.2%. That’s the lowest level since 2011 (outside of Covid). Another indication that hiring isn’t great is that workers aren’t quitting their jobs at a rate consistent with a strong labor market. If the labor market was strong, like in 2021–2023, more workers would be quitting their jobs for better ones. However, the quit rate (voluntary quits as a percent of the workforce) fell to just 1.8% in October, telling you that workers aren’t leaving their jobs, likely because it’s hard to find a new one.
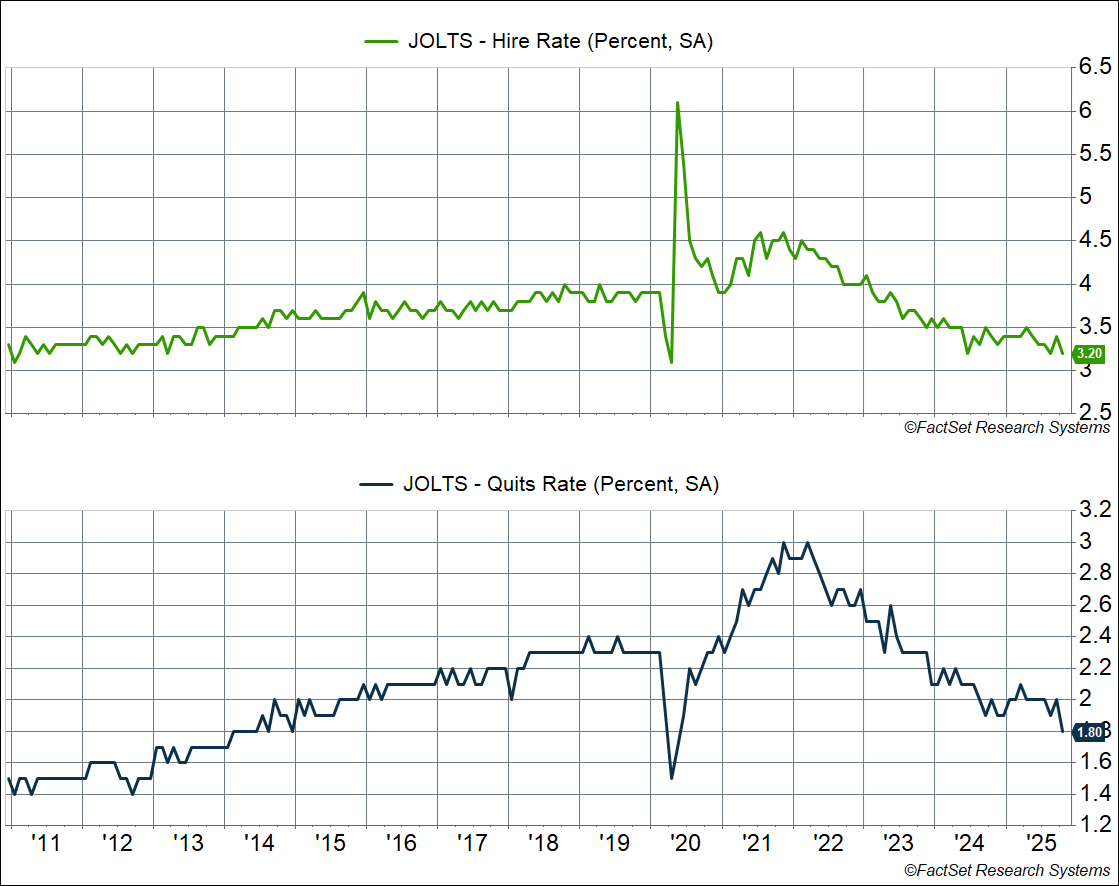
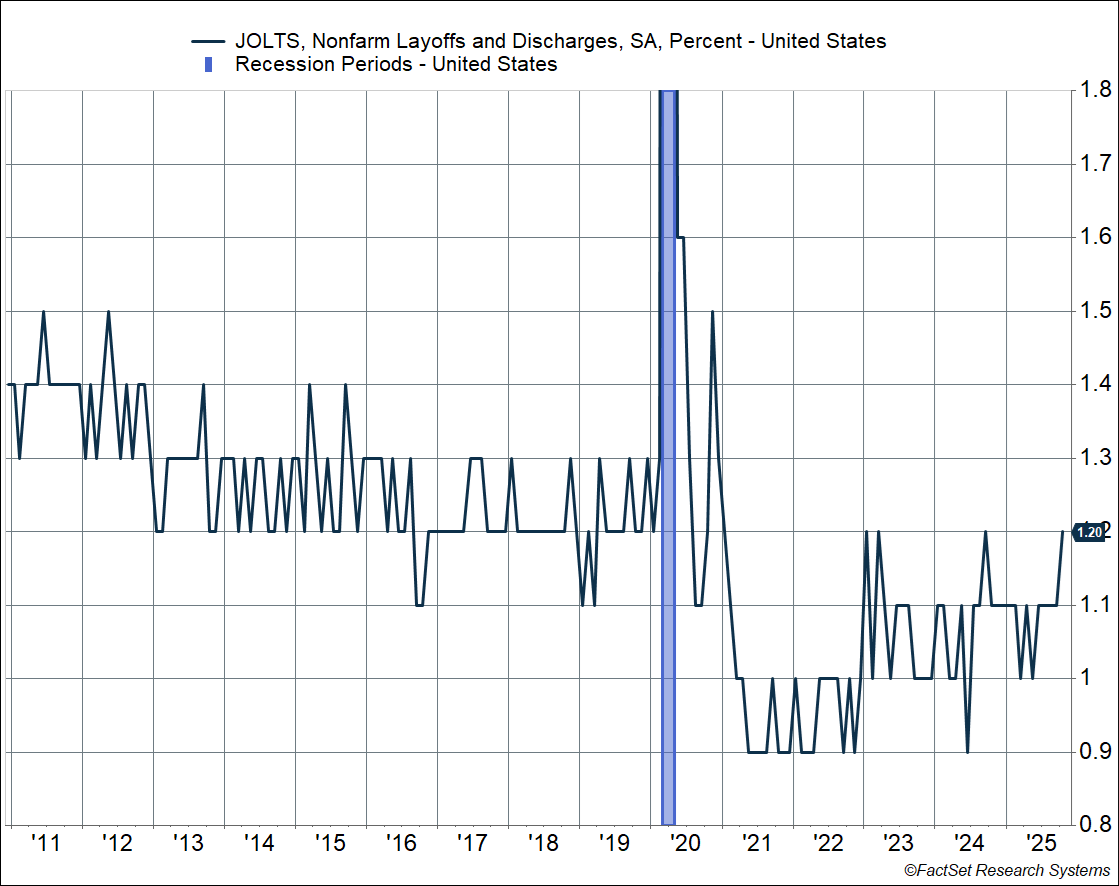
Note that the hire rate above measures “gross hiring,” whereas payroll growth measures net hiring, i.e. hiring net of separations, including quits and layoffs. With hiring running as low as it is, you’d expect the unemployment rate to be much higher. But it’s still close to historical lows because layoffs are also running low. The layoff rate ticked up to 1.2% in October, but that’s similar to the 1.2–1.3% range we saw amid the strong labor market of 2018–2019.
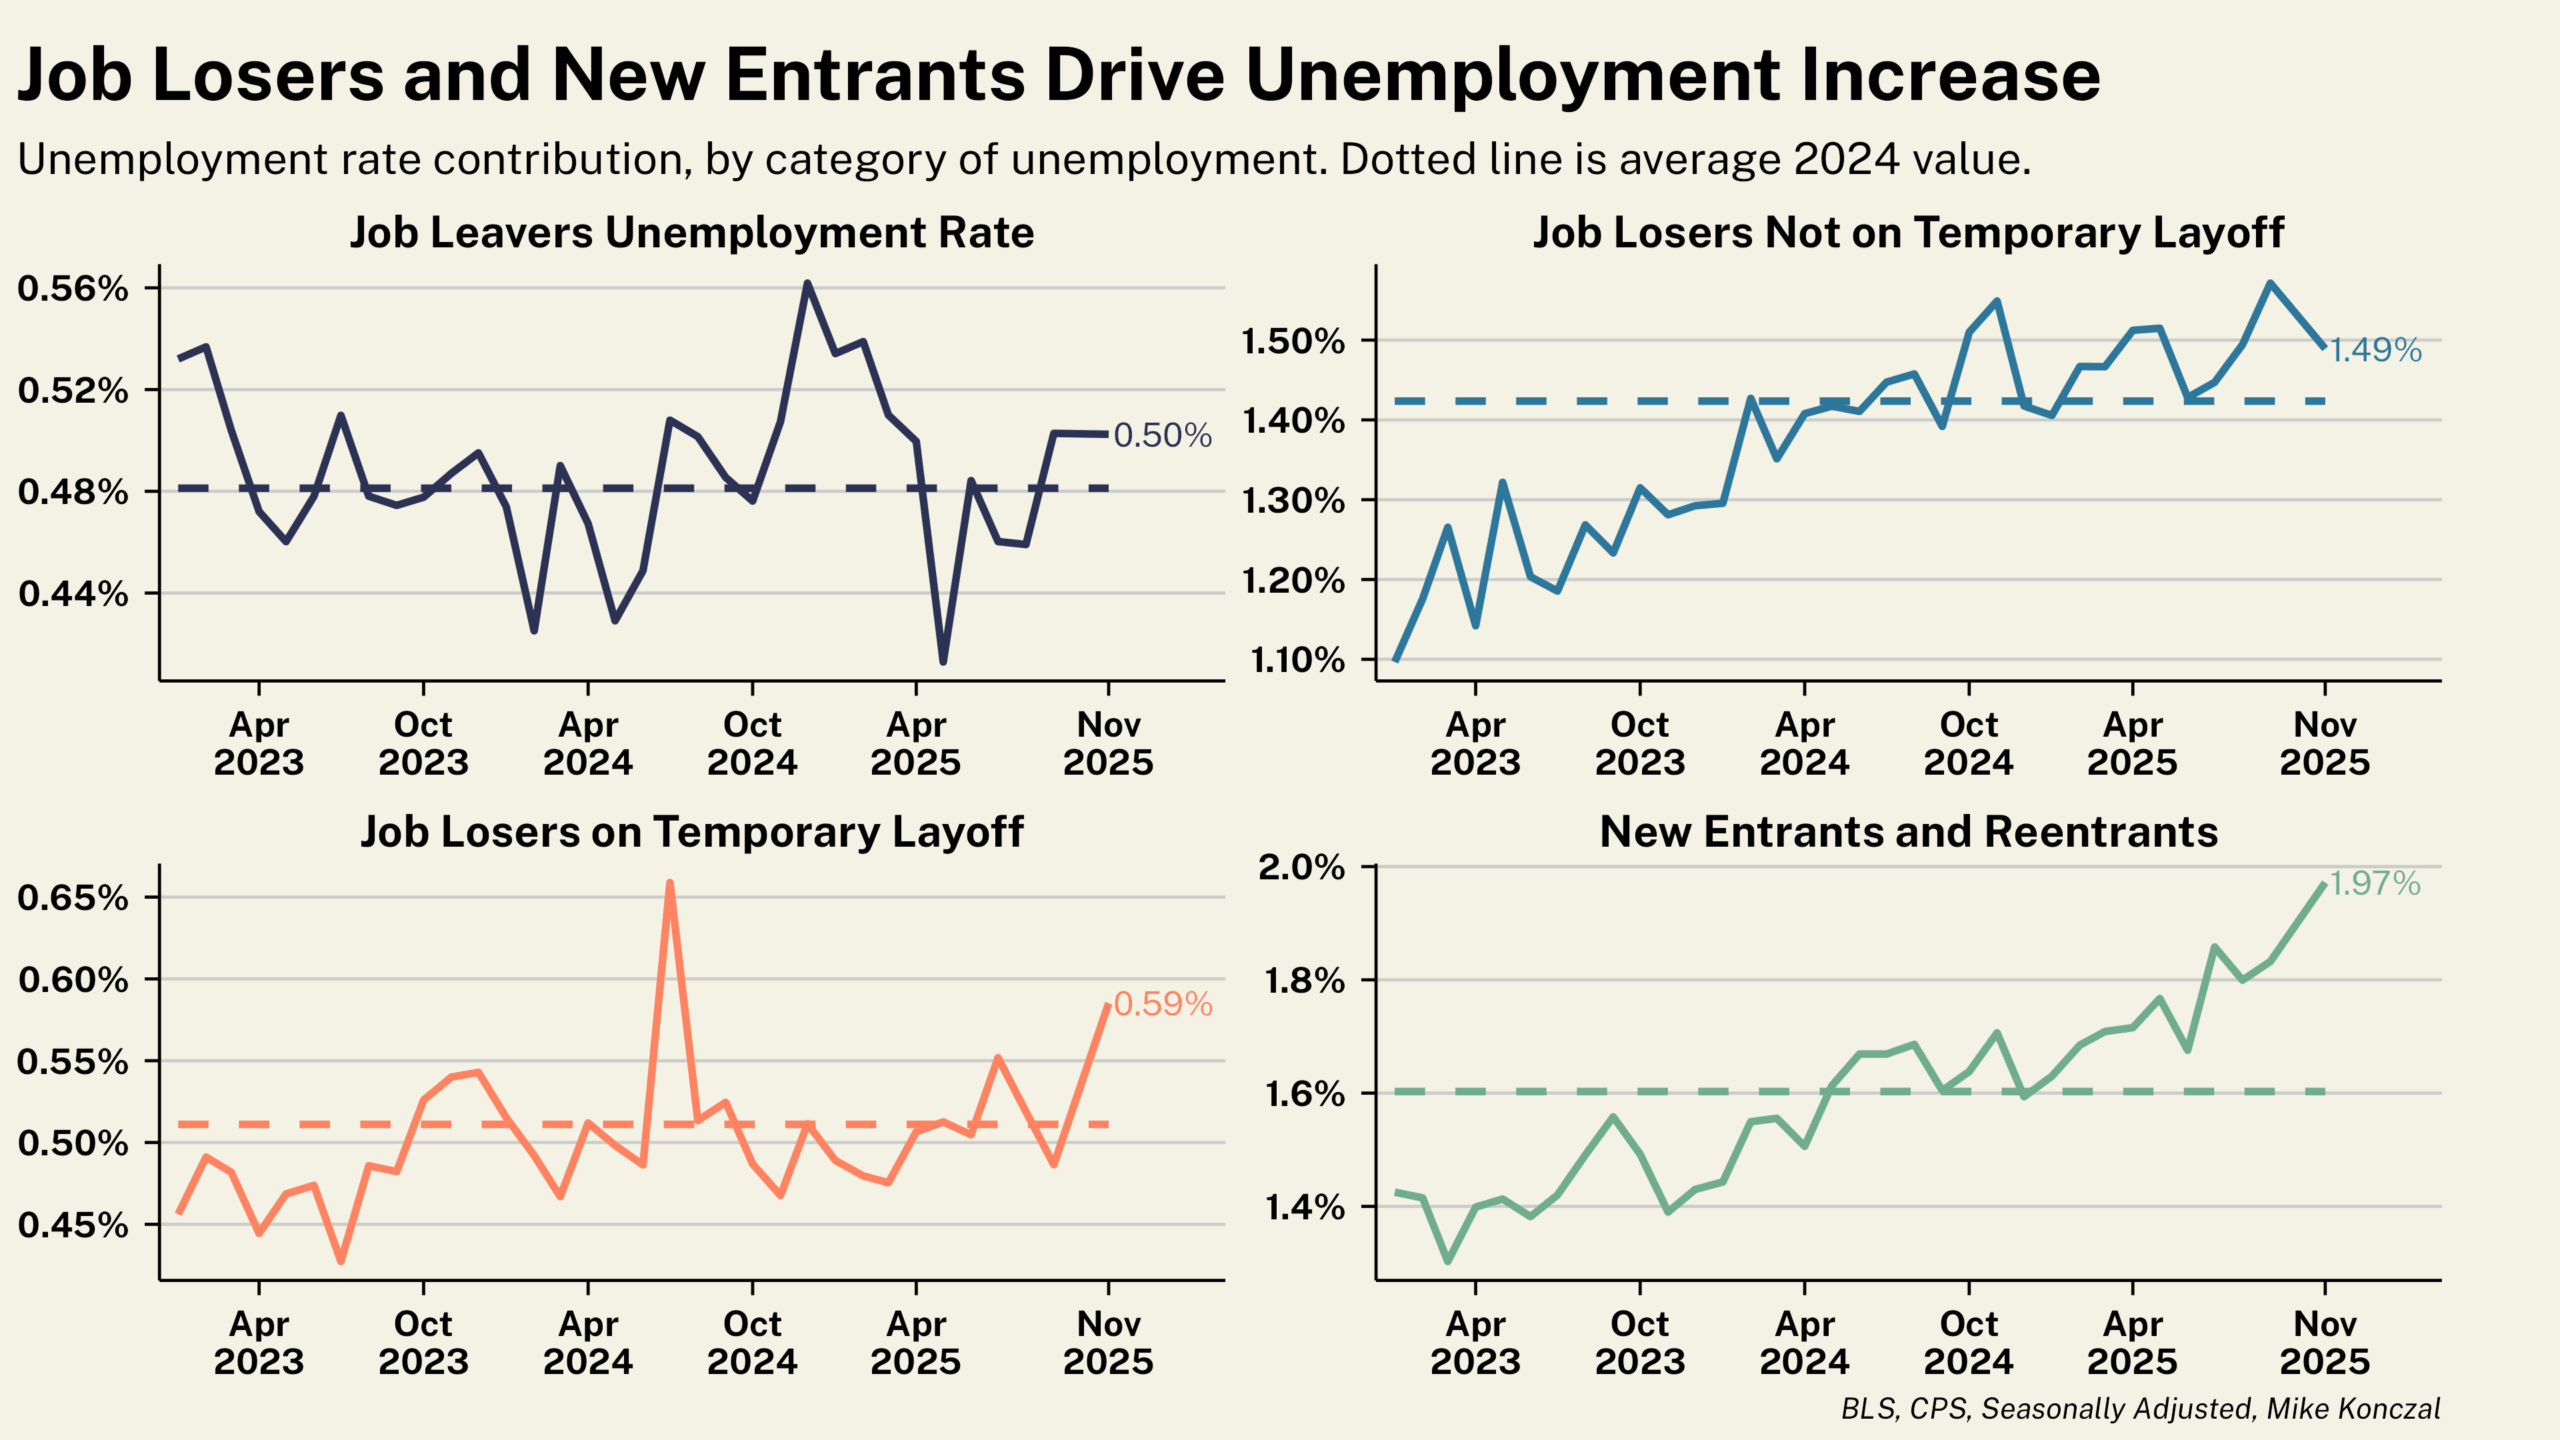
Another way to visualize the low hiring/low firing economy is to look at the unemployment rate broken down by type (chart courtesy of Mike Konczal, former head of the National Economic Council). People aren’t voluntarily quitting their jobs or getting fired to a large degree, which tends to push down the unemployment rate. However, new entrants into the workforce (like young people) are having a harder time finding a job and that’s pushed the unemployment rate higher. Note that job losers on temporary layoff spiked in November, but that’s likely due to federal government workers who lost jobs.
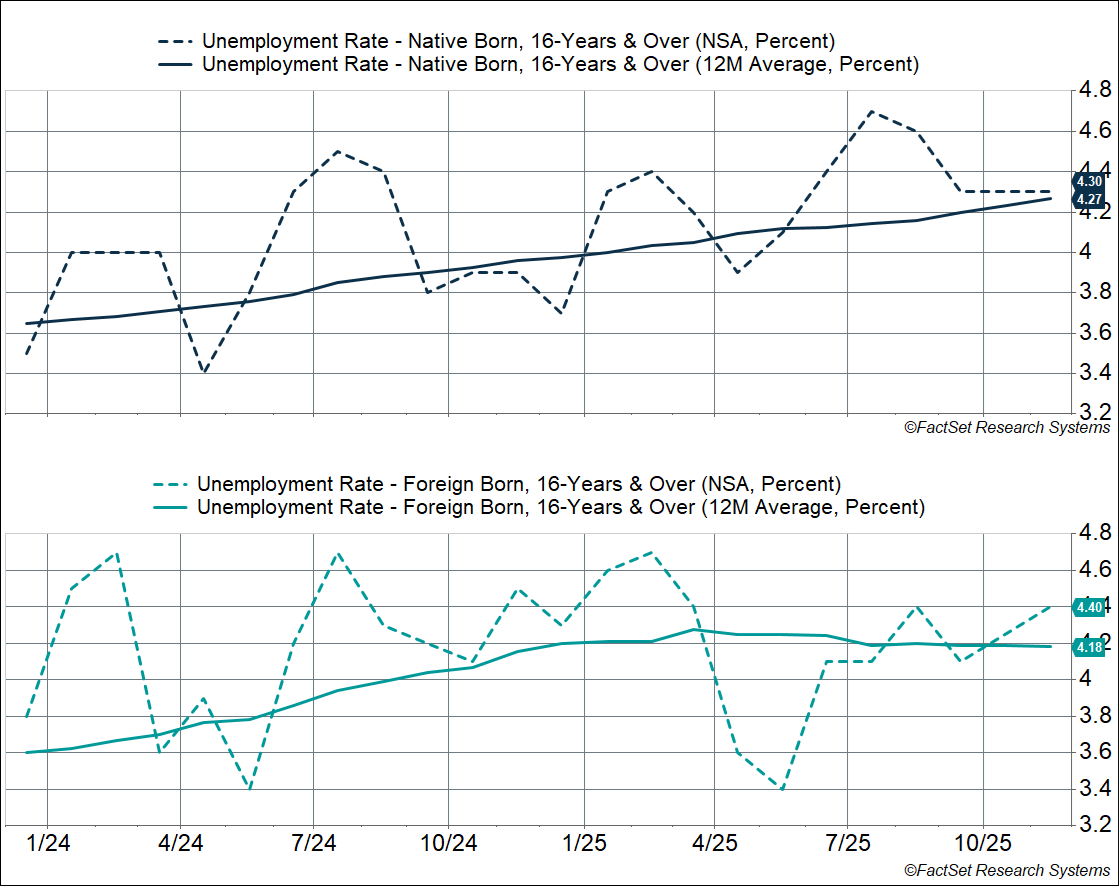
Interestingly, despite the collapse in immigration, the unemployment rate for native-born workers has risen over the past year. It hit 4.3% in November, up from 3.9% a year ago, whereas the unemployment rate for foreign-born workers is at 4.4% now, down from 4.5% a year ago. The solid lines in the chart below show the 12-month moving averages of unemployment rates for native- and foreign-born workers. You can see it rising for native-born workers this year, but flatlining for foreign-born workers.
Wage Growth Eases, as Does Aggregate Income Growth
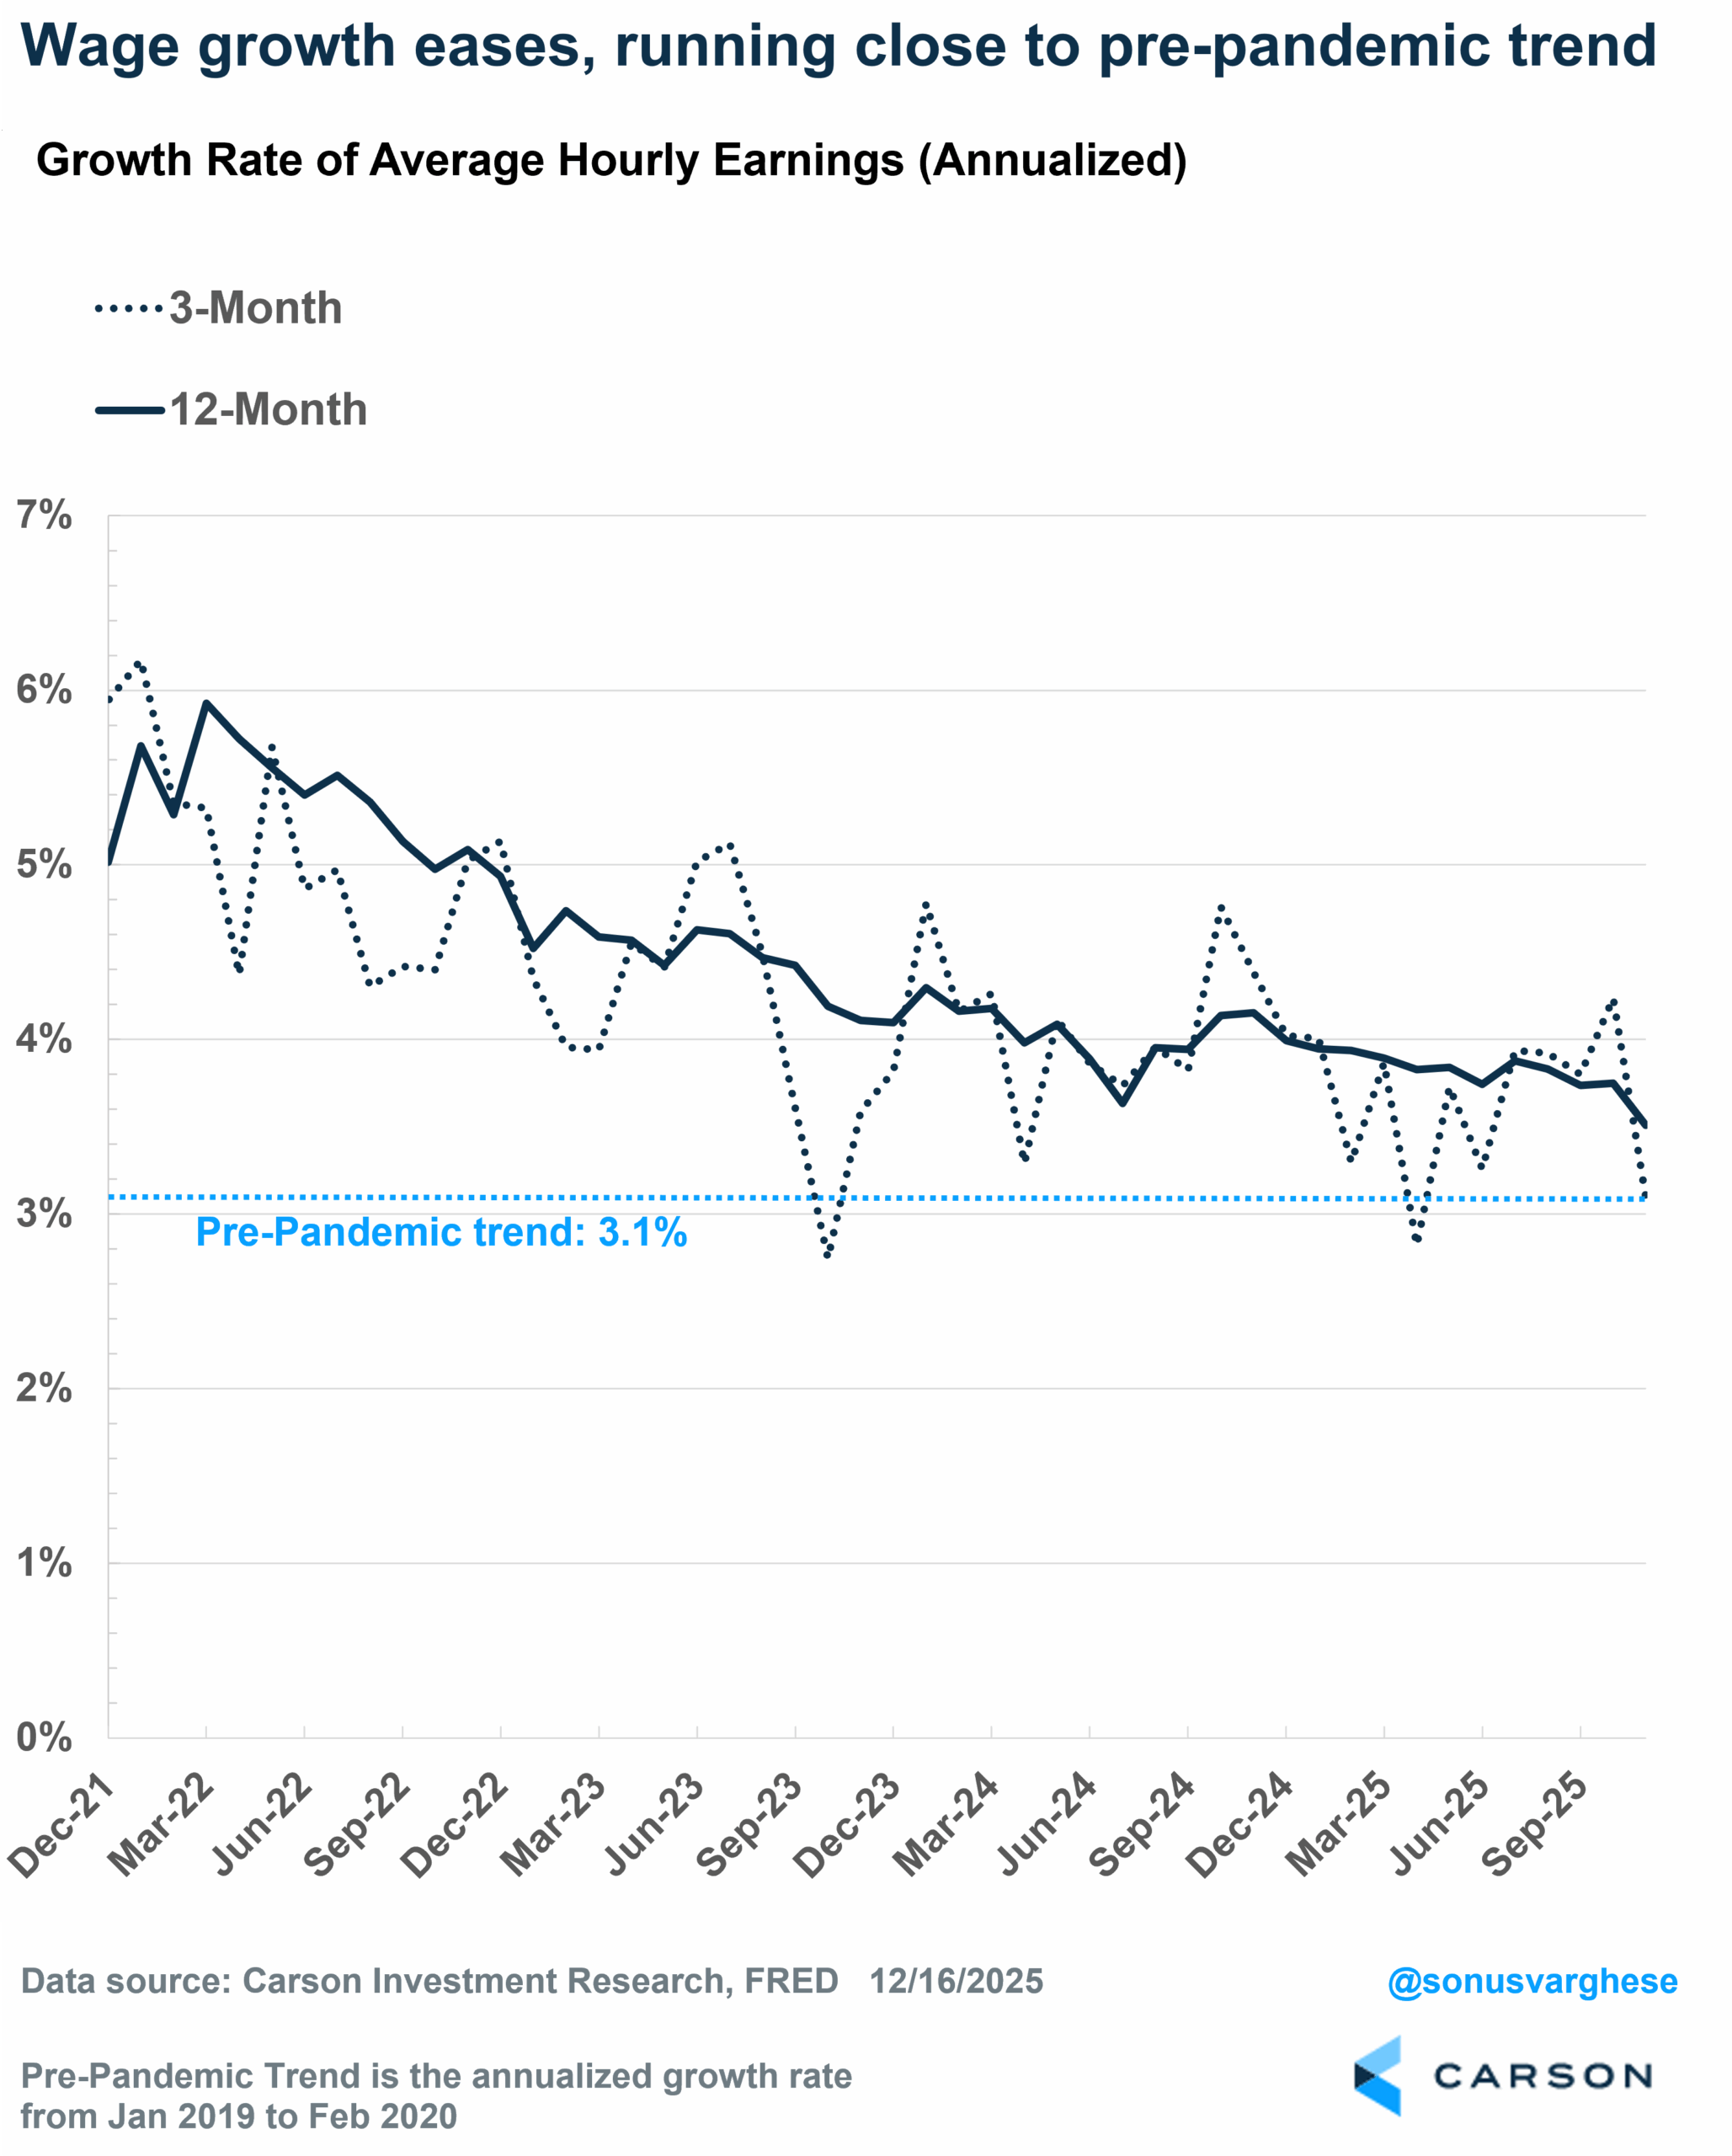
The other theory behind reduced immigration is that it boosts wage growth, as lower-wage immigrant workers leave the workforce. That hasn’t happened either. Wage growth has continued to ease and is up 3.5% year over year. That’s down from a relatively strong pace of 4% in 2024. The trend isn’t great and we’ve seen more deceleration in recent months—the 3-month annualized pace is just 3.1%, similar to what it was pre-pandemic.
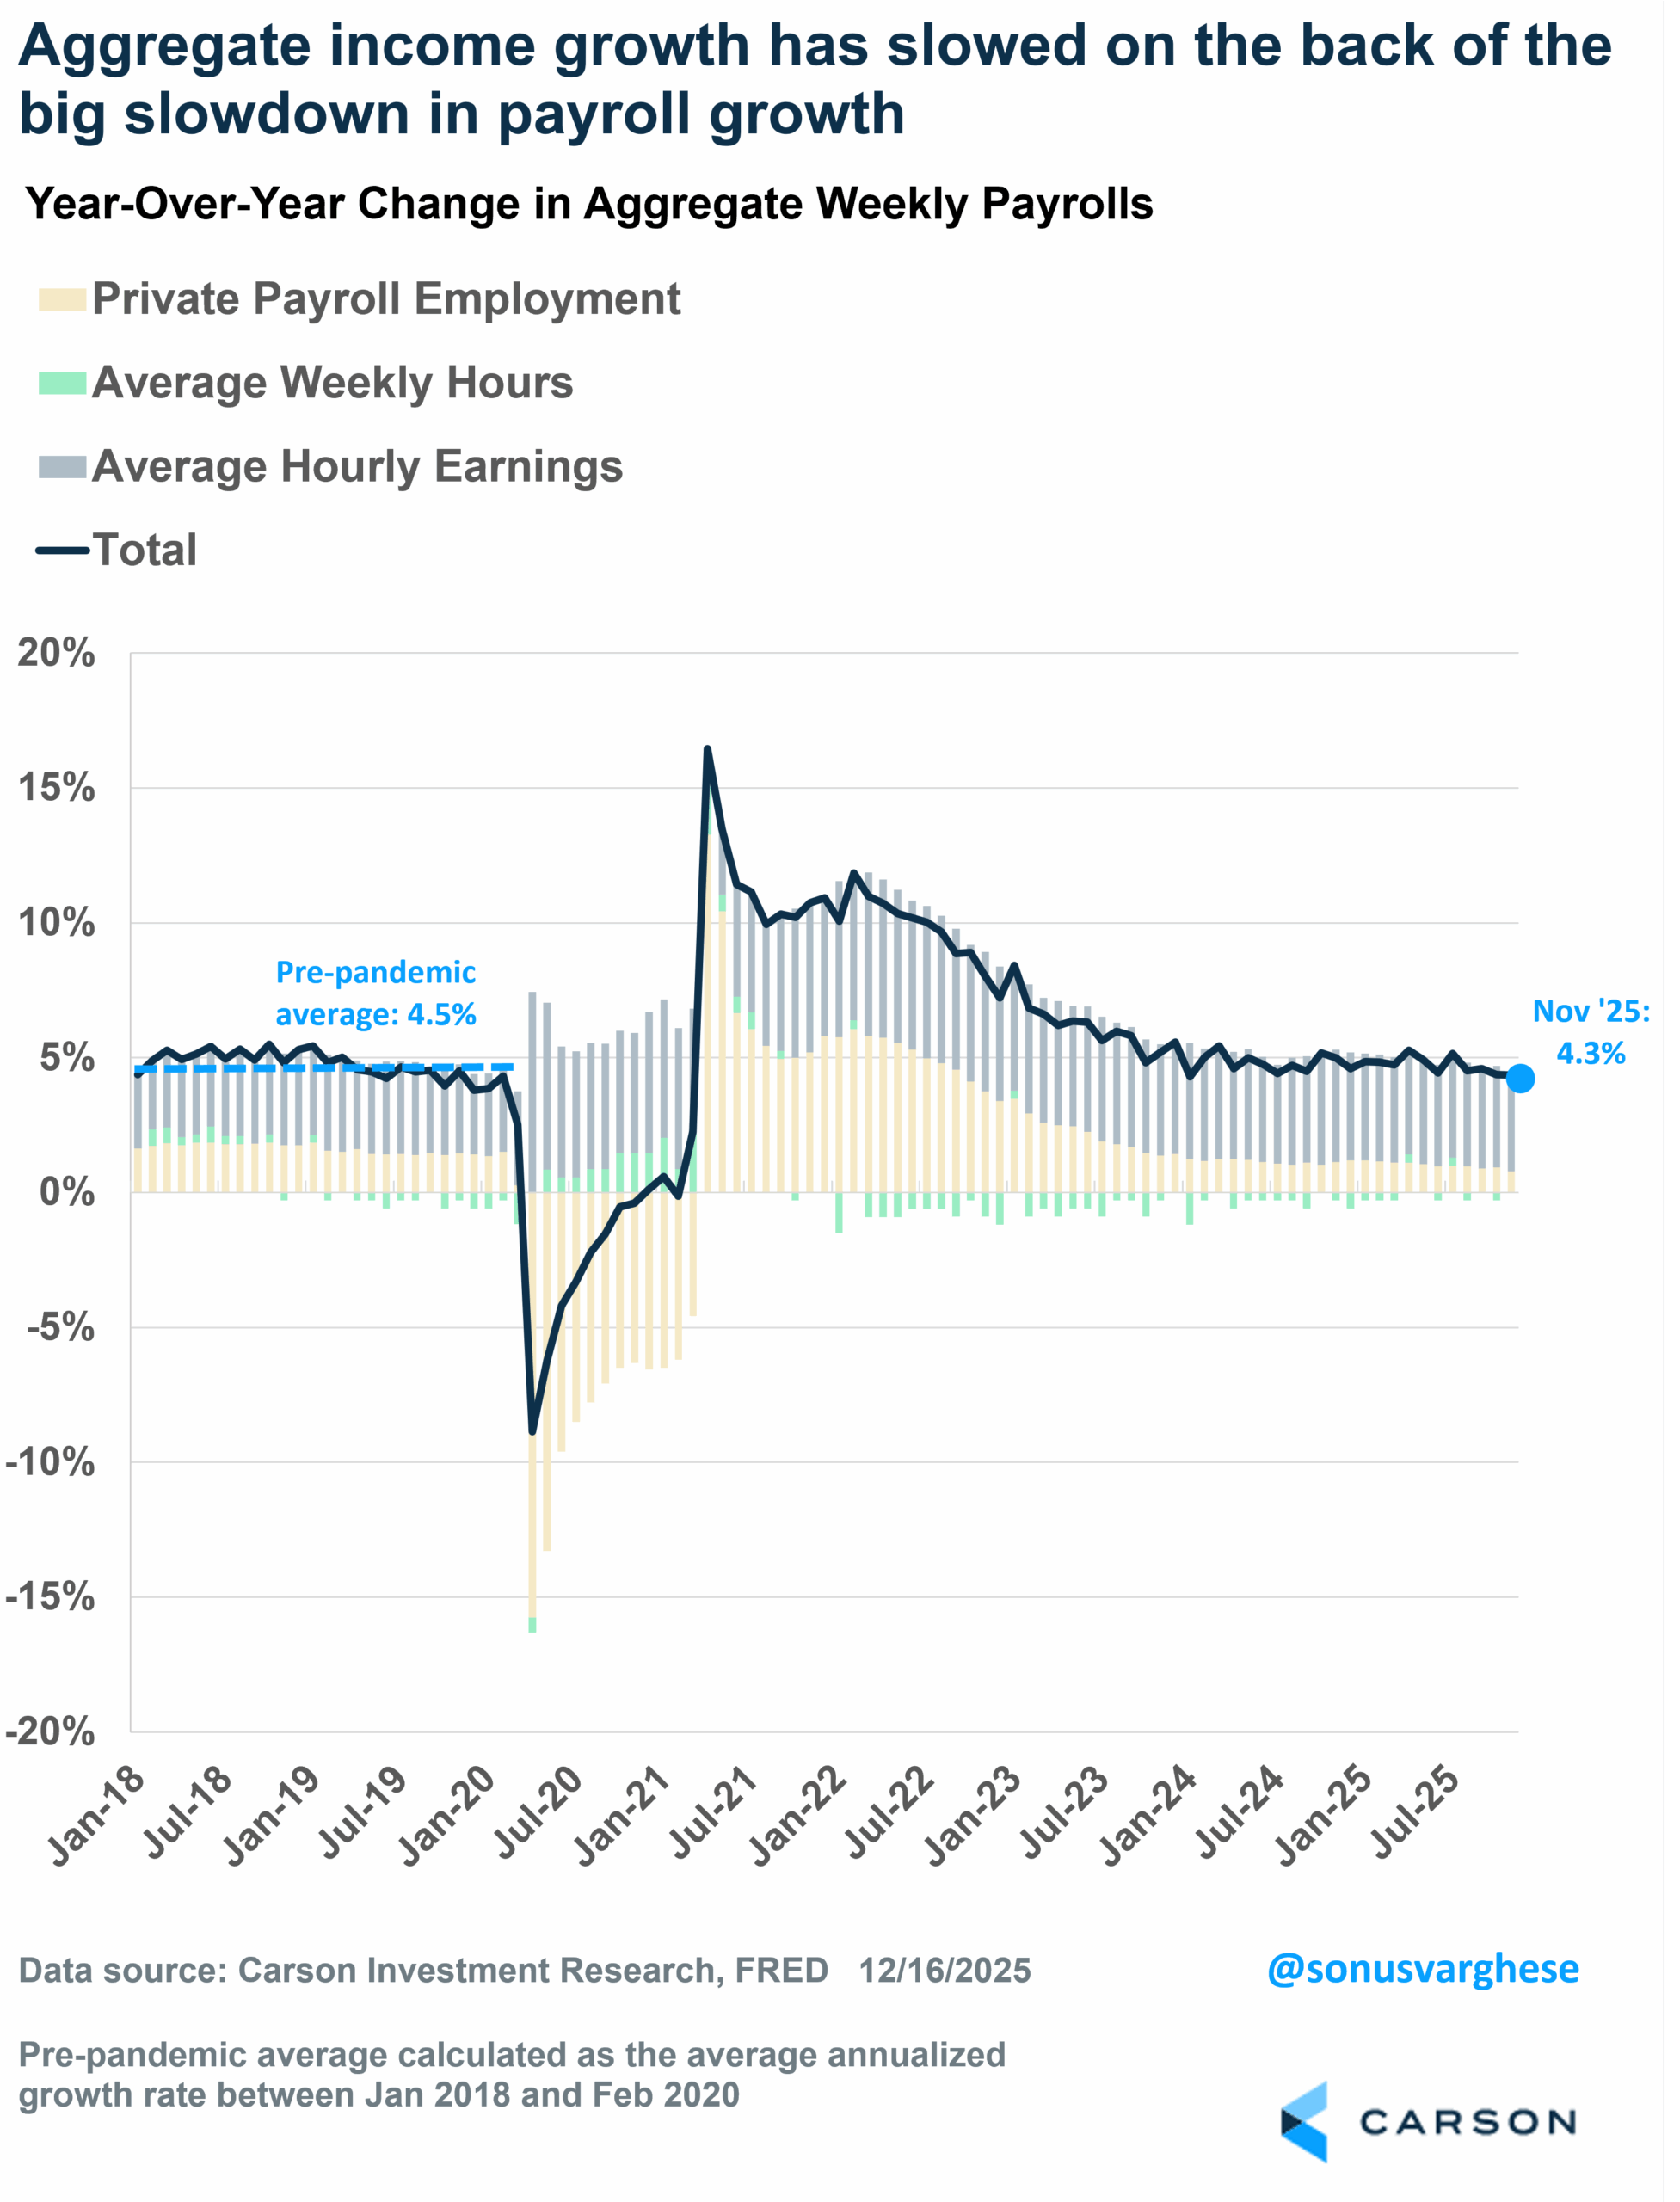
Ultimately, what matters for the economy is consumer spending, since it makes up close to 70% of the economy. The big driver of consumption is aggregate income growth, which is the sum of employment growth, wage growth, and hours worked. You can see the problem: employment growth has slowed down significantly and wage growth is easing, which means aggregate income growth is also easing. It’s up 4.3% year over year as of November, the slowest pace since March 2021 and below the pre-pandemic pace of 4.5%. That puts downward pressure on consumer spending and thus, overall economic growth, likely bringing it closer to trend growth of 2–2.5% rather than the near 3%+ real GDP growth we saw in 2023–2024.
The labor market is clearly cooling, though labor market indicators don’t point to a full-blown recession. Still, a rising unemployment rate and negative job growth are concerning, and as I noted at the top, it solidifies the Fed’s case for cutting rates over the past few months. If the unemployment rate stays at 4.6% in December, that’s going to increase the odds of another cut in January. What is concerning is that over the last 15 months, the Fed has cut rates by 1.75%-points and despite that, the unemployment rate has continued to rise. It gets to the fact that other factors have overwhelmed any respite from lower rates, especially uncertainty from all the tariff chaos this spring. The good news is that this uncertainty should recede as we go into 2026. There will be a few more tailwinds as well, including tax cuts and the lagged effect of recent interest rate cuts.
For more content by Sonu Varghese, VP, Global Macro Strategist click here.
8672571.1. – 18DEC25A
