
We had a big birthday last week, as the Dow Jones Industrial Average turned 129 years young! It is the second oldest index (the Dow Jones Transportation Average is older) and was first calculated on May 26, 1896 by Charles Dow, co-founder of both the Wall Street Journal and Dow Jones & Company.
It started as 12 companies, representing the big parts of the economy at the time, like leather, steel, and sugar. It was meant to gauge the overall health of the industrial sector. Of course, today it is 30 of the largest publicly traded companies (as it has been since October 1928) and is still widely considered one of the most well-known and cited indices in the world, but it is also one of the best gauges for the overall health of the US economy.
Here are 12 fun stats to celebrate the big birthday:
- None of the original 12 are left. General Electric was the most recent of the 12 to be included, but was it removed October 2018. Another fun stat, it was removed two other times in 1898 and again 1901, for a total of three times.
- It started with 12 stocks, but moved to 20 in 1916 and 30 in 1928. To this day, many think 30 is still too small of a sample size, but it doesn’t look like this will change anytime soon.
- A committee at the S&P Dow Jones Indices picks the components and there isn’t a ridged process or formula.
- The best year ever? A cool 82% gain in 1915, which also happened to be in the middle of World War I.
- 1931 takes the cake for the worst year ever, down nearly 53%. The Great Depression sparked this weakness, as stocks eventually fell 86% from their peak in 1929.
- It is price weighted, meaning a stock with a higher price will have more impact on the daily change. For example, when UnitedHealth Group (UNH) had their recent troubles, this made the Dow returns look worse than it was under the surface or compared with market-weighted indexes like the S&P 500.
- Average is in the name, but it isn’t an average, it is an index.
- It was up a record nine years in a row in the 1990s.
- It fell 20.5% on December 14, 1914 as World War I broke out, but the worst day ever was the 22.6% crash on October 19, 1987, better known as the Crash of 1987 or Black Monday today.
- The Dow has gained double digits in one day nine times, with the most recent off the COVID lows on March 24, 2020. The best single day ever was a 15.3% gain on March 15, 1933. Ides of March indeed.
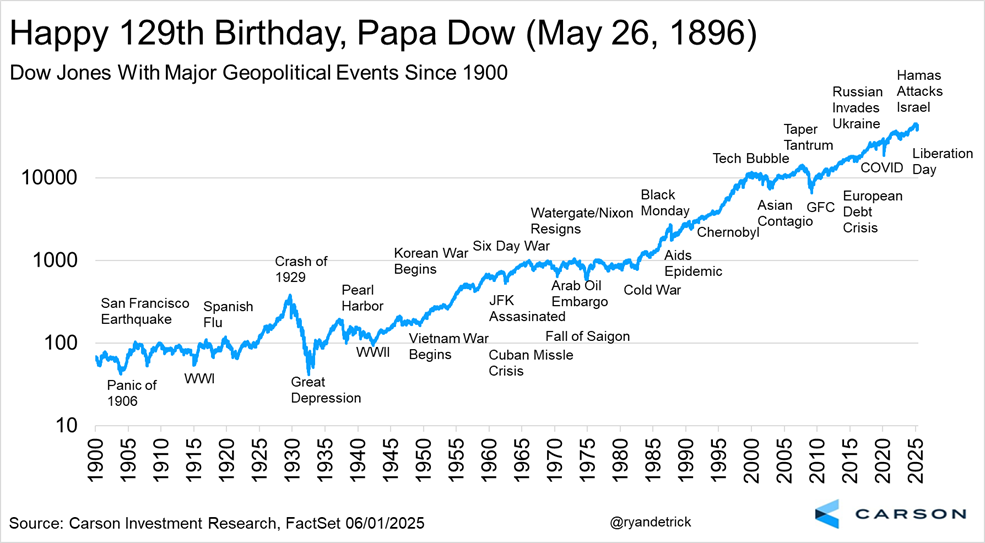
- The best part about the Dow is how much wealth it has created over generations for investors (if you were able to track the index). It started trading at 40.94 and recently peaked at more than 45,000. And that doesn’t even include dividends! Along the way there have been many worries and concerns, yet stocks have eventually moved higher every single time. Here’s our always popular Chart of Worries showing just this.
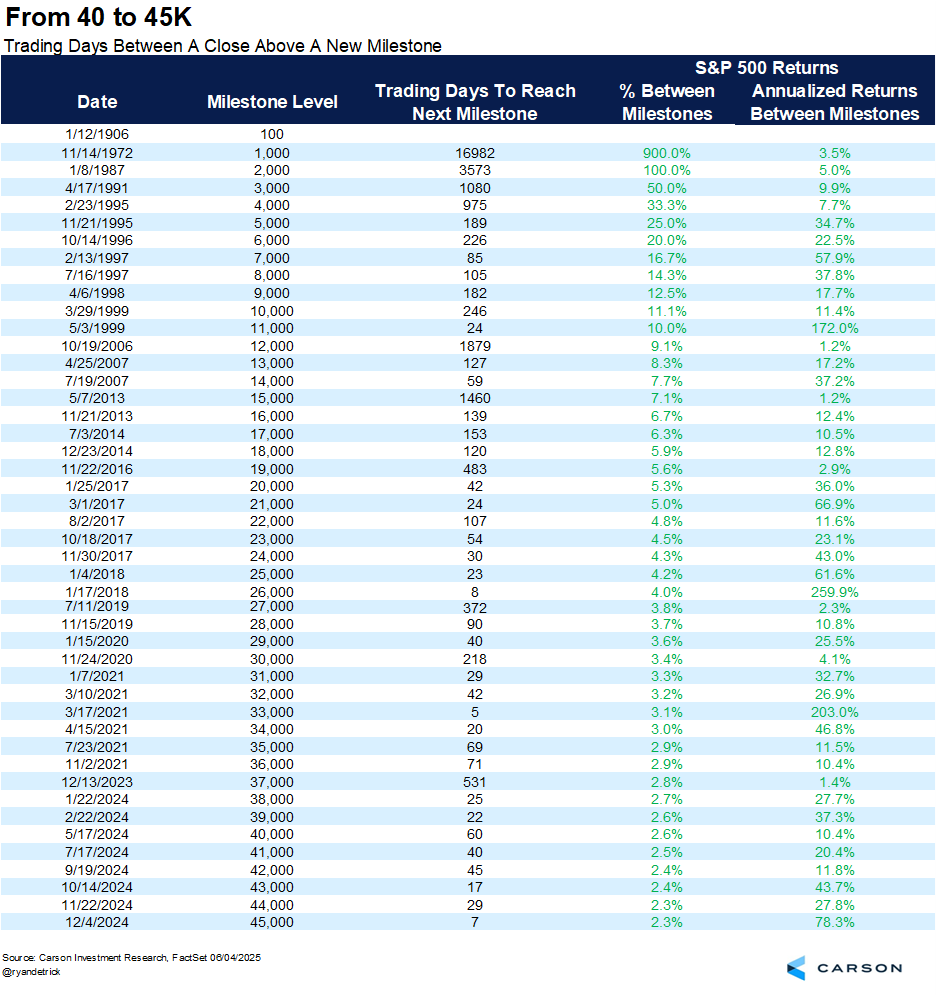
- Lastly, it closed at about 100 in 1906 and 1,000 in 1972. It took till 1999 to get over 10,000 and recently peaked above 45,000 in December. The fasted 1k interval ever was only five days from 32,000 to 33,000 in March 2021. Any bets on when it breaks 100k?
Congrats again to the Dow on an amazing run and to all the investors over the years who have benefited by sticking to their investment plans. Thanks for reading and for the latest on our views of the TACO trade, economy, Fed, and this big rally, be sure to watch our latest Facts vs Feelings below.
8038813.1-06.04.25A
For more content by Ryan Detrick, Chief Market Strategist click here
