The S&P 500 gained 17.8% over the last 11 months, including dividends. The November return of 0.1% was its 7th straight month of gains, and the index is now just 1% off its all-time highs. While the index was near flat for the month of November, next 12-month earnings rose another 2%, which meant earnings growth accounted for even more of the S&P 500’s year-to-date return than before.
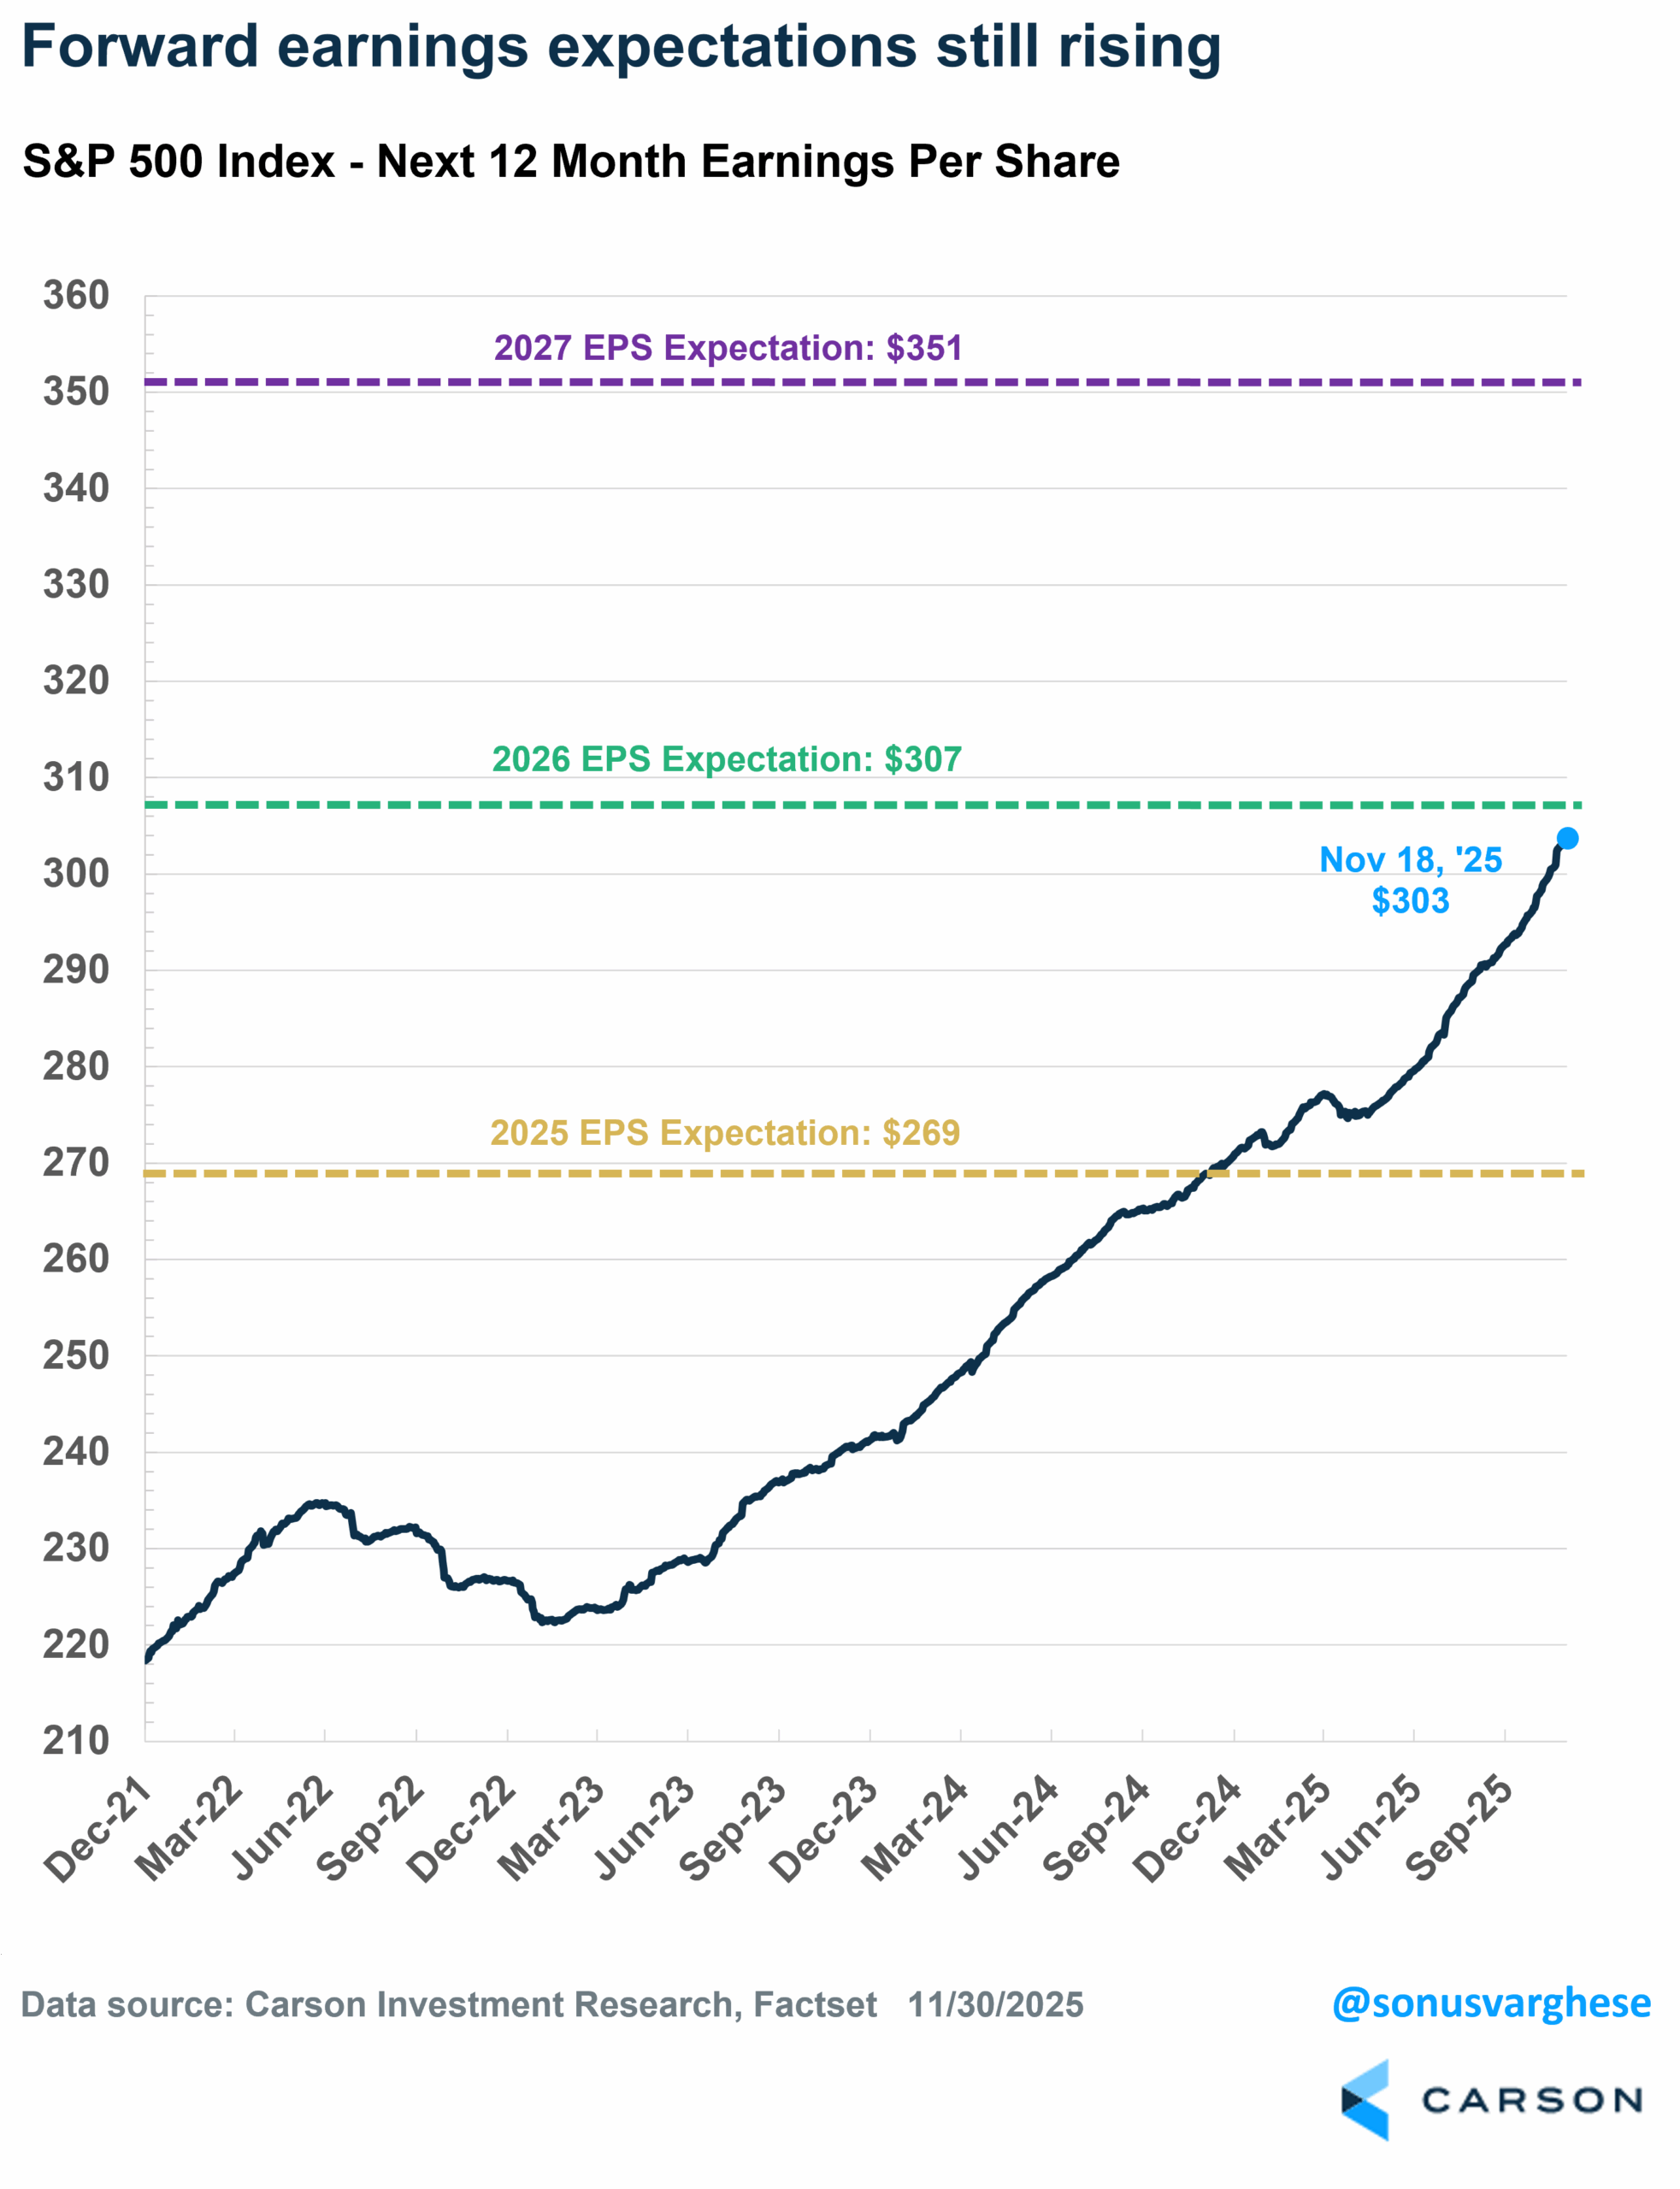
The S&P 500’s next-twelve-months (“NTM”) earnings per share (“EPS”) is currently at $303, up 12.6% year to date. Keep in mind that the NTM EPS is now mostly about 2026 EPS expectations. About 1/12th of NTM EPS is expected EPS for 2025 ($269) and 11/12th expected EPS for 2026 ($307). At the end of the year, the NTM estimate will match the 2026 estimate exactly.
Here’s what’s interesting though. 2025 EPS expectations eased about 0.7% over the year (falling from $271 to $269). However, 2026 EPS expectations eased just about 0.3% (from $308 to $307). That means 2026 EPS growth expectations increased since the start of the year, from 13.7% to 14.1%. Moreover, 2027 EPS expectations rose 2.3%, from $343 to $351, implying S&P 500 earnings are expected to grow 14.3% in 2027. Keep in mind that as 2026 gets underway, NTM EPS should continue rising, as it incorporates more of 2027 EPS expectation (as long as 2027 EPS doesn’t fall significantly). In other words, we’re likely looking at yet another year of strong EPS growth.
As I’ve noted in the past, we can separate the S&P 500’s return into contributions from earnings growth, multiple changes, and dividends.
The S&P 500’s YTD return of 17.8% came from:
- Earnings growth contribution: +12.2%-points
- Multiple growth contribution: +4.2%-points
- Dividends: +1.4%-points
In short, 13.6%-points of the index’s YTD return in 2025 came from profits, both retained and distributed, or about 76% of the return.
Nominal Growth + Margin Expansion = Profit Growth
Profit growth can be separated into two pieces: sales growth and margin expansion. Sales growth is closely tied to nominal GDP growth—as long as we don’t have a recession sales growth should run fairly strong. Think of this as the connection between markets and the economy. Even in 2022, which was a tough year for markets, sales growth was strong (+8.5%) as the economy held up (no recession), but EPS growth was weak (+3.8%) because of a pullback in margins amid surging interest rates.
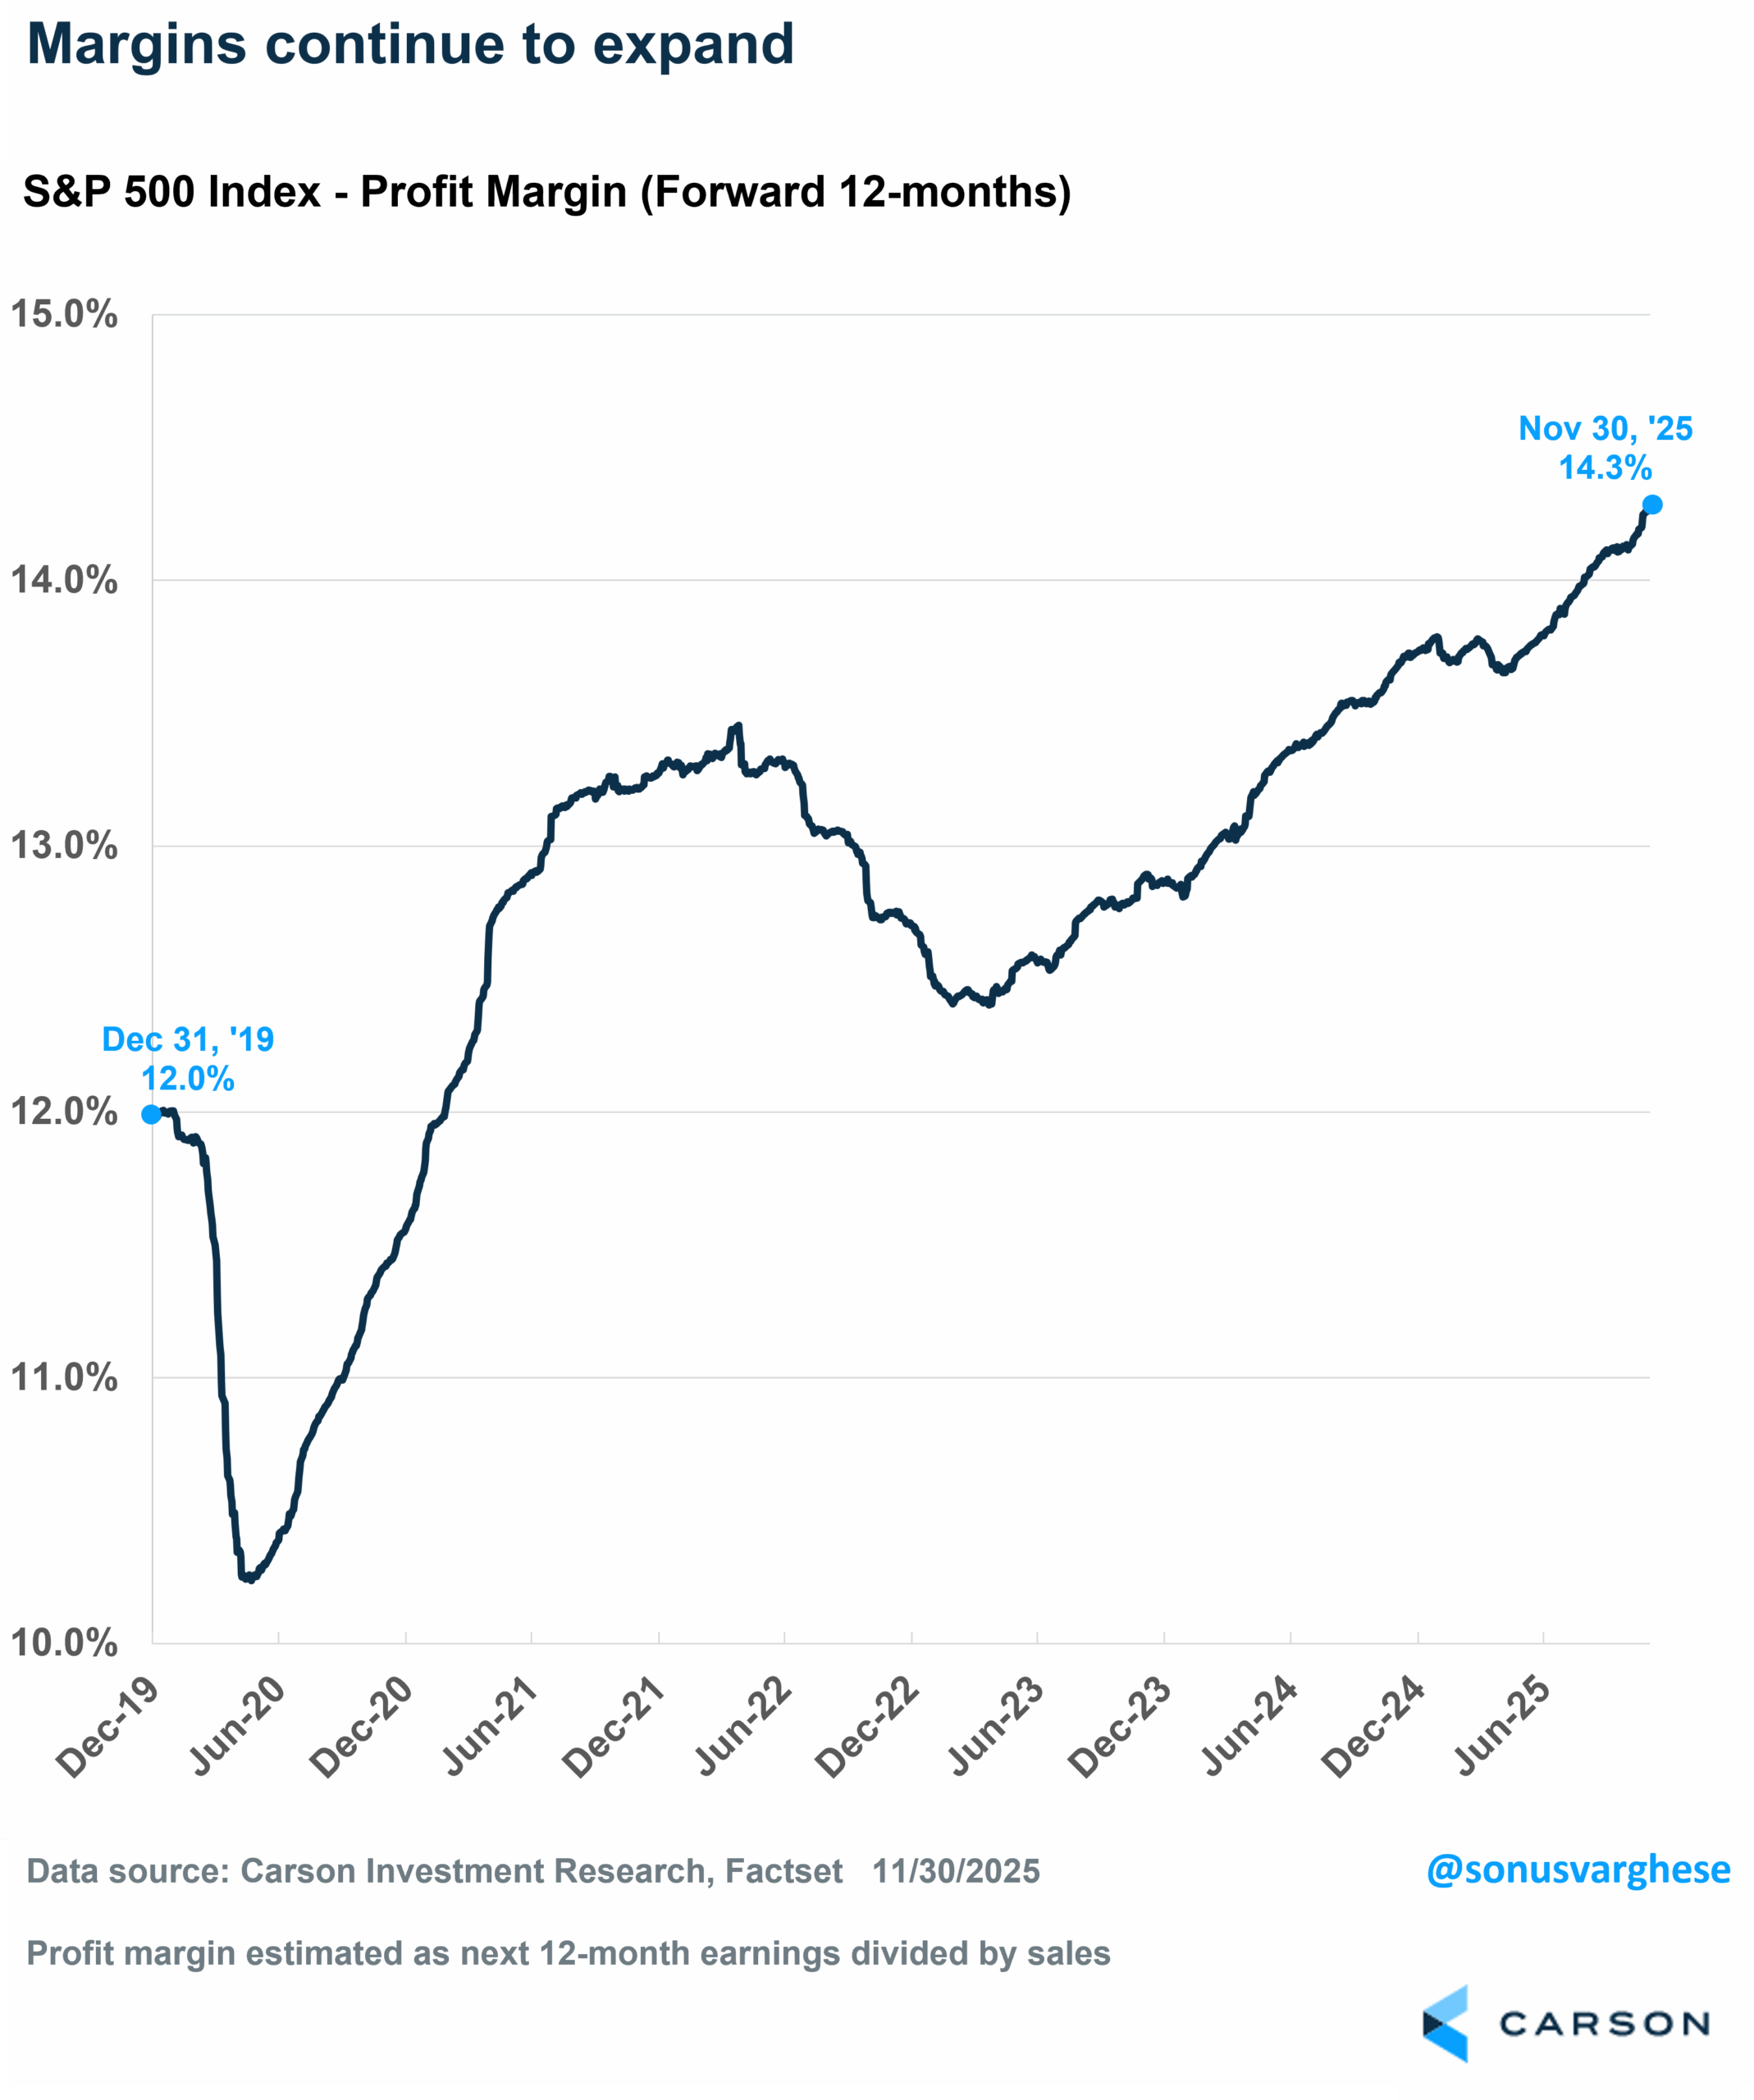
Margins have expanded a lot over the last 3 years. Forward margins were around 12% at the end of 2019 and had expanded to 12.7% by the end of 2022. Since then, margins have expanded to 14.3%, a new all-time high.
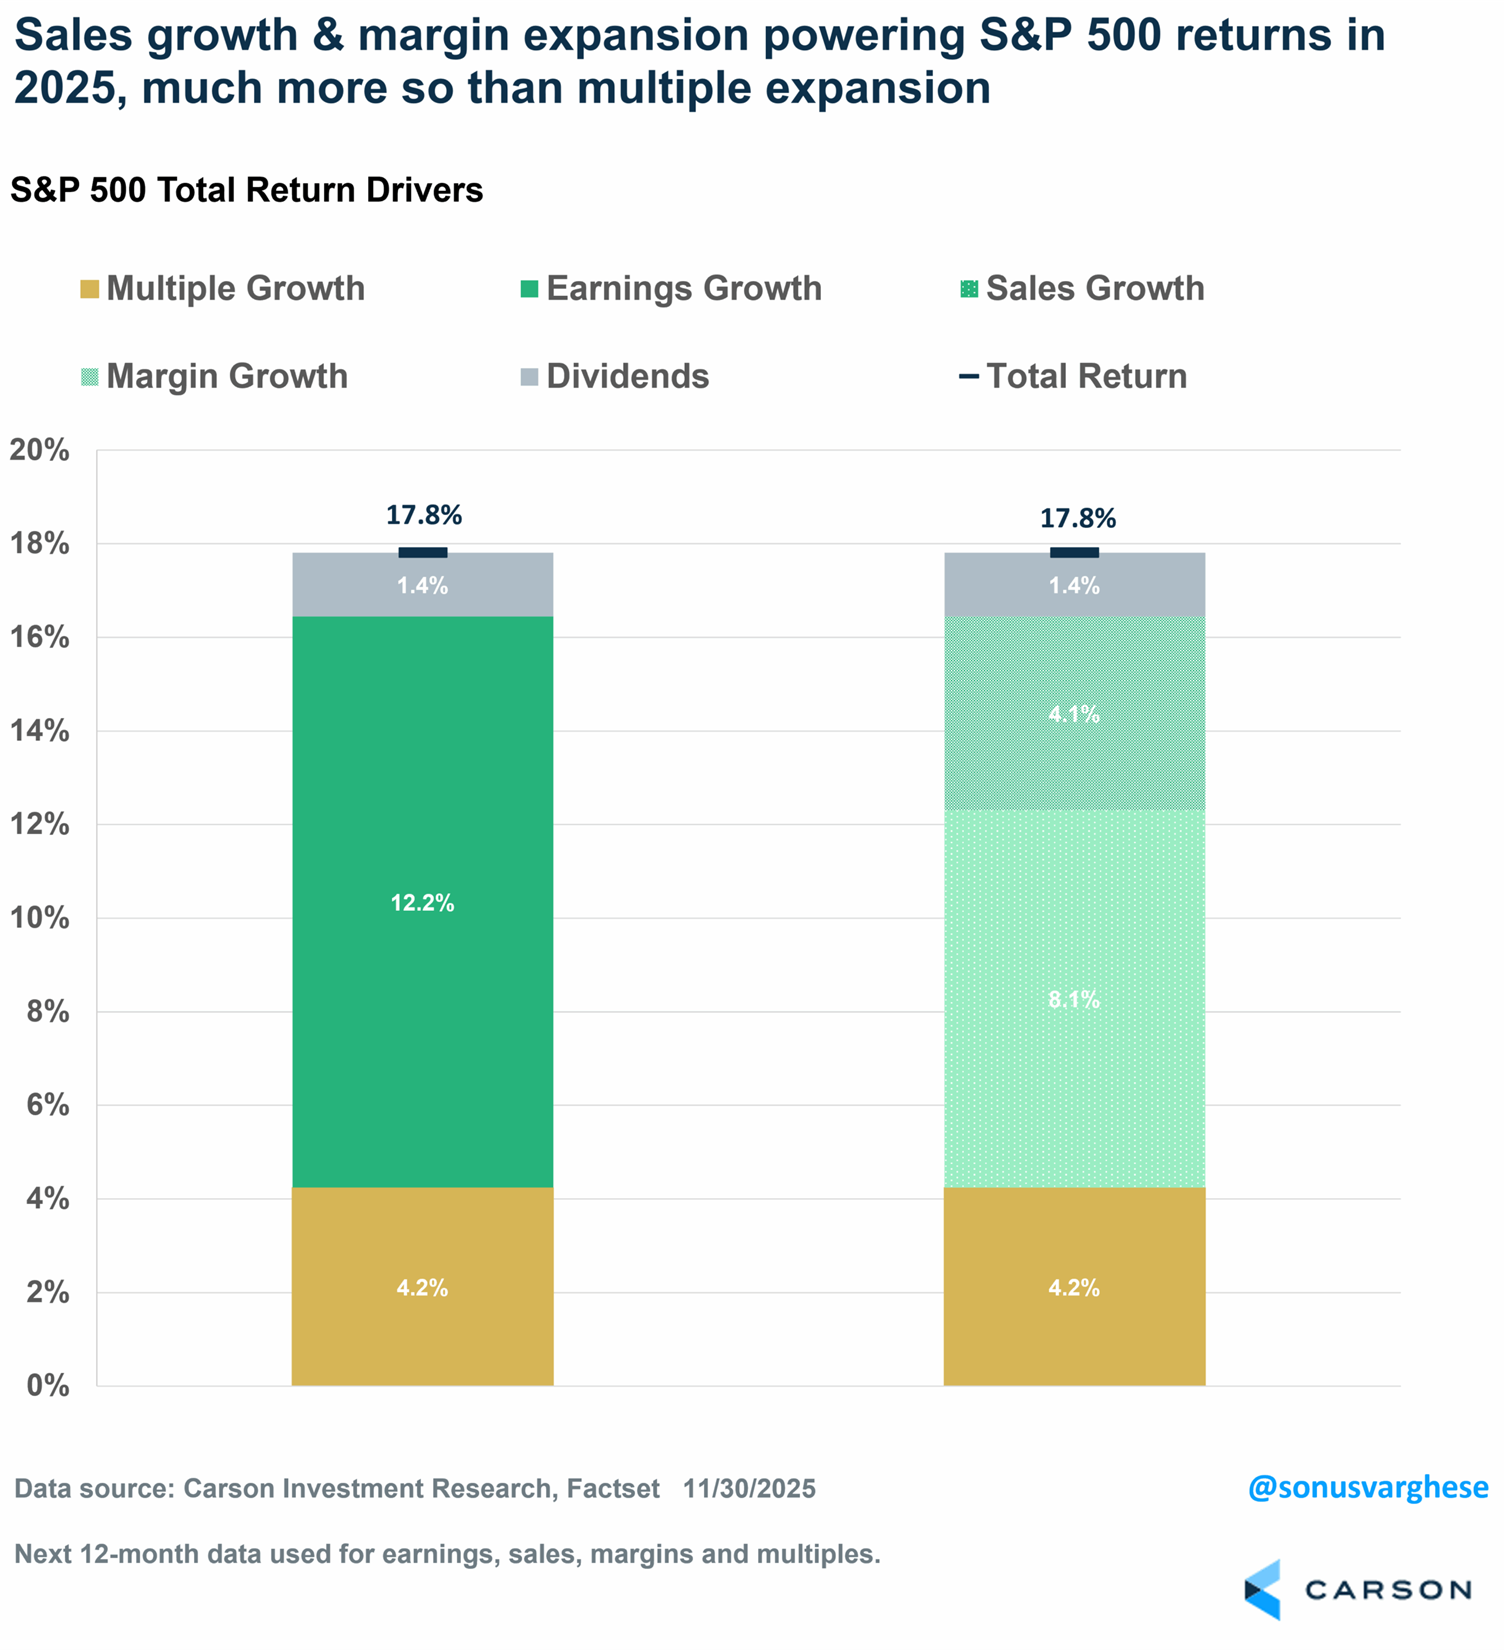
Here’s a look at how this has powered S&P 500 returns. We can break down EPS growth into sales and margins. As I noted above, the S&P 500 is up 17.8% year to date. Here’s how the contributors break down:
- Earnings growth: +12.2%-points
- Sales growth: +8.1%-points
- Margin expansion: +4.1%-points
- Multiple growth: +4.2%-points
- Dividends: +1.4%-points
Companies Overcome the Drag From Tariffs
Two things jump out from the breakdown of S&P 500 into return drivers, especially sales growth and margin expansion.
First, the fact that sales growth is strong (+8%) tells you that nominal GDP growth is fairly strong, going against the recession narrative. In fact, 2025 forward sales growth was even better than 2023 and 2024 (about +5%). This is partly due to the recovery in global growth as well. For Q3:
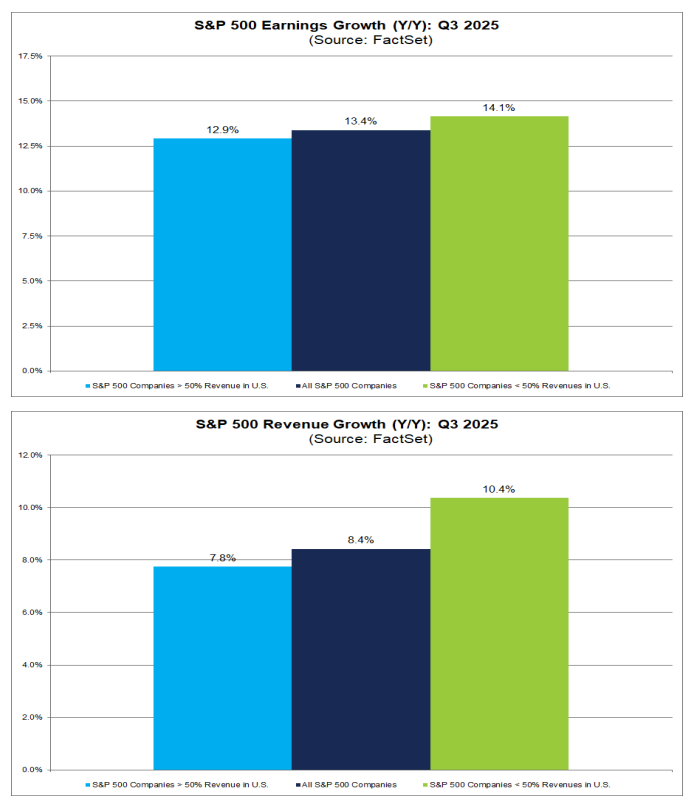
- S&P 500 revenue growth for Q3 was 8.4% and EPS growth was 13.4%.
- Revenue growth rose to 10.4% for companies with over 50% revenues outside the US, and EPS growth rose 14.1%.
- Revenue growth clocked in at 7.8% for companies with over 50% revenues in the US, and EPS growth: 12.9% (still a very strong number).
Note that these are trailing earnings—I prefer using forward earnings for return drivers, but the big picture is the same. We’re seeing strong sales growth, especially on the back of global sales, which has more than offset the slowdown in US growth
Second, strong margin expansion suggests companies have been able to navigate tariffs and associated uncertainty pretty well, by pushing higher input costs (tariffs) to consumers and/or cutting costs elsewhere (including labor).
To this end, here are a couple of interesting observations from the most recent earnings season, based on analysis from Goldman.
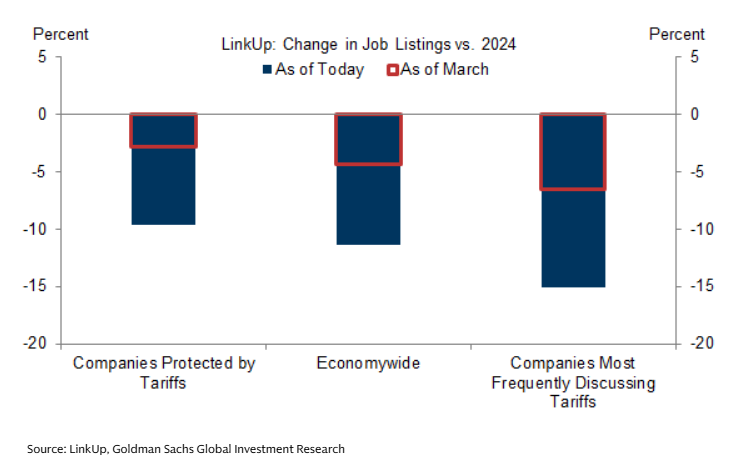
The frequency of tariffs (and tariff uncertainty) as a topic during earnings calls moderated further in Q3. At the same time, companies continued to discuss the costs of the tariffs, but notably, how they’re mitigating these costs, by passing through costs to consumers and reducing other costs, by reducing hiring, reducing headcount (including attrition), or pushing through productivity-enhancements (eg: AI initiatives). Goldman found that companies with greater exposure to tariffs and policy uncertainty have sharply reduced their job openings this year. Interestingly, companies receiving protection from foreign competition have reduced their job openings by slightly less than the public company average. The chart below shows that job openings at tariff-exposed companies have declined further this year.
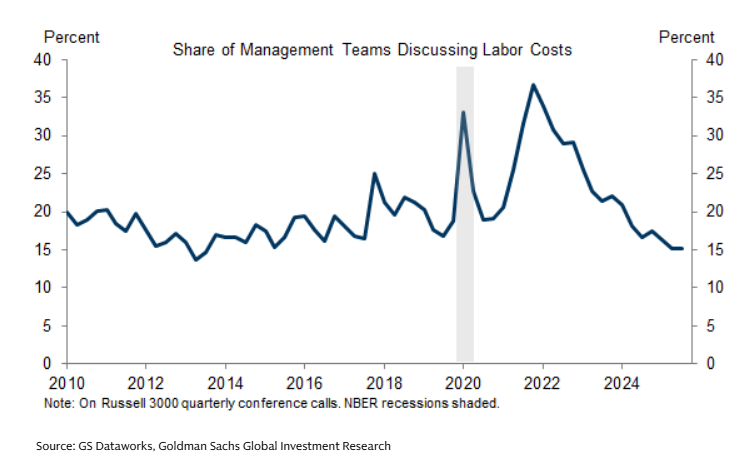
Company commentary also broadly confirmed that job growth remains tepid and the labor market is softer than just before the pandemic. This increase in slack has reduced the prevalence of labor costs as a theme across earnings calls. Mentions of wages and labor costs have fallen to the lower end of the pre-pandemic range down to the lowest levels in a decade.
While cooling wage growth (amid a cooling labor market) isn’t great for workers, that’s a boost for companies’ margins.
None of this should be a huge surprise given how the tariffs have played out. Prior to Liberation Day, the “best case” scenario that Wall Street analysts were expecting was a 10% increase in the average effective tariff rate (taking average tariffs from 2% in January to about 12%). While this would be a marked increase in input costs for companies, analysts expected companies to navigate this level of tariffs quite successfully, without a major hit to profit growth and margins. The “base case” was a 15% increase in the average tariff rate and the “worst case” was 20%.
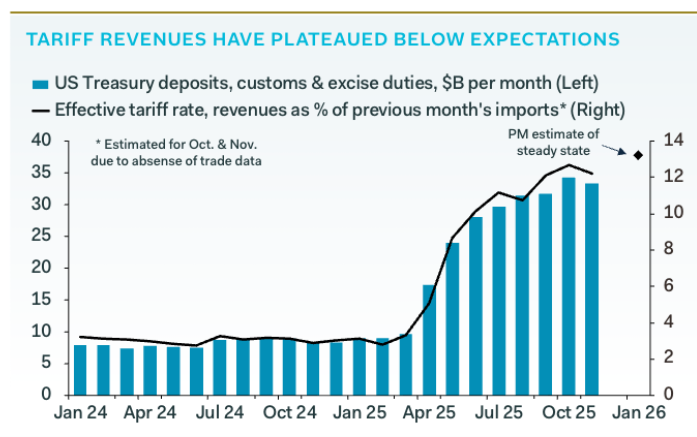
As it turns out, the US Treasury has collected just about $257 billion in tariffs year to date (through November 27th), about $167 billion more than the same time last year. The annualized pace clocks out to about $400 billion total, but that’s at least $100 billion below the half trillion predicted by Treasury Secretary Bessent (and others in the administration). But the key is this: average effective tariff rates are running around 12%, which was the “best case” scenario pre-Liberation Day.
Source: Forbes, 12/3/25, The tariffs are raising $100 billion less than Trump expected. Pantheon Macro sees 3 reasons why, starting with China
Lichtenberg
There are a few reasons why the average effective tariff rate is only about 12%, despite the “average statutory rate” being closer to 18%.
- There’s been a sharp decline in imports from China, with China’s share of imports dropping from 13% in 2024 to 9% this year. But those goods aren’t being manufactured in the US—instead, the goods are being re-routed through Vietnam, which now accounts for 6% of imports (up from 4% last year). Tariffs on Vietnamese goods are 20% while it’s closer to 50% on Chinese imports.
- USMC (the new NAFTA) compliance is running above expectations. The White House originally estimated that 38% of Canadian imports and 50% of Mexican imports were covered by USMCA, thus avoiding tariffs. Goods not compliant with USMCA are currently tariffed at 35% from Canada and 25% from Mexico, which means average effective tariff rates on these countries should be 18% and 13%, respectively. However, import data indicates the average effective tariff rate is about 5%, implying companies have done the extra regulatory paperwork required to make a lot more goods USMCA compliant (an example of how tariffs reduce productivity and are an implicit regulatory burden).
- A lot of computers and electronics equipment, especially AI-related equipment, are exempt from tariffs. These categories now account for 9% of all imports, up from 4% in 2024, and they aren’t being tariffed at the new, higher rates. The surge in high-tech imports may be one off, as companies looked to front run tariffs.
All in all, the S&P 500 is looking at a third straight year of strong returns (2023 was 26% and 2024 was 25%), and that’s come on the back of profit growth rather than multiple expansion. As Ryan wrote in his latest blog, December could be yet another positive month. We talked about all this on our latest episode of Facts vs Feelings – take a listen below.
For more content by Sonu Varghese, VP, Global Macro Strategist click here
8647358.1-3DEC25A
