
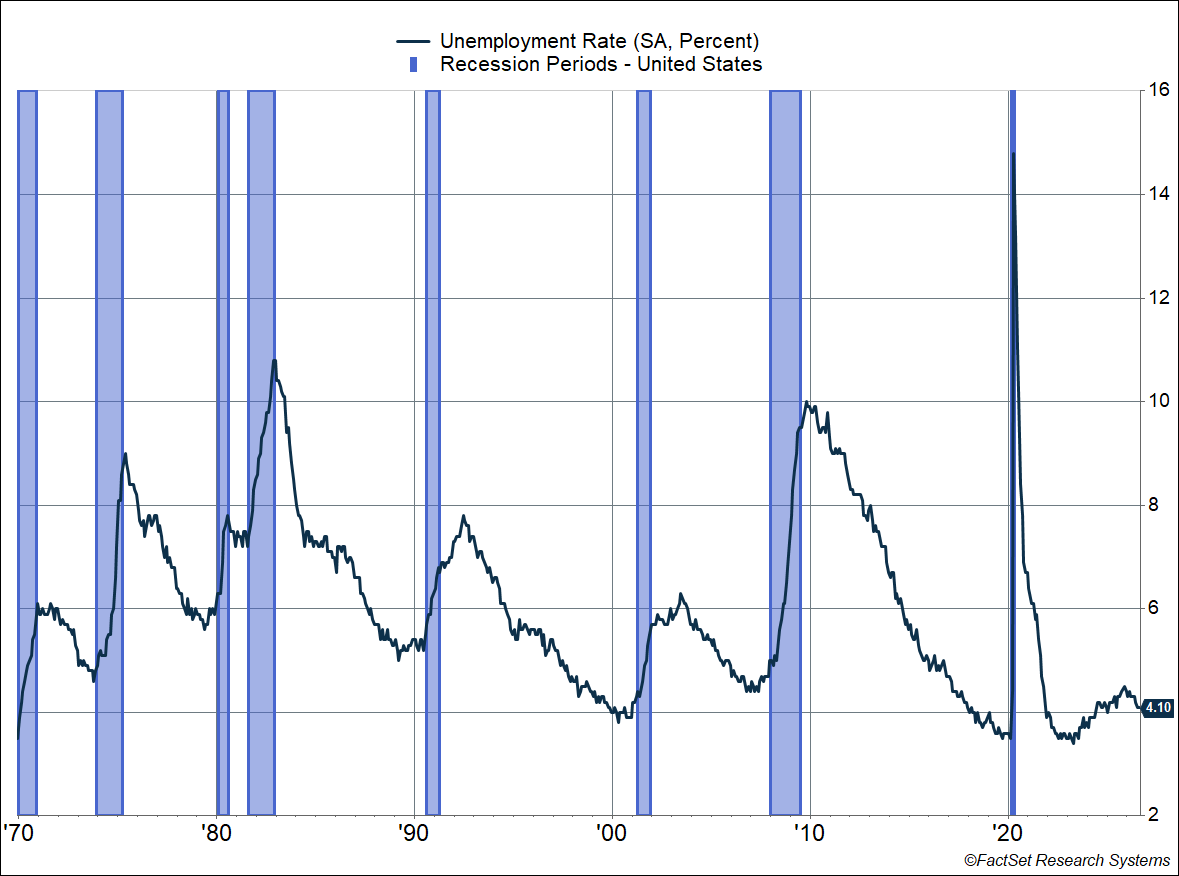
The evidence for a hot economy keeps racking up. As I see it, the industrial economy is clearly in a boom on the back of enormous AI-related investment. A lot of folks pointed to a slowdown in payroll growth in recent months to counter that, nevermind the fact that the unemployment rate is near historical lows at 4.1%. Well, the August payroll report should settle the debate for now (though I hardly imagine it will, including within the confines of the Fed).
The economy created 162,000 jobs in August, the highest monthly gain since March. One-month payroll numbers can be noisy and tend to be revised, and that’s why it’s better to use a 3-month average. Last month, the 3-month average of job growth was at a rather worrisome 20,000, but with upward revisions to June and July data, that’s risen to 71,000.
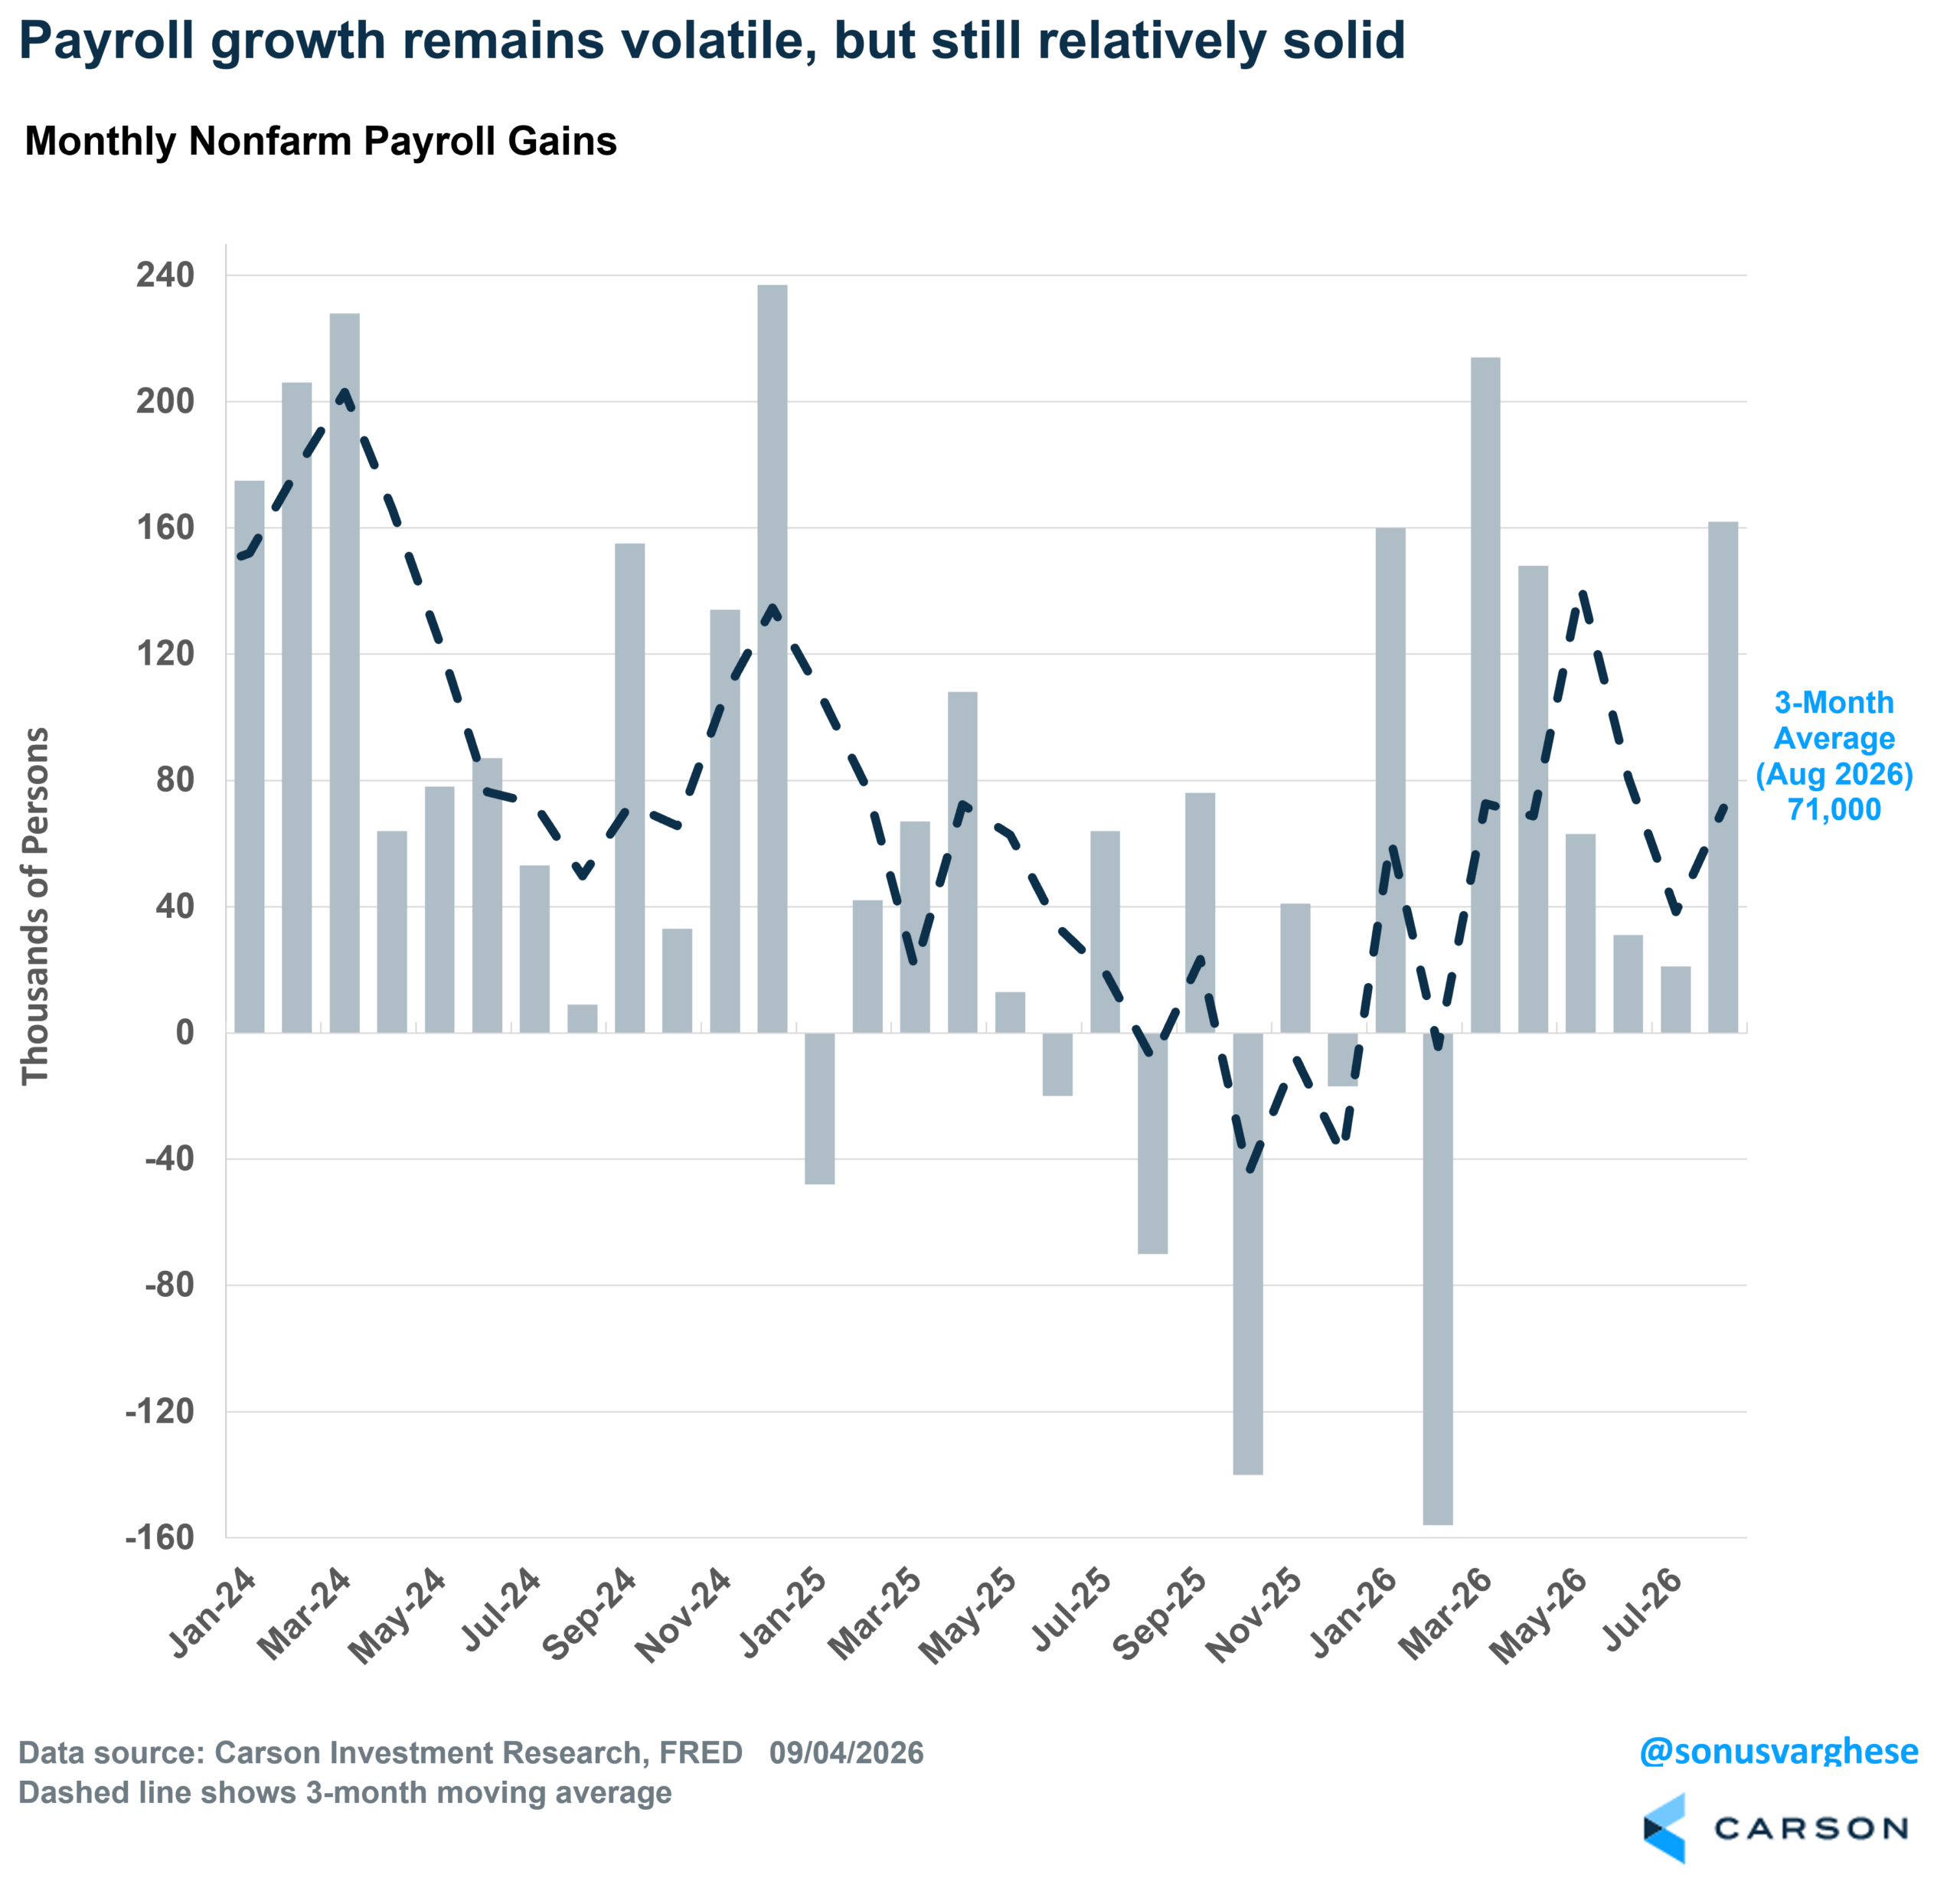
A 3-month average of 71,000 for job growth doesn’t seem spectacular, but keep in mind that with labor supply running low (especially with the immigration stall), the economy needs to create fewer jobs to keep up with population growth. In other words, there are fewer people to hire, and so hiring looks weaker even though the labor market is in good shape. This is underlined by the fact that the unemployment rate remained steady at 4.1% in August, near historical lows, and much improved from last year (when it hit 4.4%). The unemployment rate has now been at 4.5% or below for a record 59 consecutive months (almost five years).
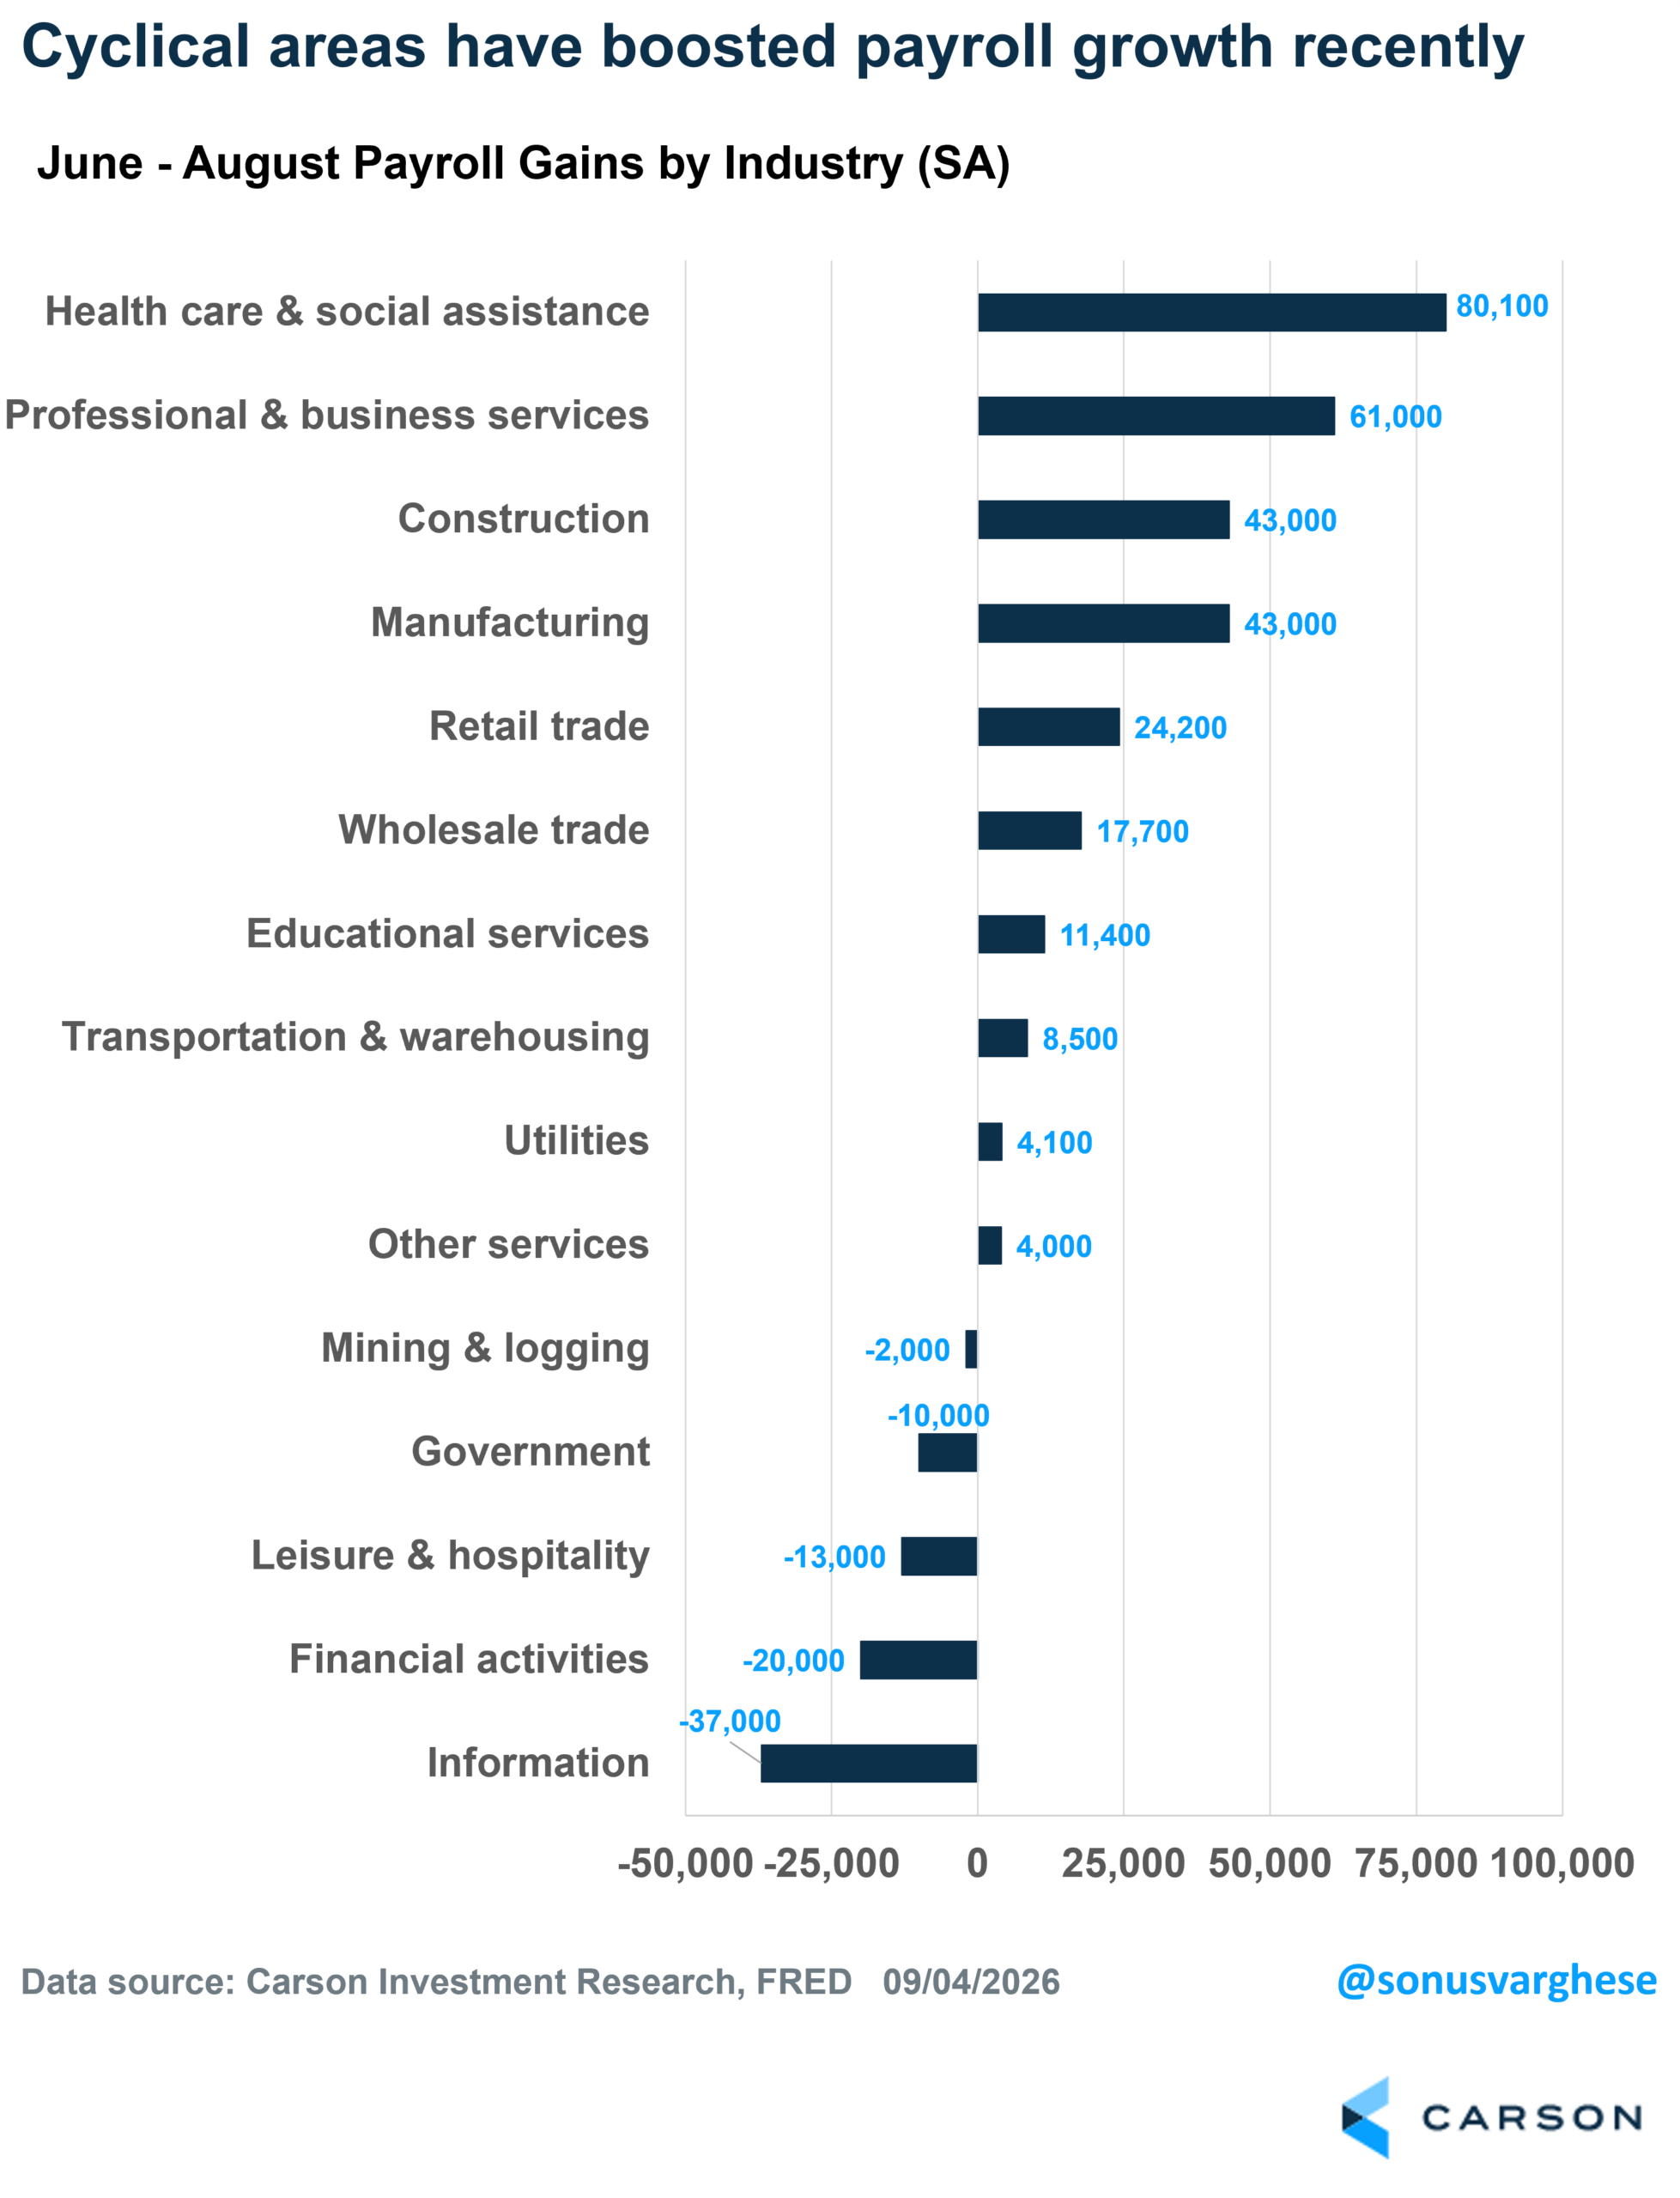
Labor market improvement is also evident in the cross-section of payroll growth across industries over the last three months. The private sector has created 224,000 over this period, and the leading contribution has come from the health care sector, which accounted for 37% of that (80,000). However, the next several leading areas are all cyclical, including professional and business services (+61,000), construction (+43,000), manufacturing (+43,000), and retail and wholesale trade (+42,000). These together account for 88% of job growth since June. Construction is being boosted by data center construction, while manufacturing improvement is coming from the durable goods sector (also largely an AI-related story).
One area that is struggling is “Information”, which is mostly because of layoffs in the telecom and tech sector. But rather than this being driven by AI, it’s more likely a story of tech companies needing to cut labor costs as they spend more on AI infrastructure.
We’re In A Period Of Strong Inflationary Growth
When I say the economy is running hot, I mean the nominal economy. Think of it like nominal GDP growth, which is the sum of real GDP growth and inflation. Real GDP growth is likely running close to trend, but inflation is clearly elevated. In other words, we’re looking at nominal GDP growth continuing to run near 6%, well above the 2010-2019 trend of 4% and closer to the late 1990s pace (see my previous blog on this).
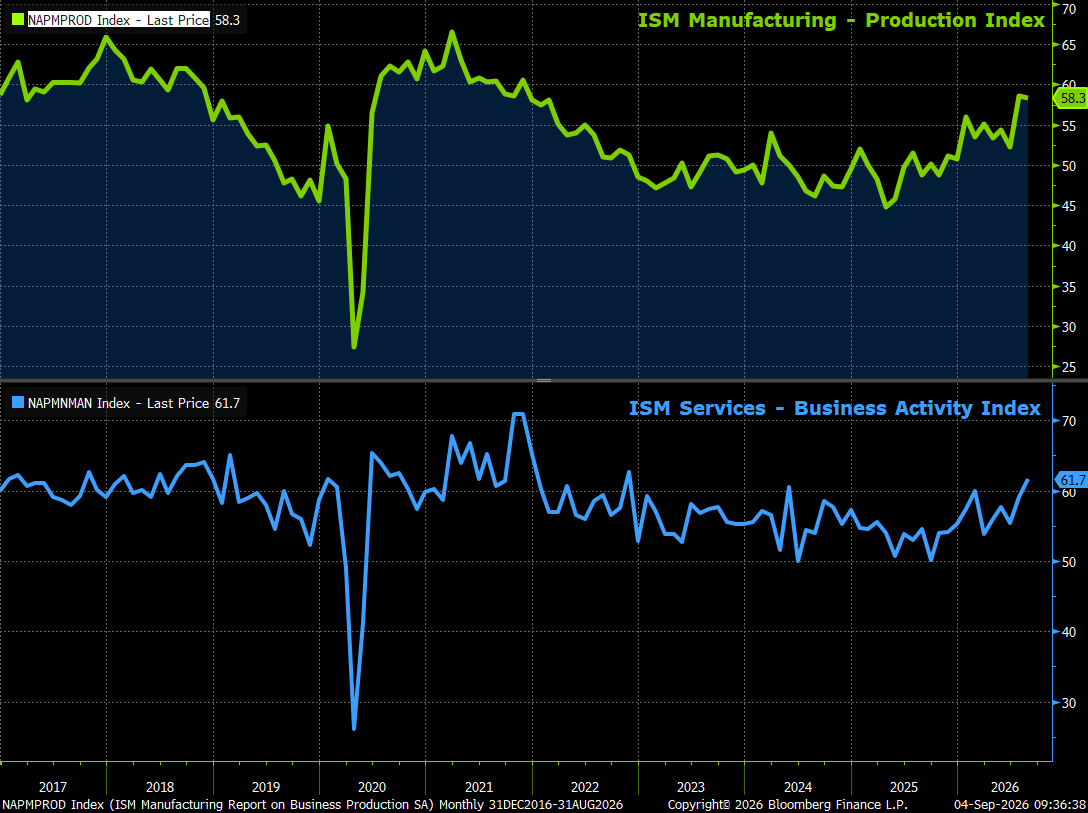
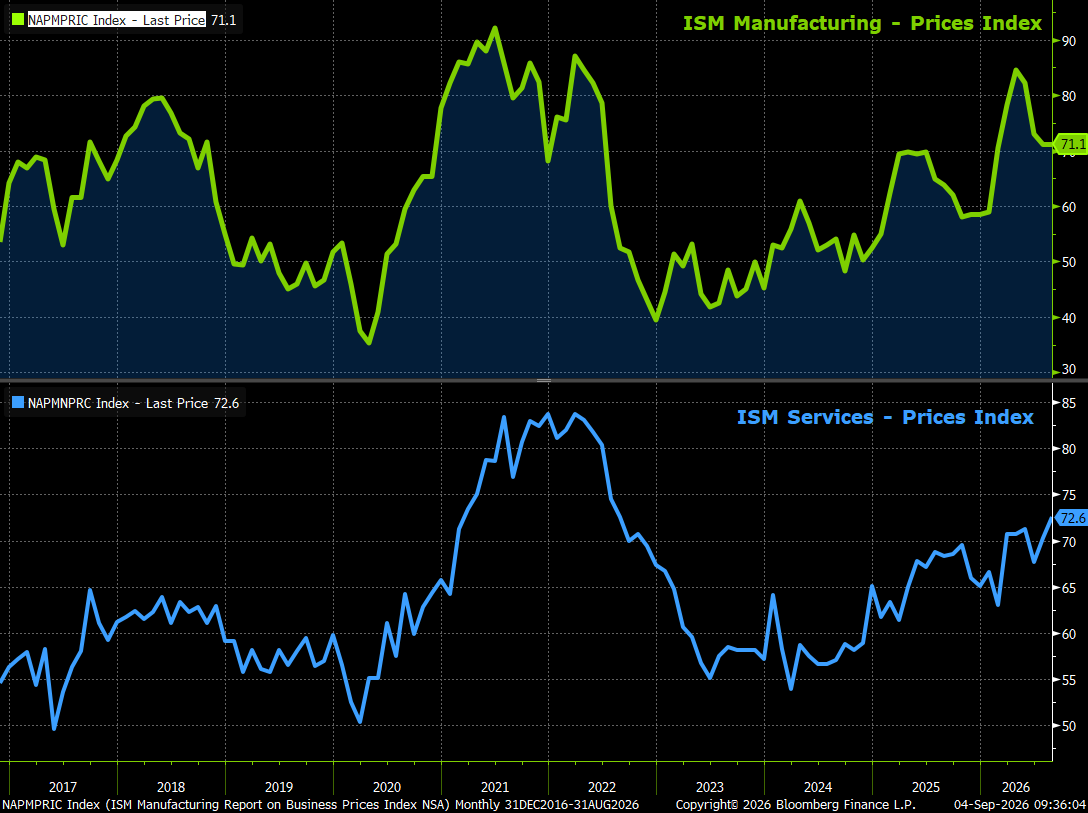
The economic environment we’re in was neatly captured in a couple of ISM PMI reports for August (indices created from surveys of purchasing managers across the manufacturing and services industries). The headline numbers were strong, with the Manufacturing PMI at 54.6 and the Services PMI at 55.4. A reading over 50 says the sector is expanding, and right now we’re well above that. But I want to highlight a few data points within these reports, namely the production/activity and prices sub-indices.

Stay on Top of Market Trends
The Carson Investment Research newsletter offers up-to-date market news, analysis and insights. Subscribe today!
"*" indicates required fields
The production sub-index within the manufacturing PMI came in at 58.3, while the business activity sub-index within the services PMI clocked in at 61.7. This suggests activity is running strong across the economy. The level and upward momentum are the strongest we’ve seen in over five years, and even better than in 2019 (especially on the manufacturing side).
The bad news is that inflation remains hot, with purchasing managers seeing no letup in prices of raw materials and other inputs. A reading above 50 points to rising prices, and we’re way above that.
- The manufacturing prices index has eased since April thanks to easing gasoline prices, but it’s still at a very elevated level of 71.1
- The services prices index continues to ratchet higher, hitting 72.6 in August – the highest level since August 2022 and well above anything we saw in 2017-2019
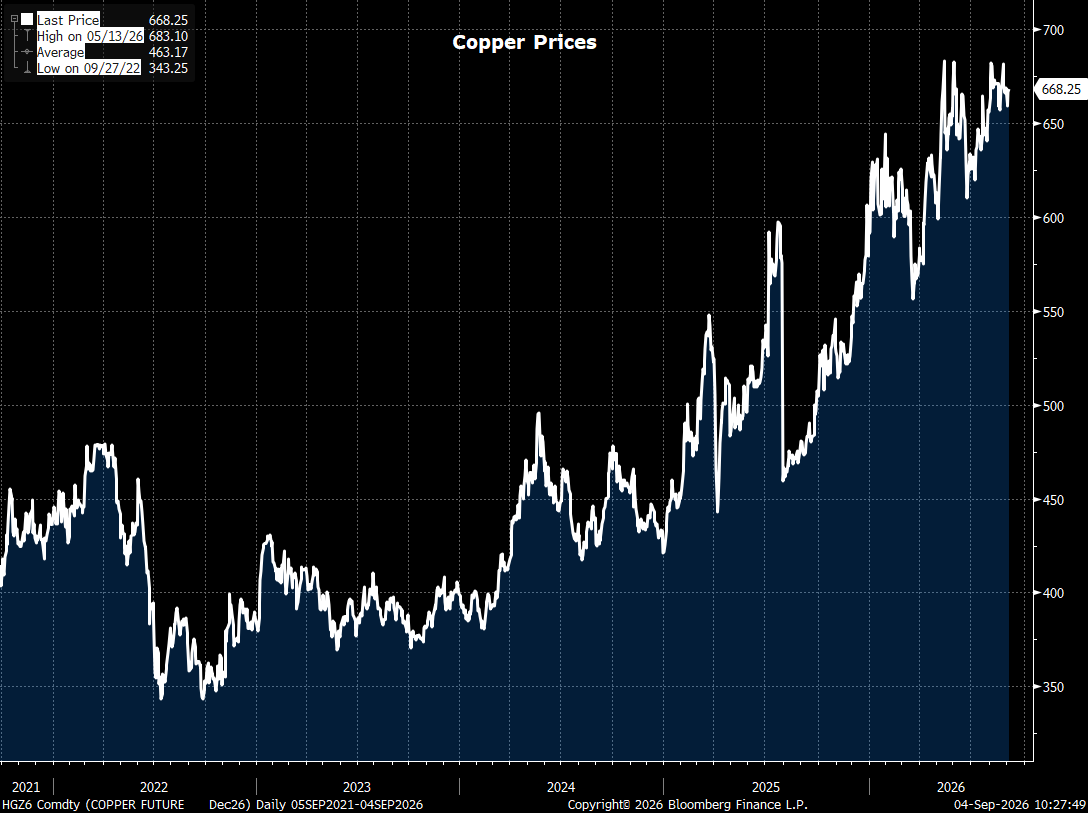
Prices are rising because several key inputs are in short supply, including copper, electrical and electronic components, memory components, printed circuit boards, and even wires and cables and steel. Copper prices have surged more than 40% over the past year (+13% year-to-date) and are at the highest level we’ve seen in years.
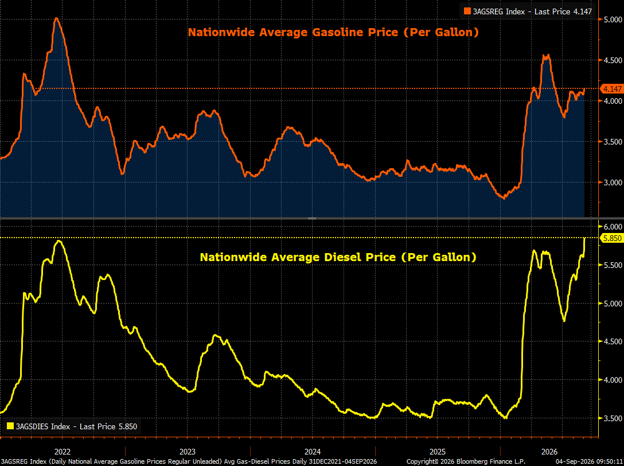
The story is about bottlenecks arising from the AI-infrastructure boom and the trade war. This is on top of the fact that the Middle East crisis shows no sign of abating, and that’s keeping oil prices elevated. The Strait of Hormuz bottleneck is a bigger problem for refined products, and Ukraine’s targeting of Russian refineries only adds to price pressure. Diesel prices just hit a record high of $5.85/gallon (even higher than in 2022) – keep in mind that diesel is the fuel that transports all sorts of goods across the country (and the globe), including food. Gasoline prices are also at the highest level ever for this time of the year, with the nationwide average at $4.15/gallon.
Keep in mind that the companies selling all these inputs benefit, as their margins rise when prices go up (whether it’s chip companies, energy companies, or mining firms). This is why an inflationary growth period can be good for stocks. It’s important not to confuse this with “stagflation”, which is a period of high inflation and rising unemployment. The latter is clearly not the case right now.
Of course, the big question is what the Fed does now, given all this data. I believe they are clearly offside relative to where the economy is. Yet markets perceive the Fed as extremely reluctant to hike interest rates, with the bar for hiking much higher than the bar for cutting rates. It beggars belief that the probability of a rate hike at the Fed’s September meeting is still just over 60%, i.e., much closer to a coin toss rather than 100%. As I wrote in my prior blog, keeping rates unchanged means policy is getting easier, and right now, even a 0.25-0.5% increase in policy rates may not be enough to cool things down.
For now, it looks like policymakers are willing to let things run hot. But that also means that if and when they start raising rates, they’ll have to tighten policy even more (and leave it tight for longer) just to catch up, and that’s a recipe for more volatility.
For more content by Sonu Varghese, Chief Macro Strategist, click here.
9112741.1. – 4SEPT26A