
Welcome to Carson Investment Research’s Earnings Check-In for the week ending August 7, 2026. This series is built weekly from FactSet’s Earnings Insight report (John Butters, VP, Senior Earnings Analyst with FactSet), with index weights and market caps sourced from YCharts, and aggregation performed in-house. We tie every figure to FactSet’s published numbers, then add Carson’s perspective on top of that. We publish our Earnings Check-In weekly during earnings season.
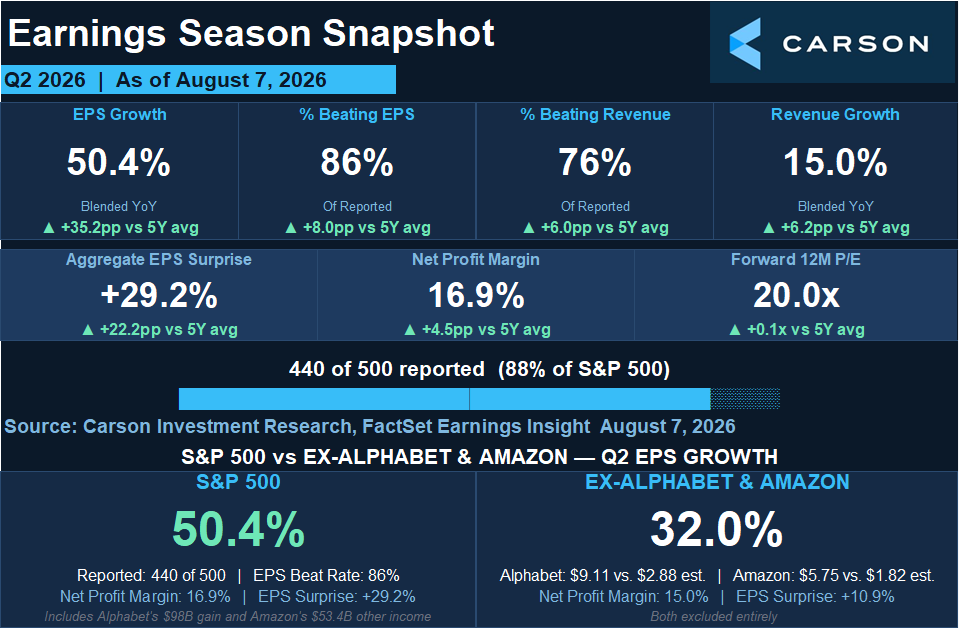
We’re at 88% reported now of the S&P 500. Blended Q2 earnings growth sits at 50.4%, up from 47.4% a week ago and 23.1% back at the end of June. Only nine companies are scheduled to report next week, so for all practical purposes this season is finished, minus the biggest company in the world in a few weeks.
A month ago, when we were about 61% of the way through, the useful question was how big the quarter was going to end up being. We’ve gotten better clarity to the answer of that question over the last two weeks. And the question investors (and me) may be asking now is how much of this quarter we actually get to keep.
I ask because a quarter like this one is really two quarters stacked on top of each other. Part of what happened in Q2 is the kind of thing that shows up again next quarter and the quarter after that. Another part happened once, for reasons unlikely to repeat, and will make the year-over-year math harder a few quarters from now.
What Changed This Week
Before I start pulling anything apart, it’s worth saying that nothing in this week’s report got worse.
86% of companies that have reported beat their EPS estimate, against a five-year average of 78%. If that holds, it will be the highest share since Q2 2021. In aggregate, those companies beat by 29.2%, which is actually down from 31.4% last week, though only because the pool of reporters nearly doubled and diluted the two enormous surprises that were driving it. Net profit margin came in at 16.9%, above the 14.8% record set just last quarter. The forward 12-month P/E ticked up to 20.0 from 19.6, still a bit below the 20.4 the index carried on June 30.
The work this week is in sorting, and the sensible place to start is with the line item that’s hardest to manufacture: Revenue.
Revenue Finally Showed Up
Blended revenue growth is 15.0%, the fastest the index has managed since Q4 2021.
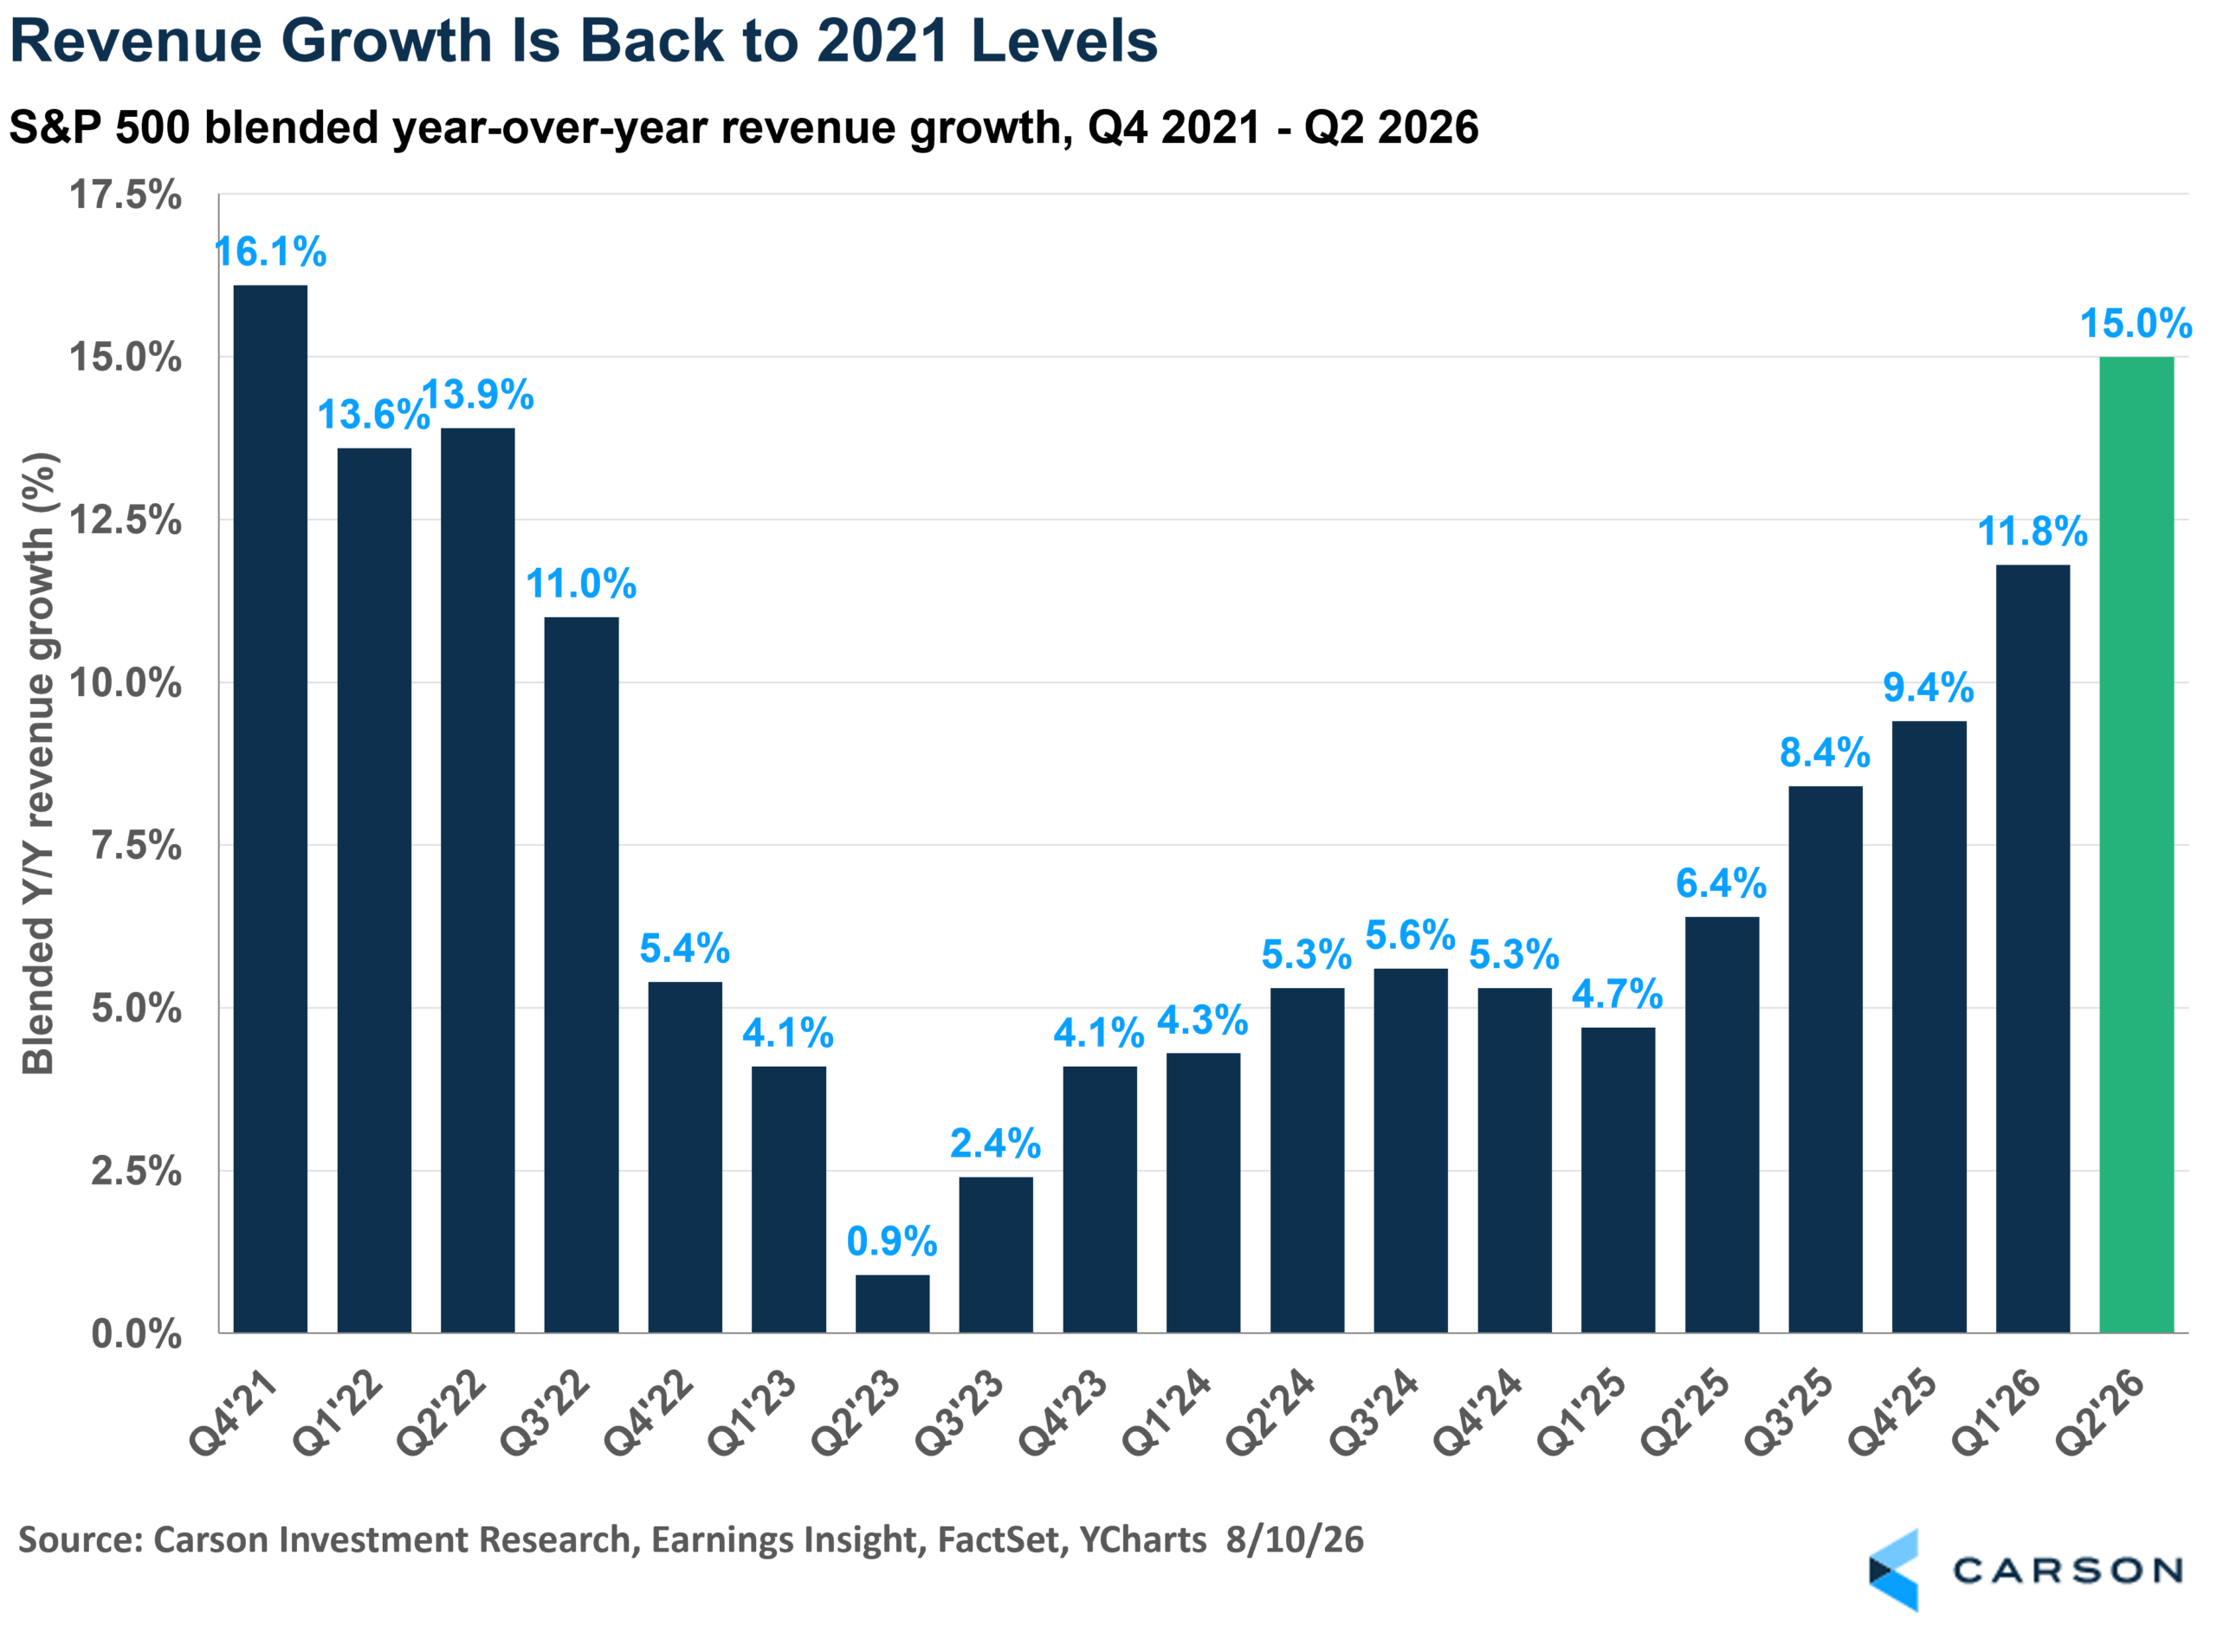
I want to start here rather than with earnings because revenue is the most stubborn number in the whole report. Earnings can be moved around by a mark on an investment portfolio, a one-time charge, a share buyback, or an accounting treatment that only applies once. Revenue mostly has to be earned from a customer. And this figure has been climbing steadily all quarter rather than jumping on any single report. Analysts had it at 9.5% back on March 31, then 12.2% on June 30, and now 15.0%. It’s also the second consecutive quarter of double-digit revenue growth for the index, which hasn’t happened since the post-pandemic reopening.
If anything in this report is going to survive contact with next year, it ought to be this. Which makes it worth asking where it came from before we get too comfortable.
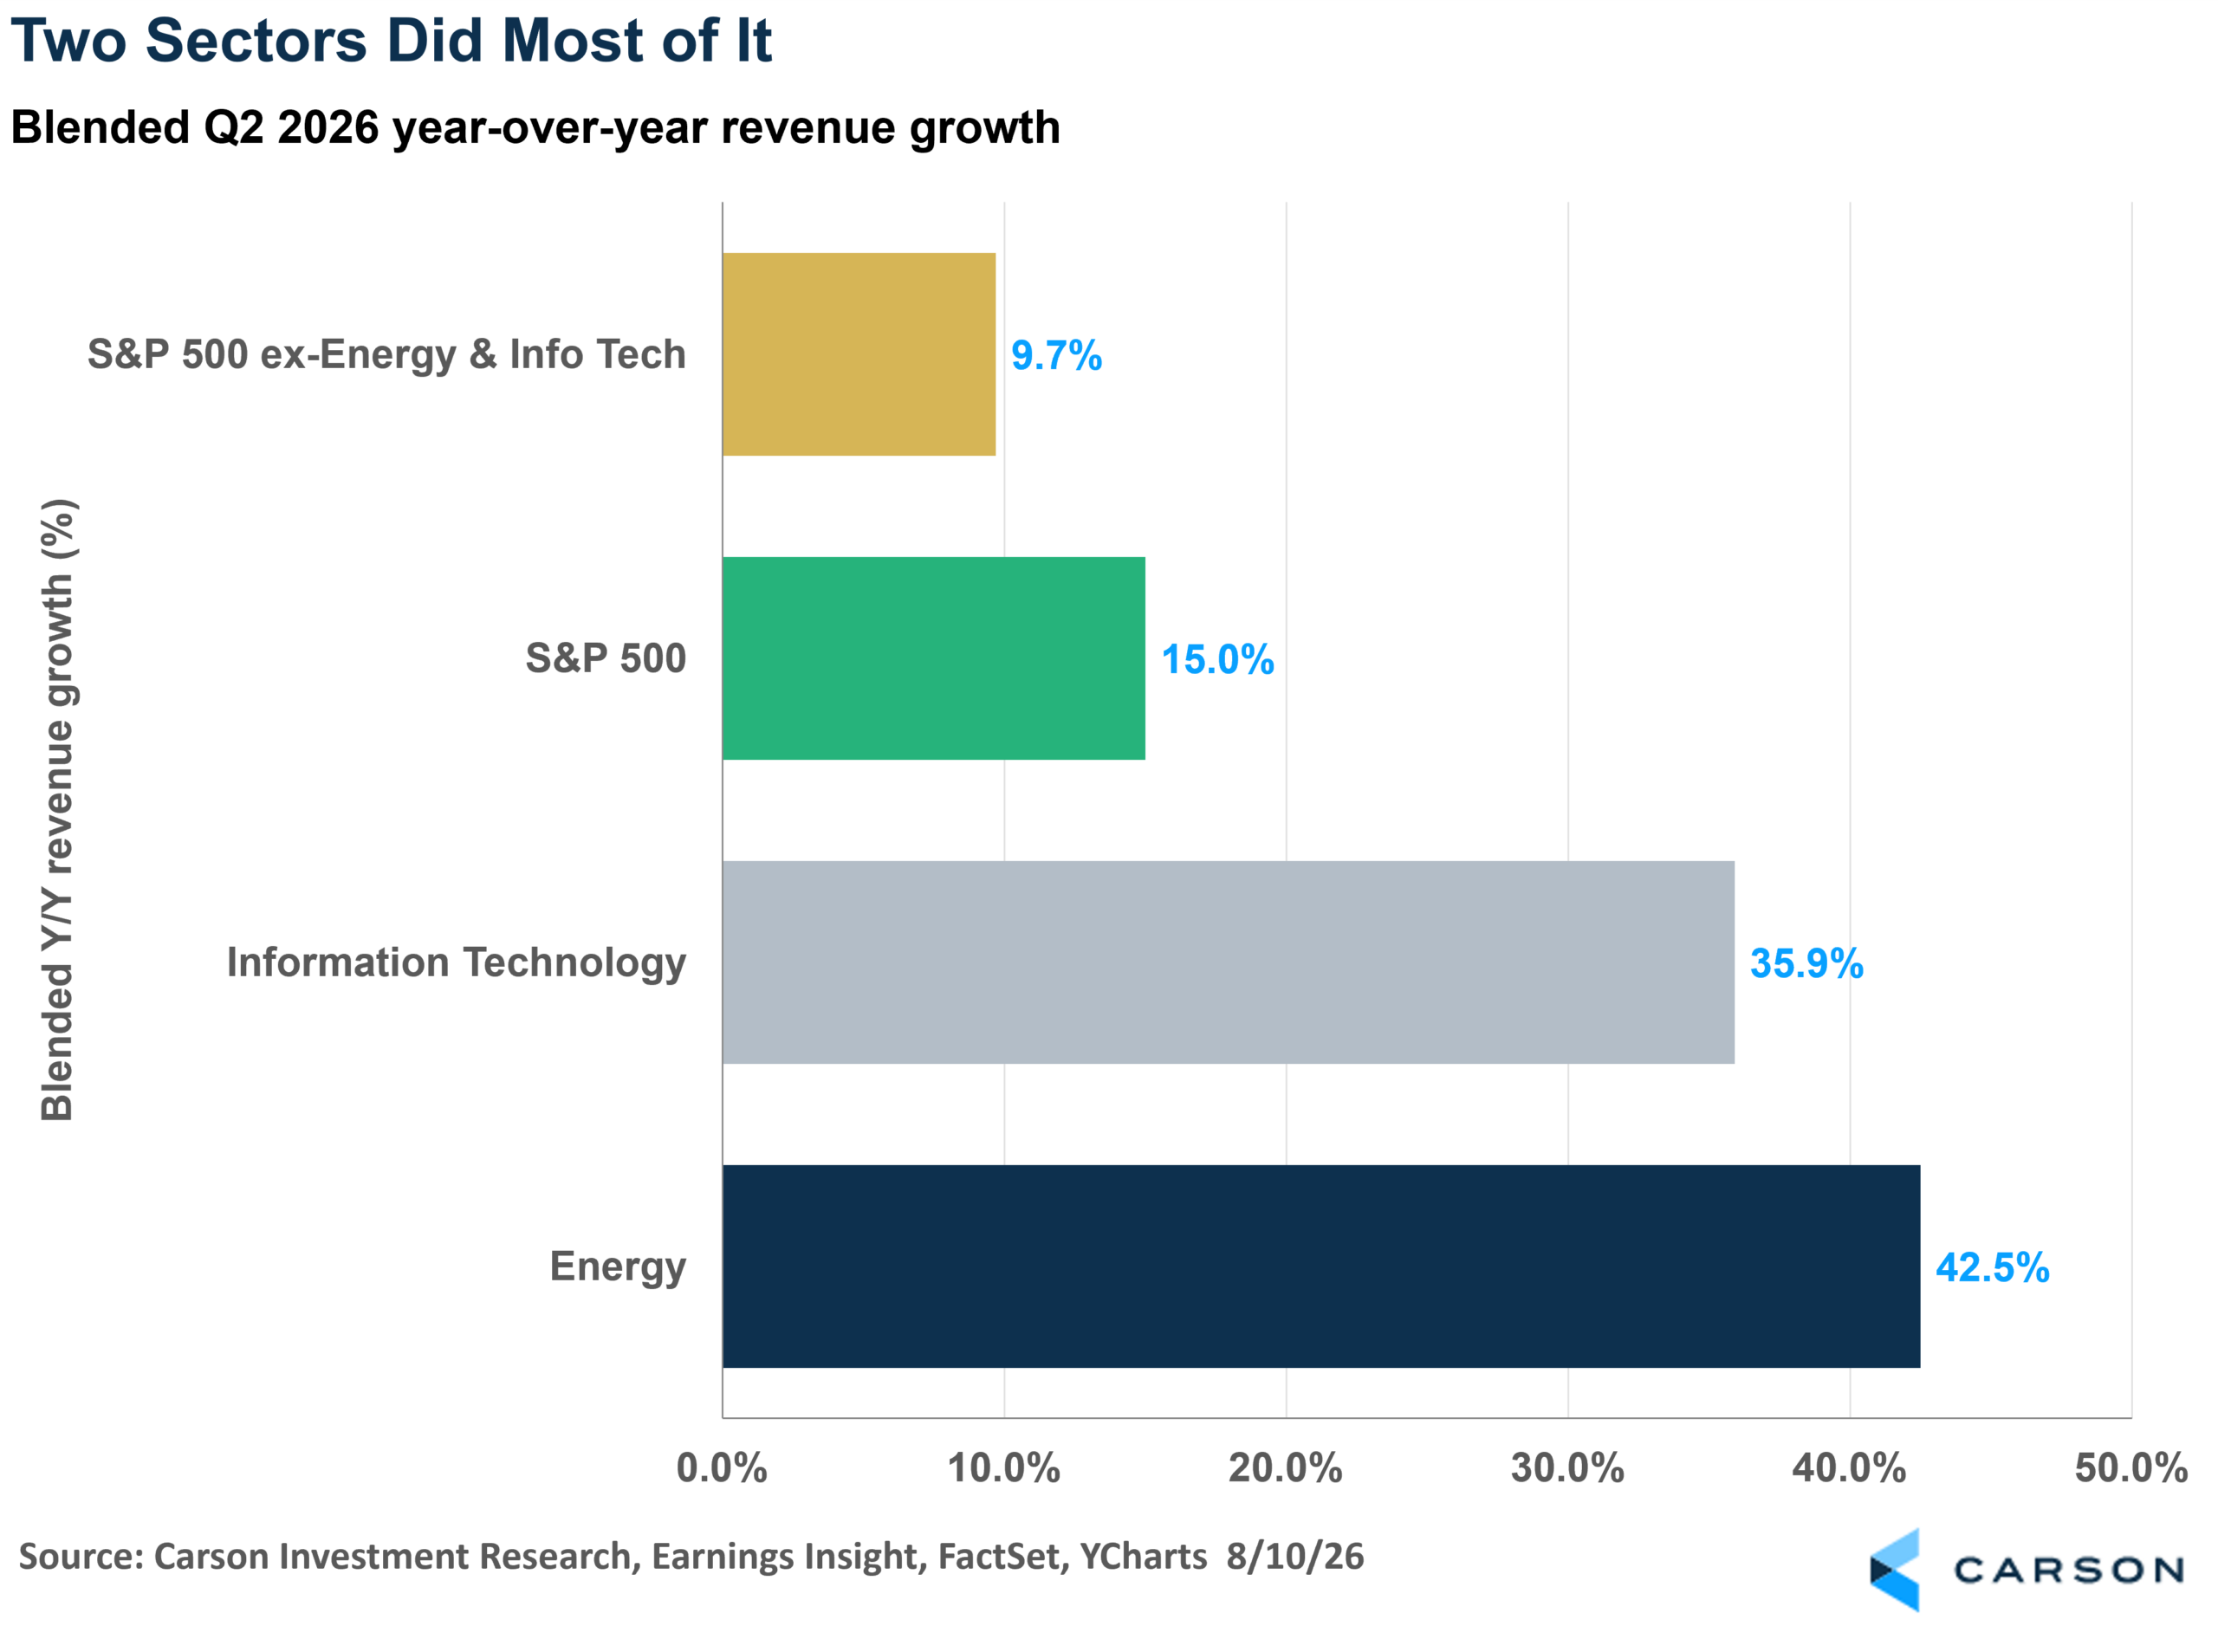
Energy grew revenue 42.5%, and Information Technology grew 35.9%. Pull those two sectors out, and the other nine grew 9.7%.
I also don’t want to wave off 9.7%, because that’s a perfectly healthy number in most quarters and it would have been the story in any of the last three years. But the two sectors sitting on top of it aren’t running the same kind of business. Semiconductor revenue grew 77% this quarter because those companies are shipping more product into demand they still can’t fully meet. Energy is largely selling the same barrels at a much higher price. Both show up identically in a revenue growth chart, and they behave very differently a year later.
One of Them Is a War Trade
Oil averaged $92.55 in Q2 2026 against $63.68 in the same quarter last year, roughly a 45% increase. That one input is what produced 147% earnings growth for the Energy sector and made it one of the two largest contributors to revenue growth for the entire index. It’s a price that came out of the Strait of Hormuz rather than out of demand, and it’s worth remembering that it only started climbing at the end of February.
The Financial Times reported this week that crude has traded back below $90 as Washington and Tehran show signs of winding the conflict down, which is good news for almost everybody in the economy. It just isn’t good news for this particular comparison.
You don’t have to take my read on how that fades, because analysts have already published theirs.
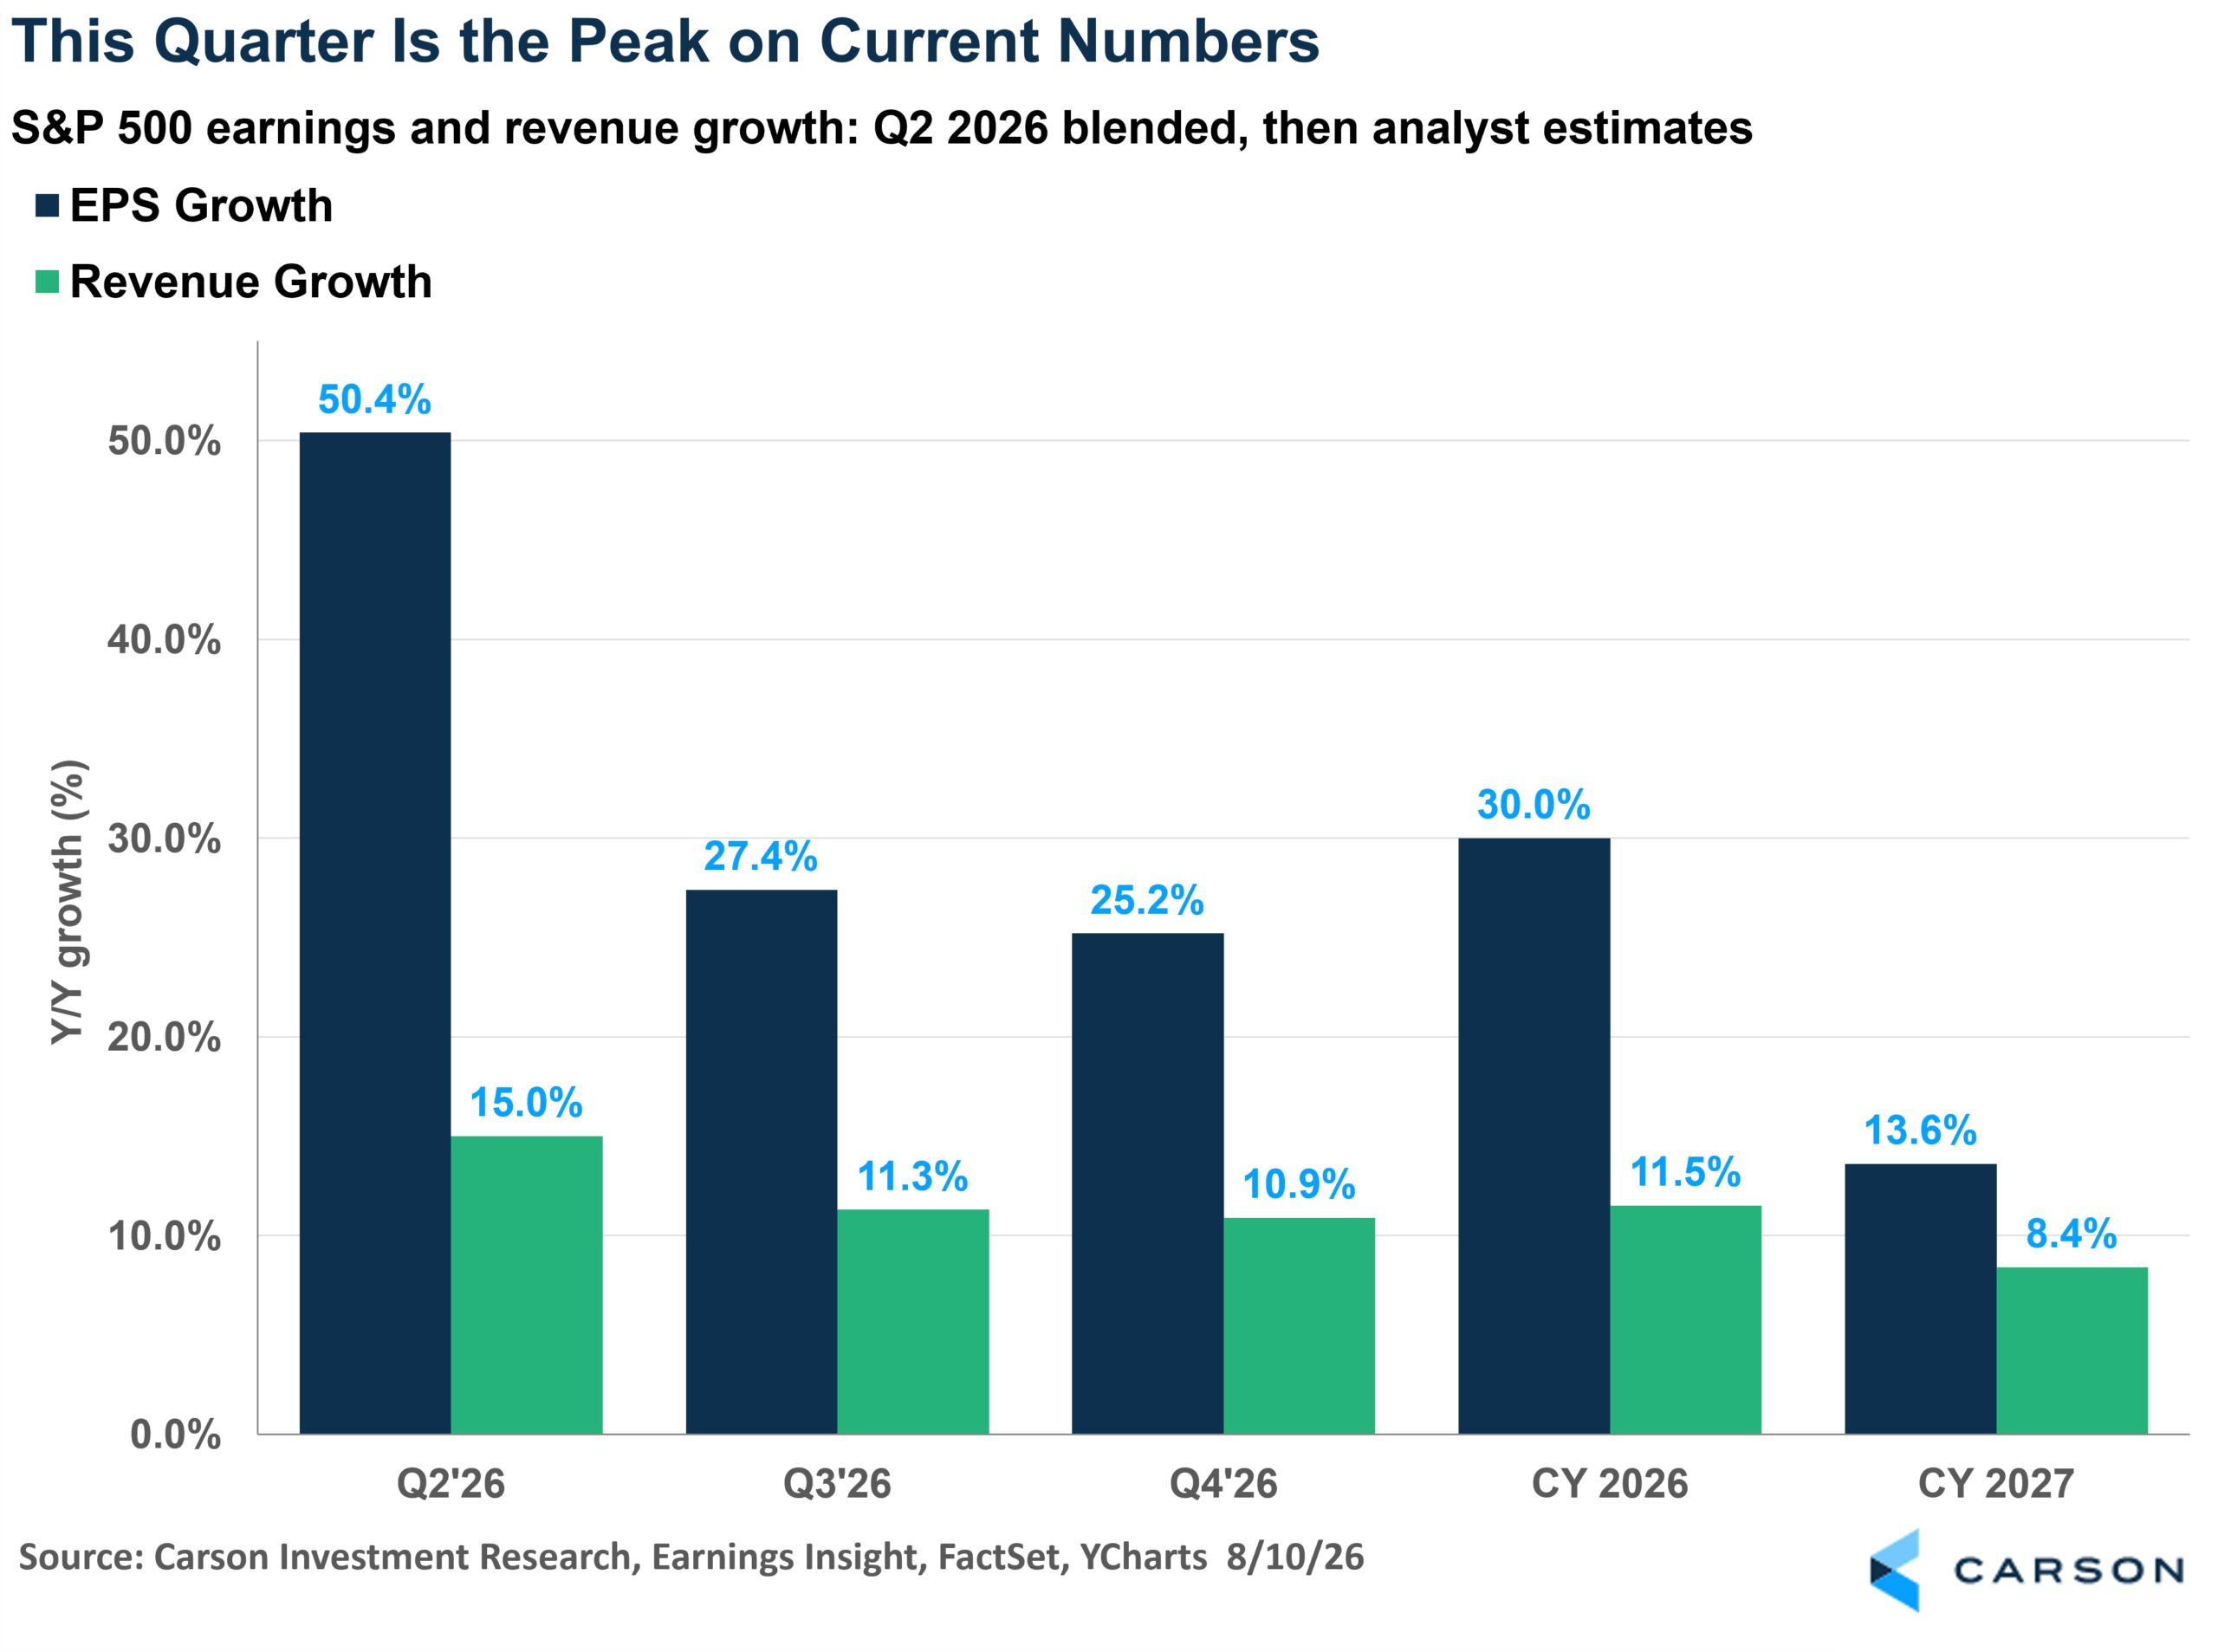
Energy’s Q3 earnings growth estimate is 94.3%, already well off the 147% it just delivered. Consumer Discretionary falls from 91.6% this quarter to 3.6% next quarter, which is what happens when Amazon’s investment gain stops repeating (read more about that here). Then you get to 2027, where analysts currently model Energy earnings falling 11.4% and Communication Services falling 10.3%. The two sectors doing the most work in 2026 are the same two that analysts expect to shrink the most the year afterward.
That looks pessimistic until you read it next to what those same analysts have been doing to this year’s number, which is where things get interesting.
They Keep Raising 2026 Anyway
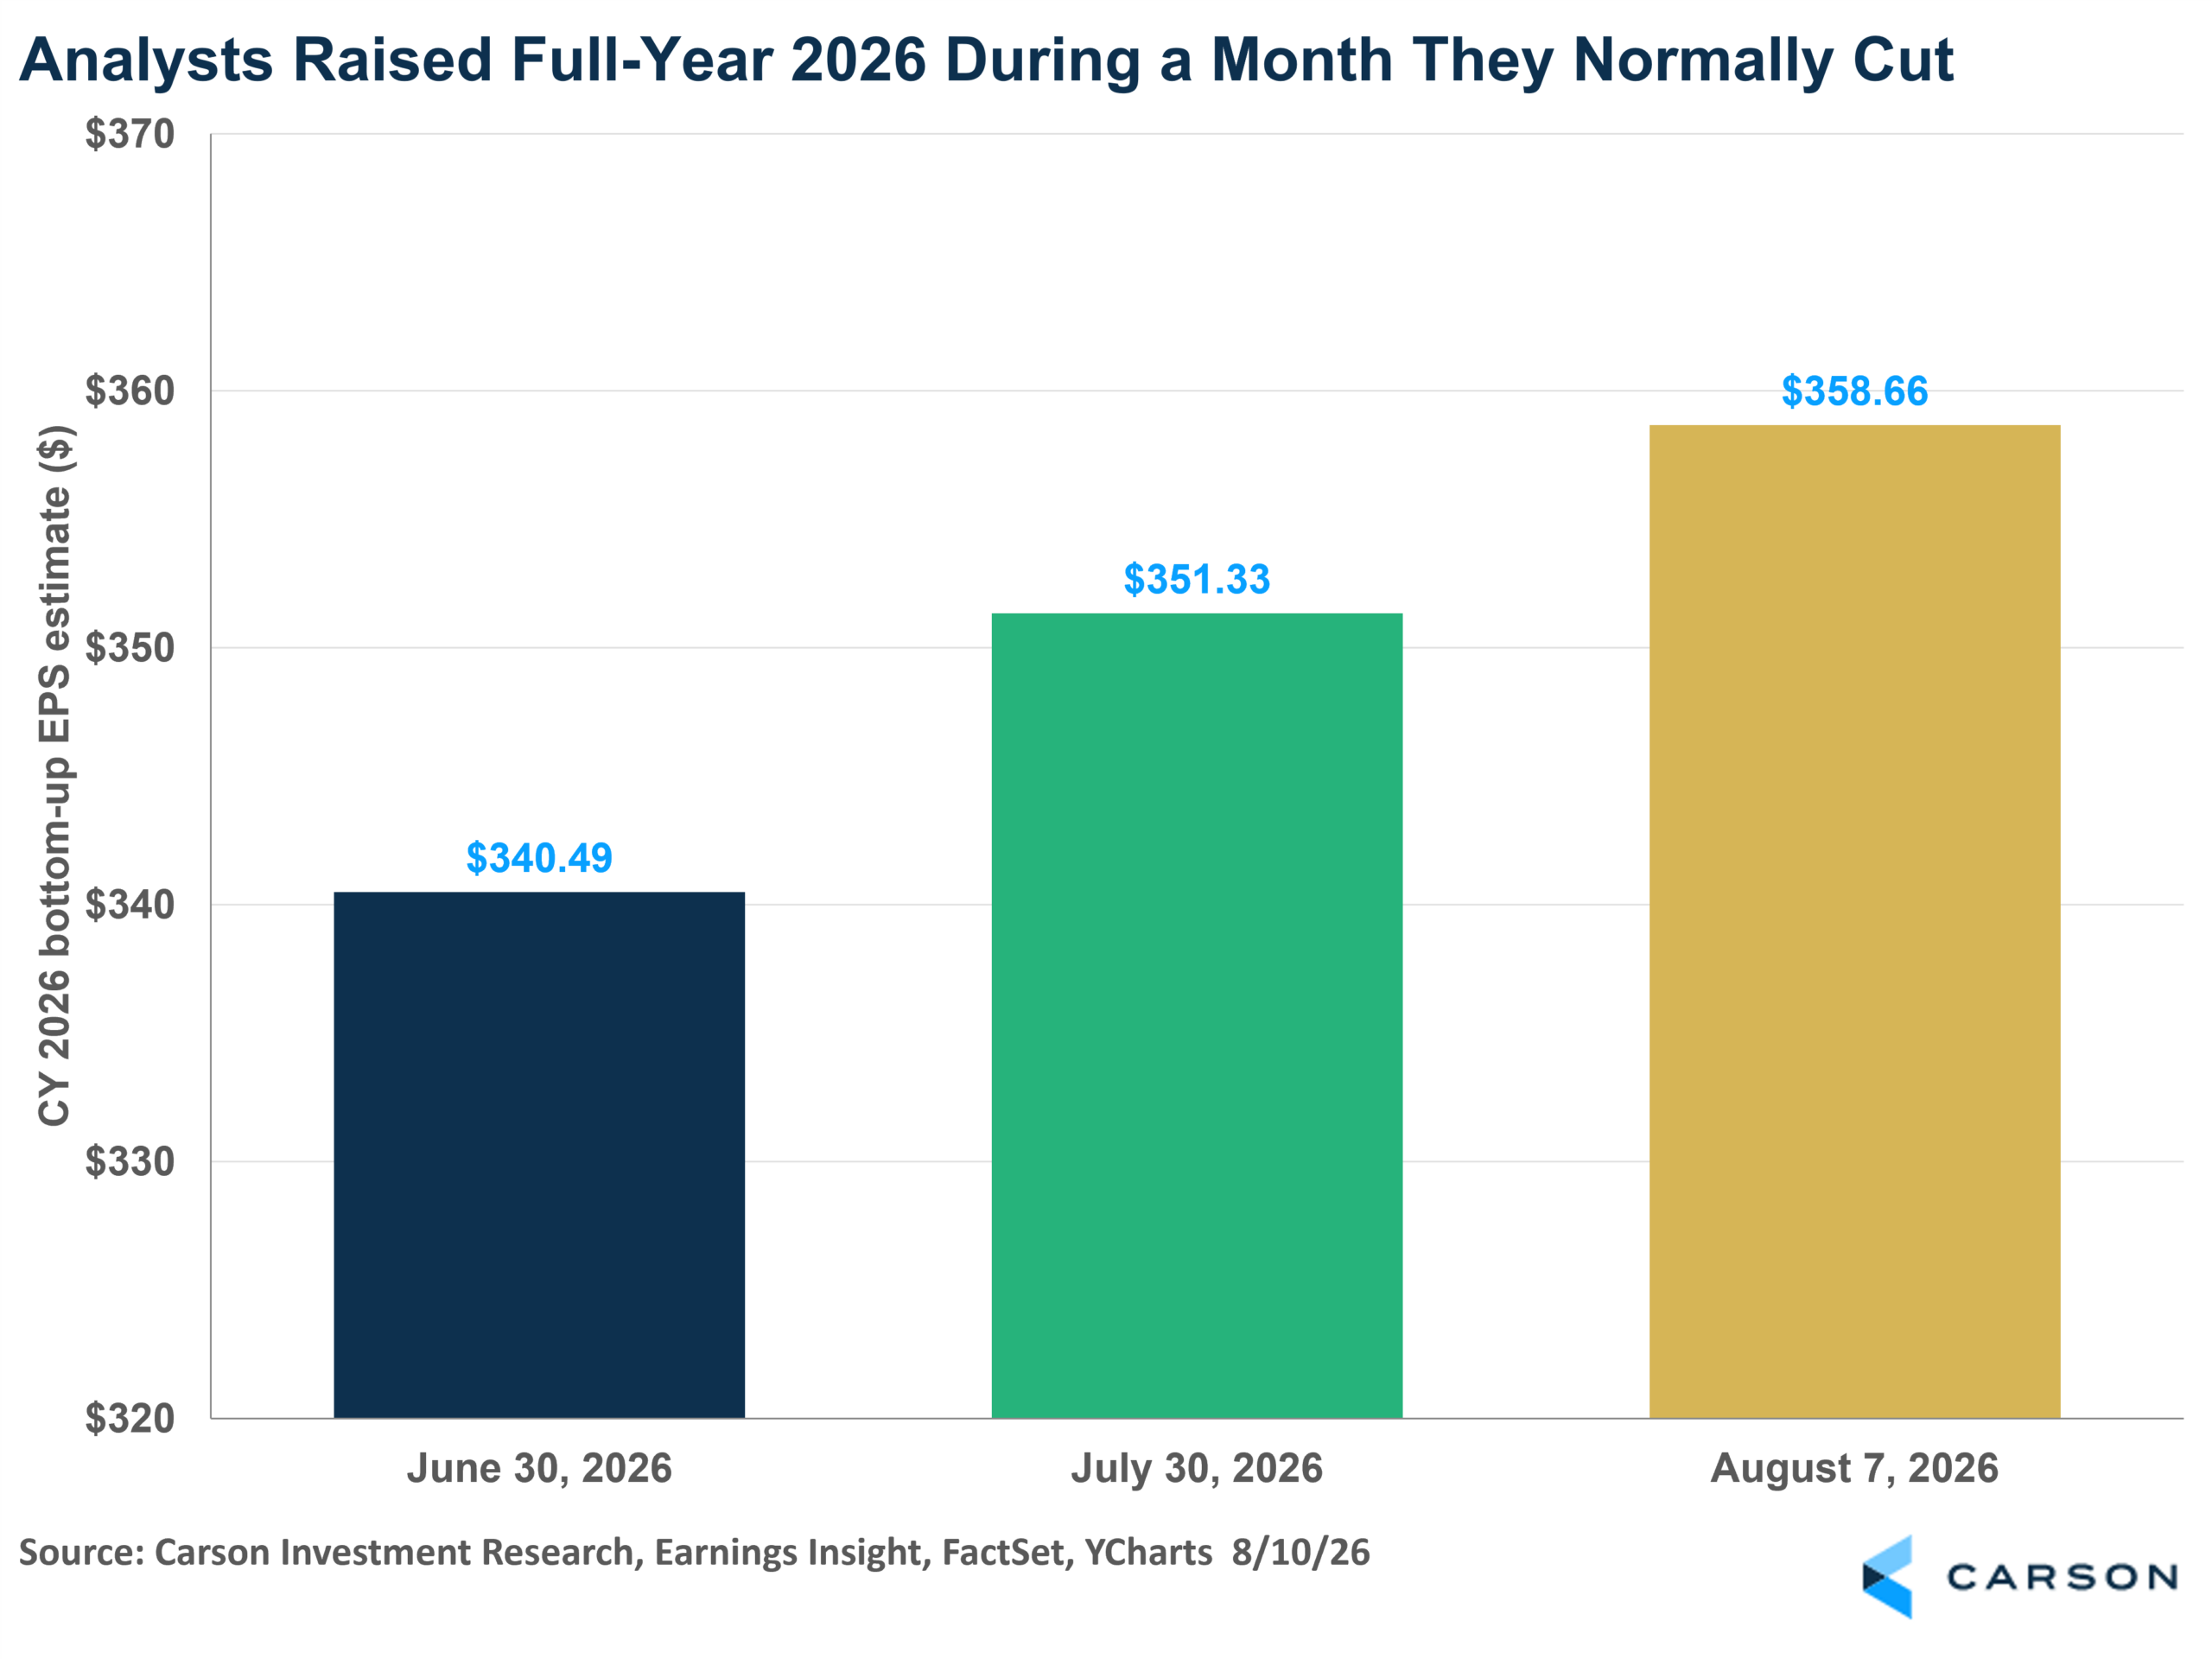
The bottom-up EPS estimate for calendar 2026 stood at $340.49 on June 30. By July 30, it was $351.33. Today it’s $358.66. That’s a 5.3% raise over about five weeks.
Analysts almost always trim their estimates during the first month of a quarter, and FactSet’s own five-year average for that period is a decline of 1.0%. Instead, we got a 3.2% increase, and Butters noted in a separate piece last week that this is now the second consecutive quarter and the fourth of the last five where estimates went up rather than down. FactSet’s full-year 2026 growth estimate has moved from 23.9% on June 30 to 30.0% today.

Stay on Top of Market Trends
The Carson Investment Research newsletter offers up-to-date market news, analysis and insights. Subscribe today!
"*" indicates required fields
So, we have analysts marking this year up meaningfully while simultaneously marking next year down. I don’t think that’s a contradiction, and I’d resist reading it as one. What it looks like to me is a fairly specific view: that this year’s profits are real enough to put into the model, but that they represent a step up in the level of earnings rather than a new rate of growth. Higher base, same trajectory from here.
If that’s the right way to read it, then almost everything depends on whether the new level is sound. A level of earnings is really a question about margins, so that’s where we go next.
Still a Record
I’ve opened four consecutive posts with some version of “record quarter, but here’s the asterisk.” That framing has been fair every time, but not this time.
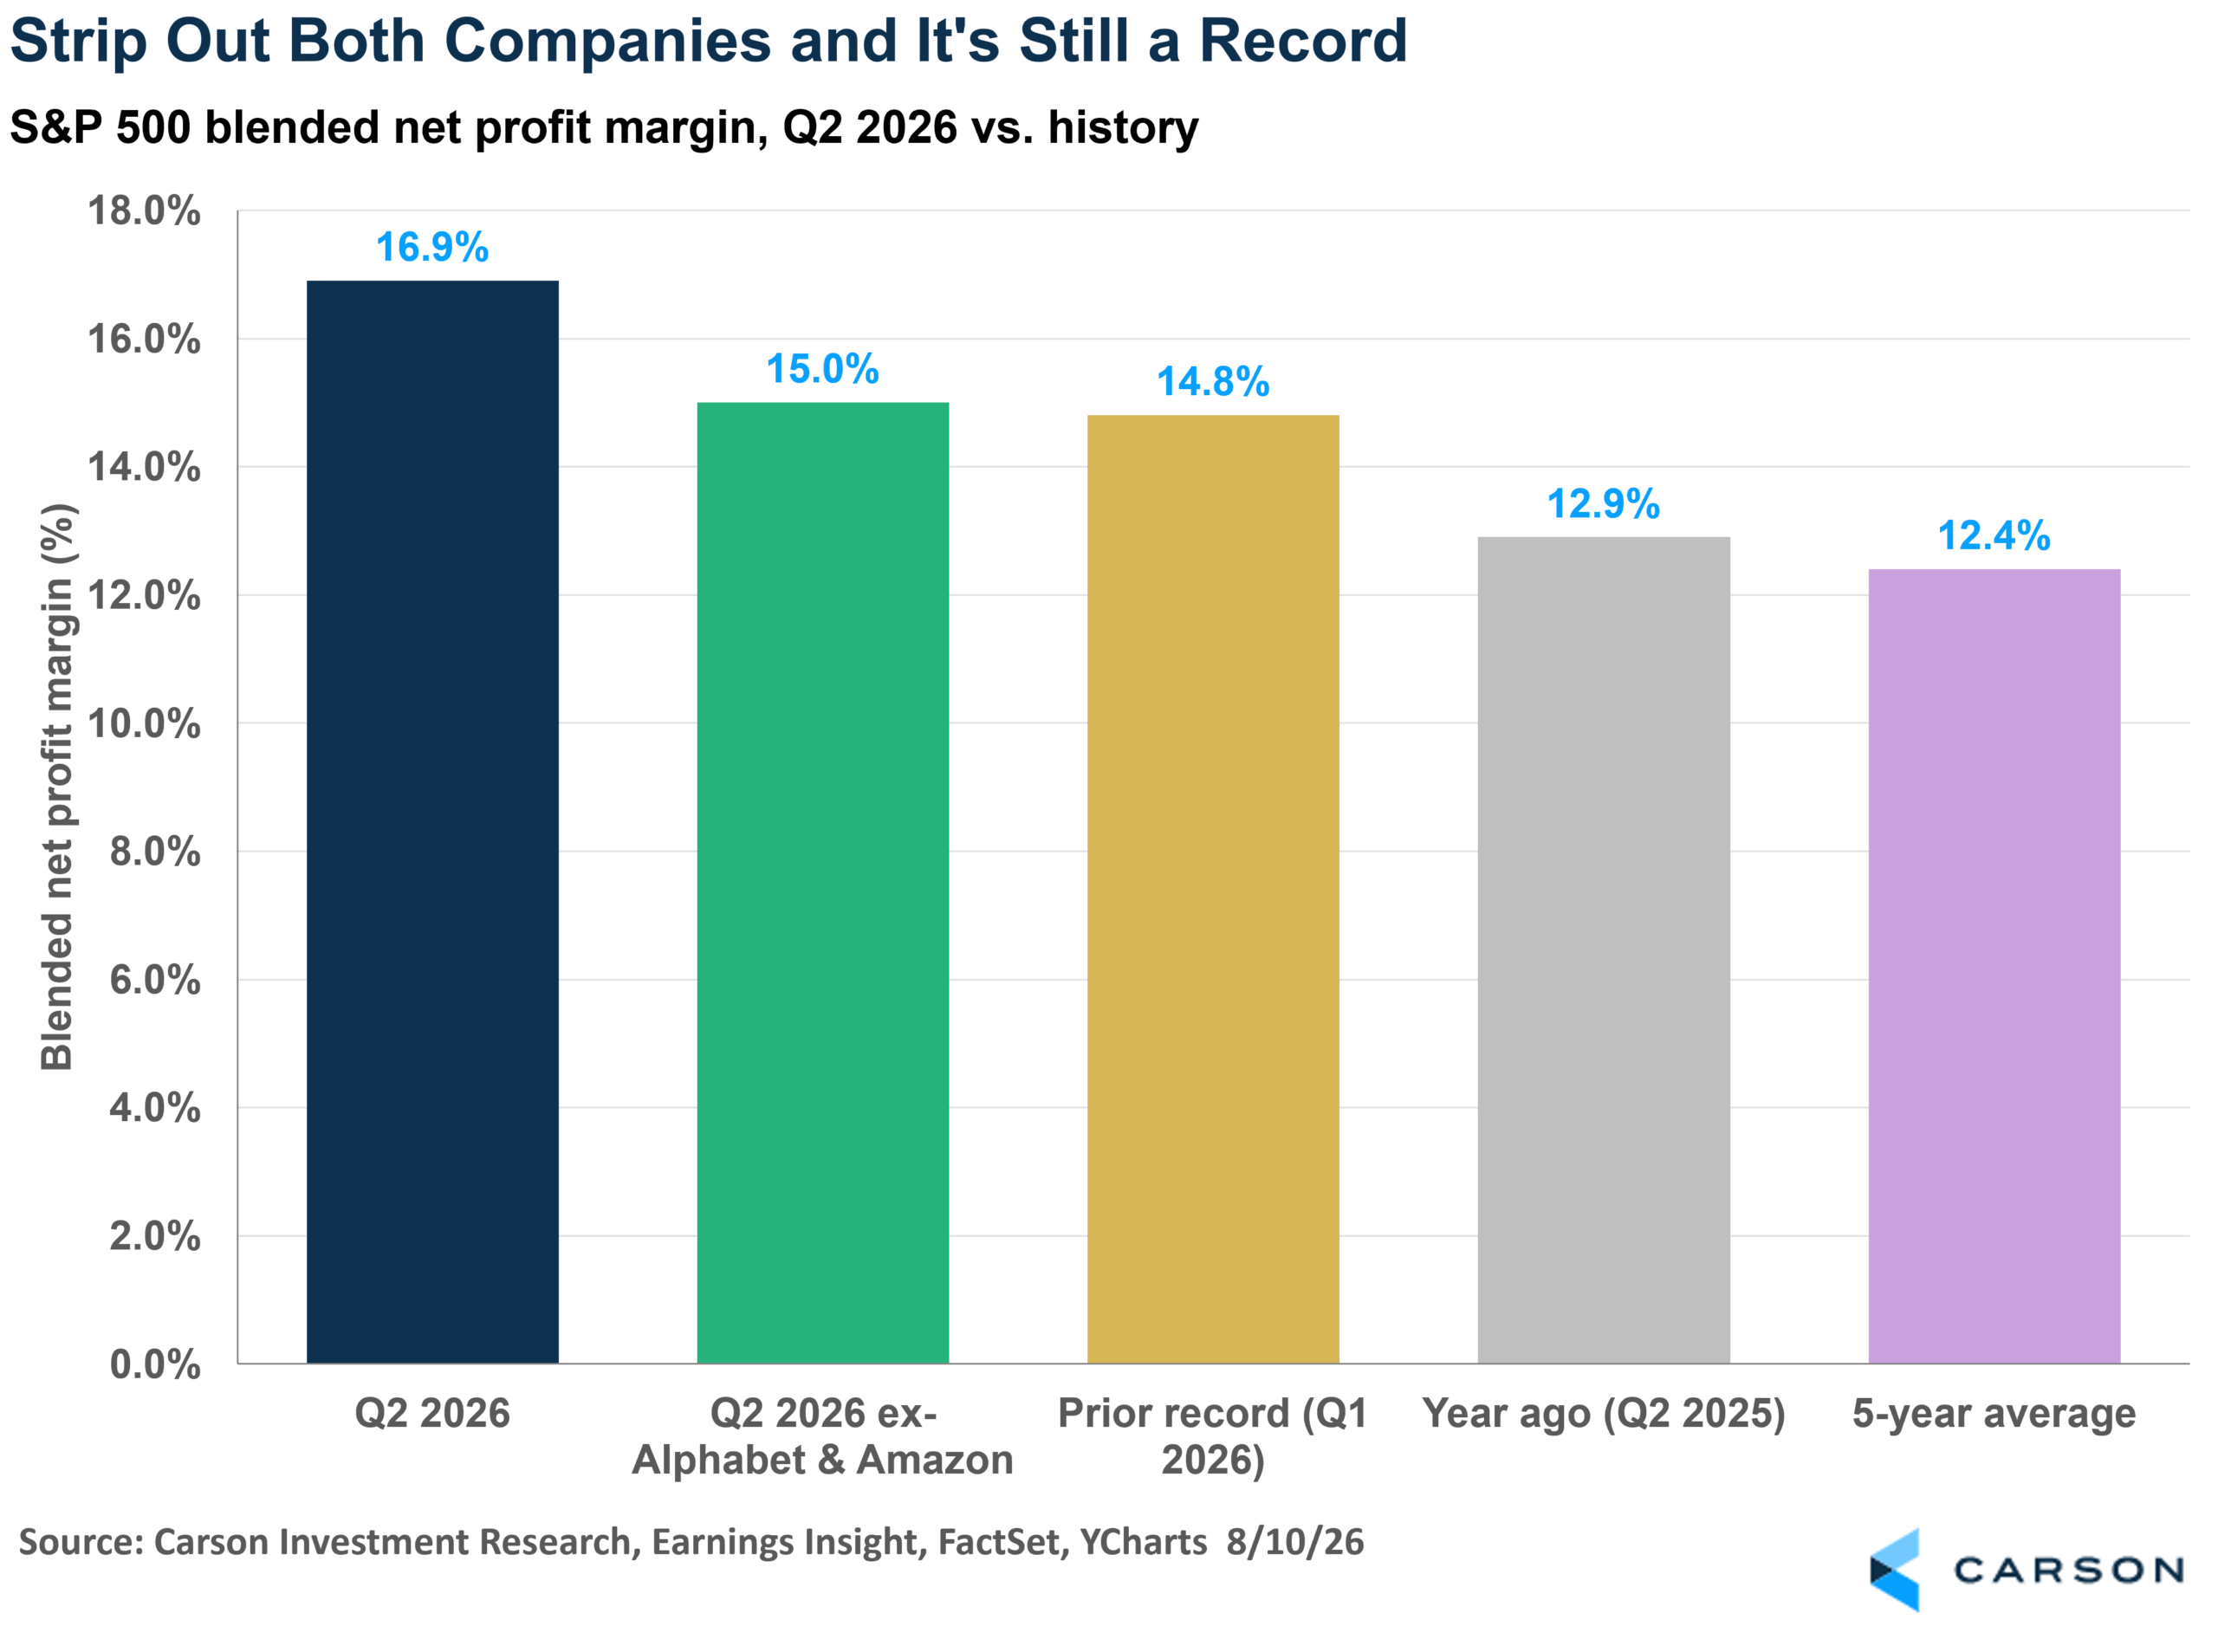
To get a more accurate result from this quarter’s reports which may help inform future margin trajectory, investors may find it useful to adjust out Amazon’s and Alphabet’s large one-time gain on equity investments by subtracting out non-core operating gains such as Alphabet’s $98 billion gain and Amazon’s $54 billion gain (which mostly came from a revaluation of equity stakes in Anthropic and SpaceX). The S&P 500’s net profit margin still comes to 15.0%, which remains the highest FactSet has recorded since it started tracking the metric back in 2009. The record simply does not depend on the two companies I’ve spent the last month writing about.
It also isn’t being carried by a handful of names.
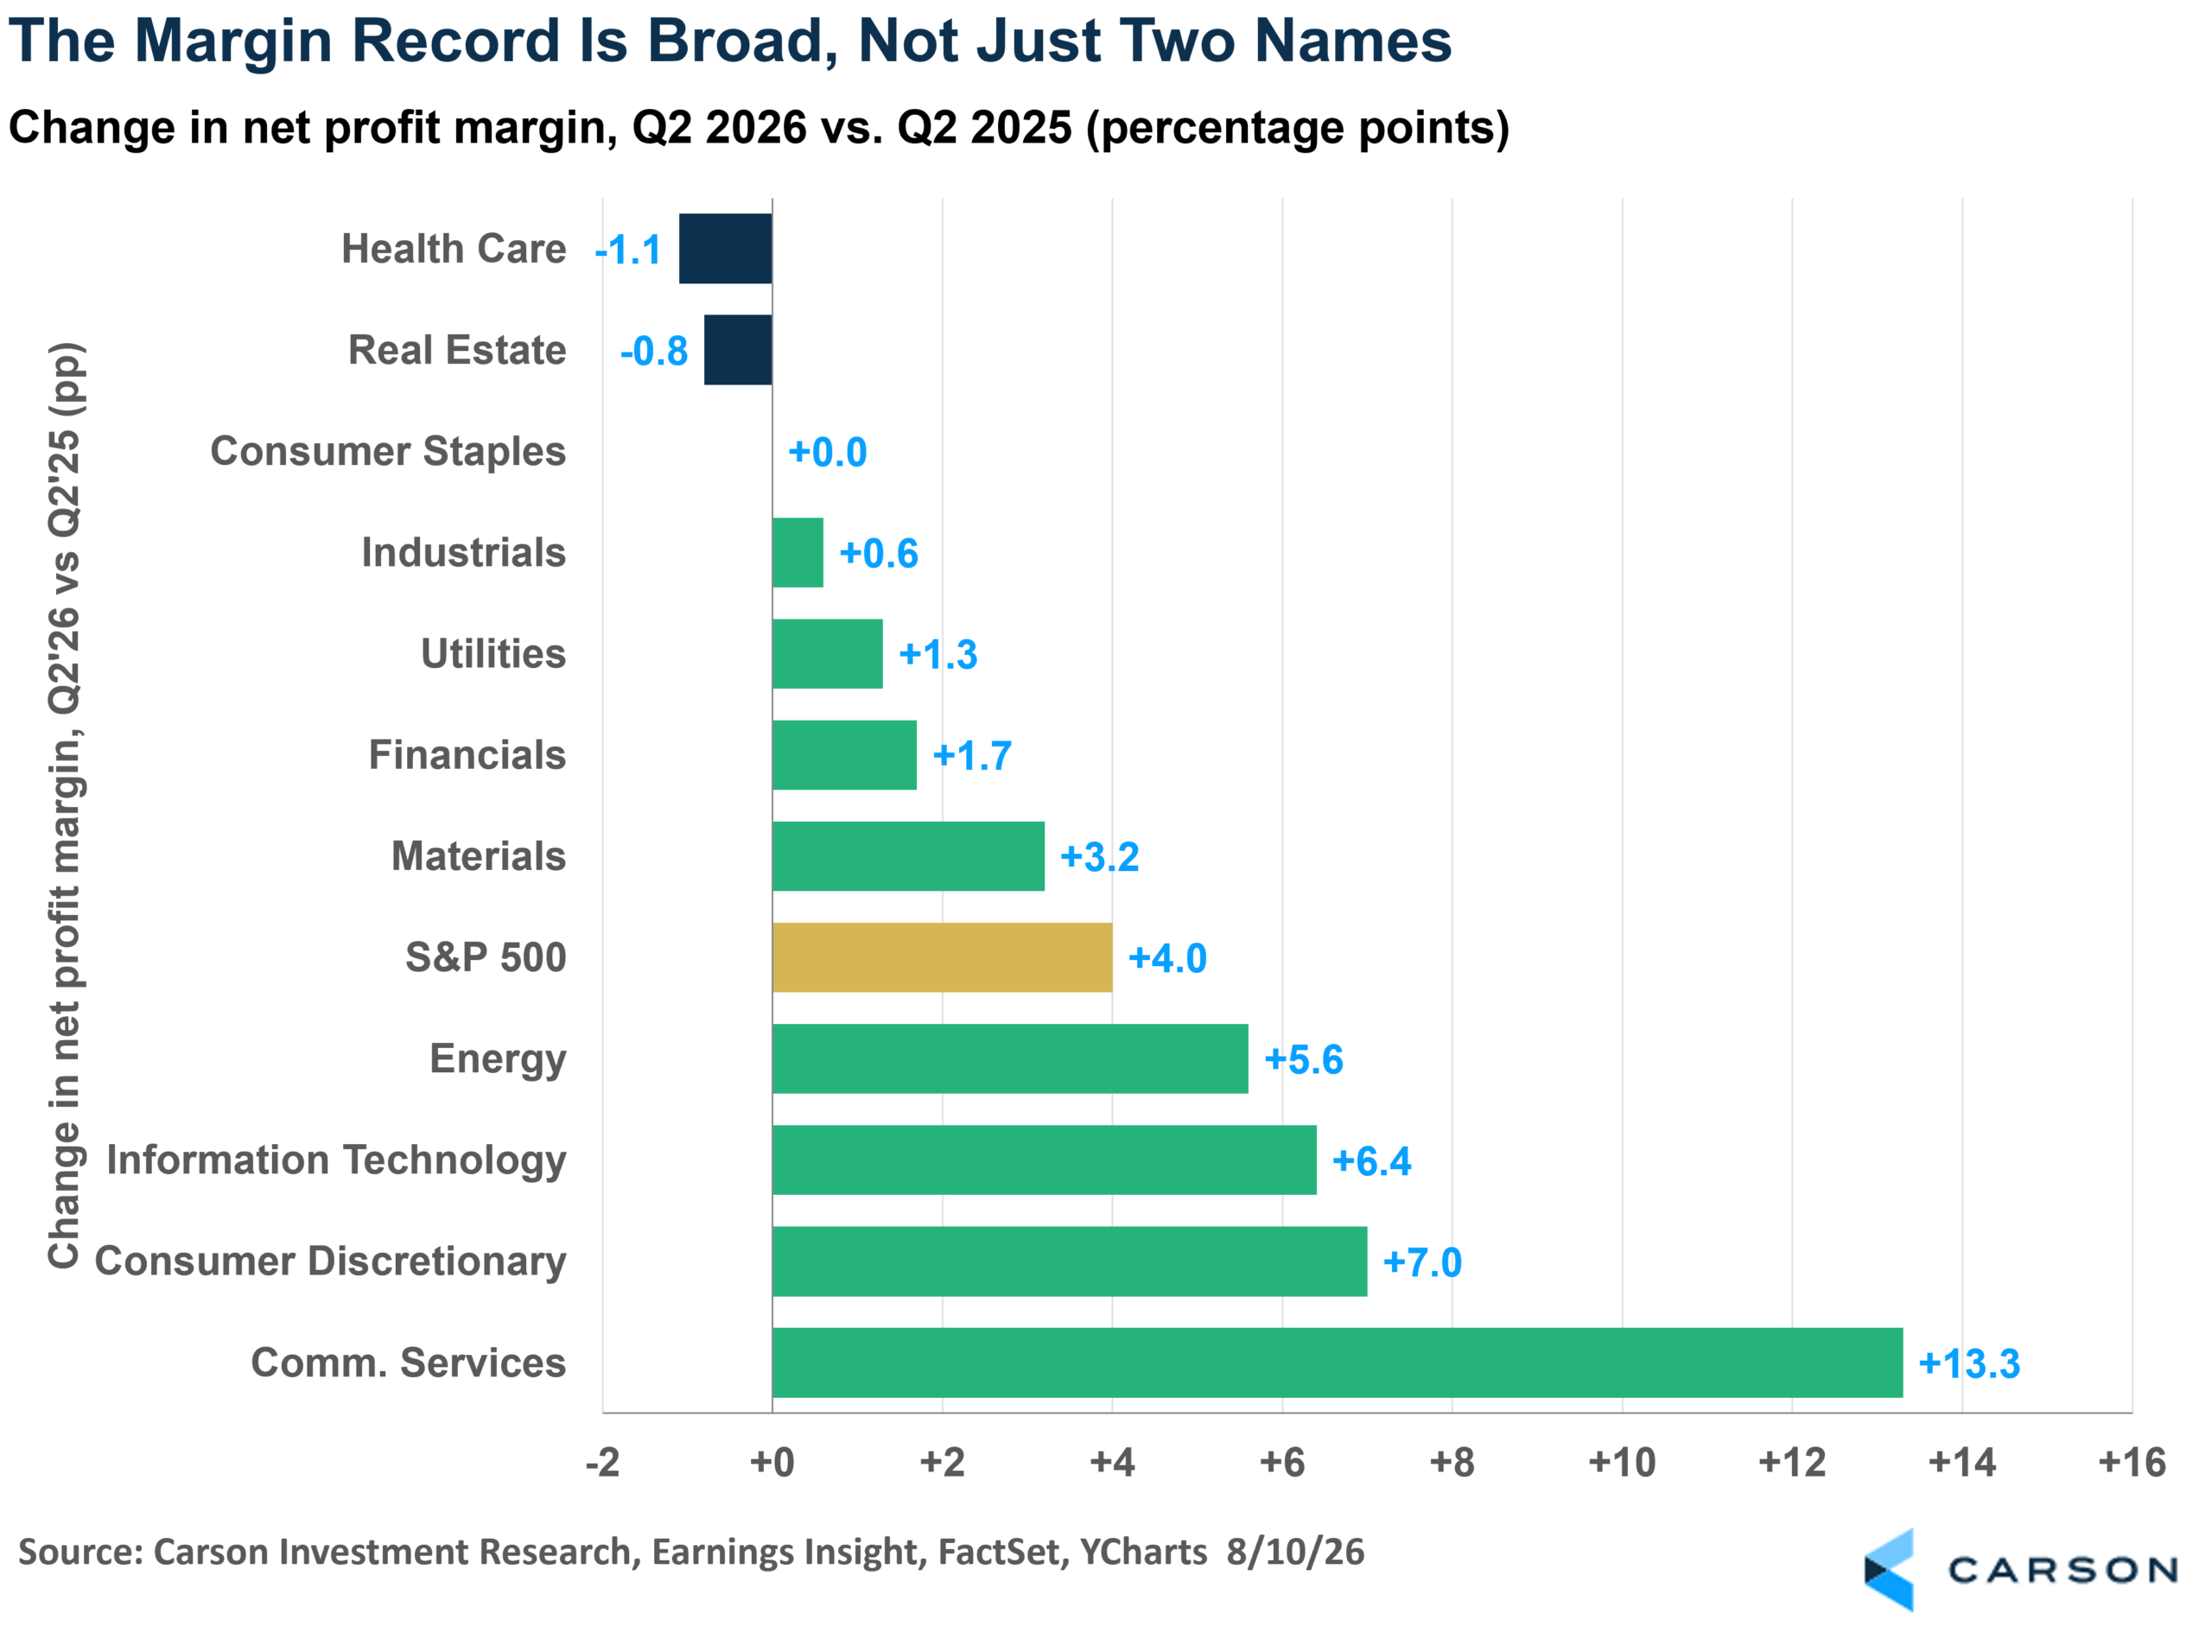
Eight of the eleven sectors expanded their margins compared with a year ago, and nine of eleven now sit above their own five-year average. Only health care and real estate went backward. That’s real breadth from what I can tell.
Which raises the obvious follow-up. If margins are the durable part, it’s worth understanding why they got there, because that might answer part of our question from earlier.
Where the Margin Came From
A margin is revenue minus costs, and for most companies the highest cost by a distance is people.
Sonu Varghese, Chief Macro Strategist, wrote on Friday that July payrolls came in at negative 23,000 against expectations for a solid gain, with May and June revised down by more than 100,000 between them. His read is that the weakness was concentrated in local government seasonality and a giveback in leisure and hospitality as the World Cup boost rolled off, and that with unemployment at 4.1% the labor market is still in reasonable shape overall.
I’d point to one more line in that same release. Average hourly earnings grew 3.2% over the trailing twelve months, the slowest pace since May 2021.
Revenue growing 15% while your single biggest cost grows 3.2% is most of a margin story right there, before you get to anything clever about pricing power or operating leverage. It’s also a fairly clean illustration of something worth keeping straight, which is that record corporate profitability and a strong economy are not the same statement. This quarter, they’re pointing in noticeably different directions.
There’s a second condition attached to the margin story that doesn’t come from the earnings data at all. Goldman Sachs went through the disclosures this season and counted roughly $1.5 trillion of lease commitments across the AI hyperscalers, of which about $1 trillion is tied to leases that haven’t actually started yet and therefore don’t appear in the financial statements. Morgan Stanley separately tallied another $982 billion of purchase commitments across five of those same companies. None of that is sitting in today’s margin. A good deal of it eventually will be.
So, the record holds as long as two things stay true. Labor has to stay this cheap, and the enormous capital buildout has to stay off the income statement. Both things are not guaranteed.
The Market Has Already Run This Test
Last week I made the point that the best earnings growth in five years had produced a completely flat July, but I was inferring that from a monthly return. This week, FactSet went and measured it directly.
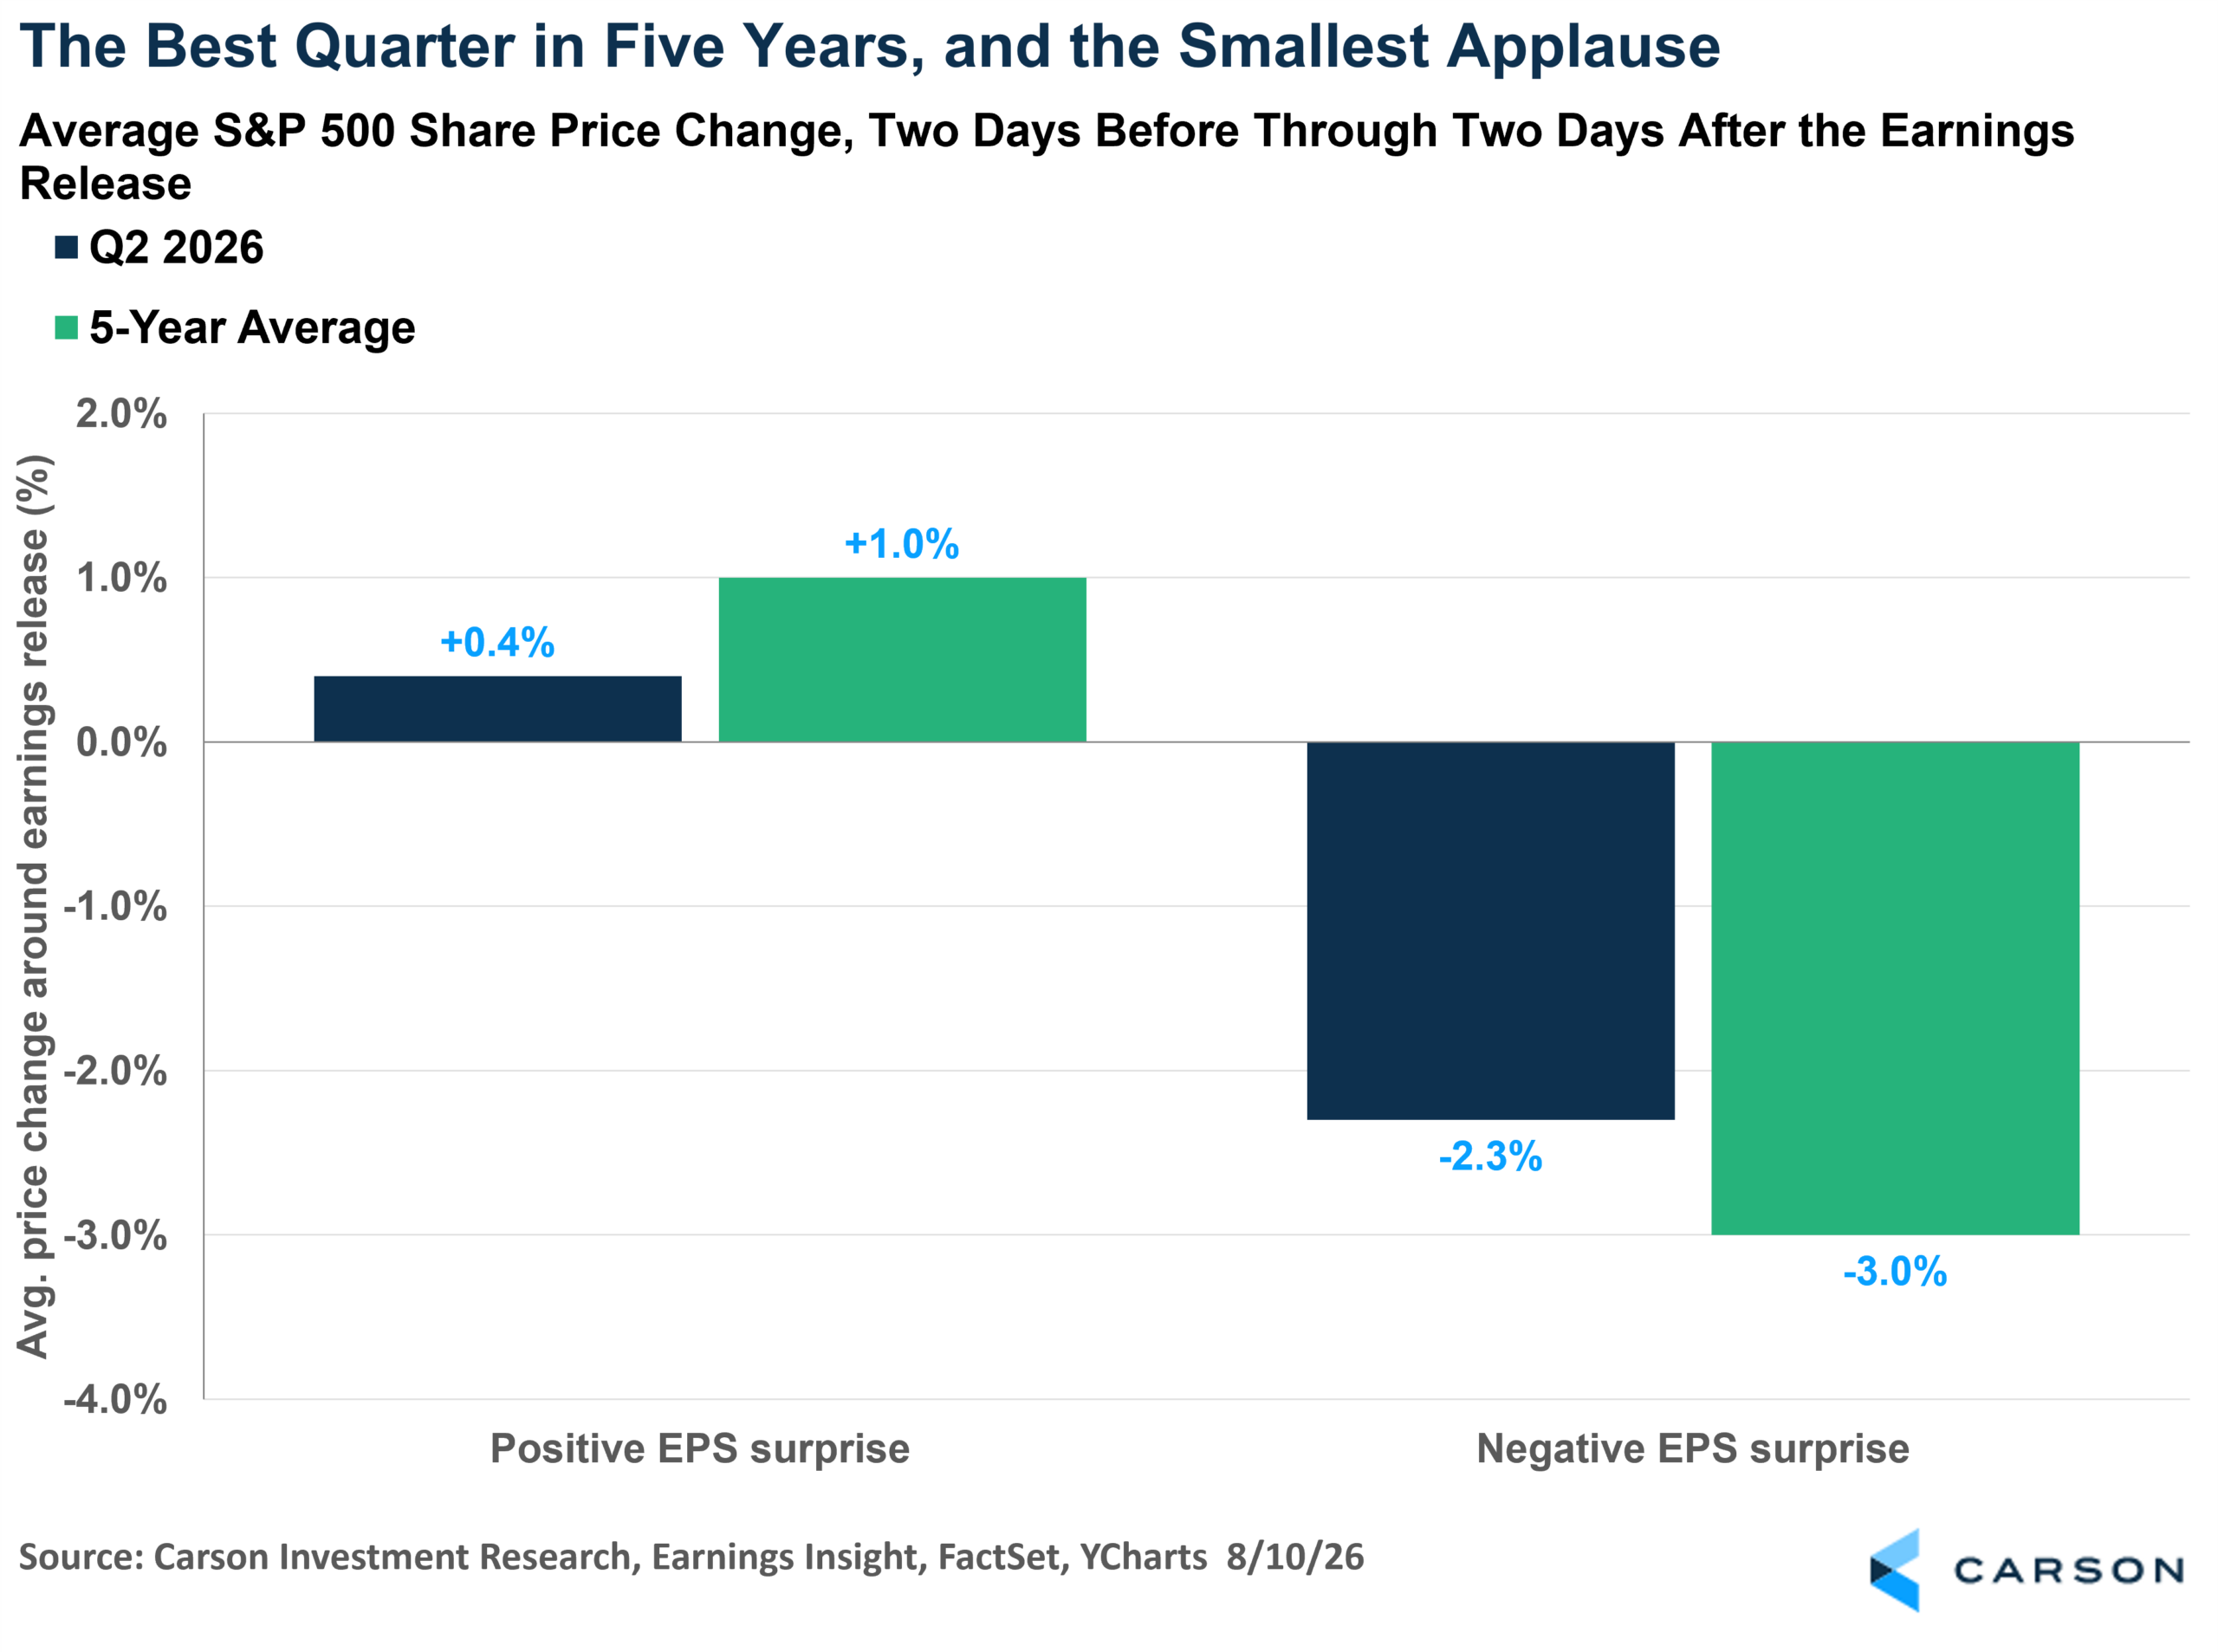
Companies that beat their estimate gained an average of 0.4% around the release, against a five-year average of 1.0%. Companies that missed fell 2.3%, against a five-year average of 3.0%.
The part that I’m thinking about is that both numbers are muted. If beats were being underpaid while misses got hammered, investors might call that caution, and they’d probably say they were nervous about valuations. But when the punishment is smaller too, it reads less like nervousness and more like indifference. Investors seem to have decided that this quarter’s surprises aren’t telling them much they didn’t already know, which is roughly the conclusion I’m coming up with as well.
Where the Growth Actually Is
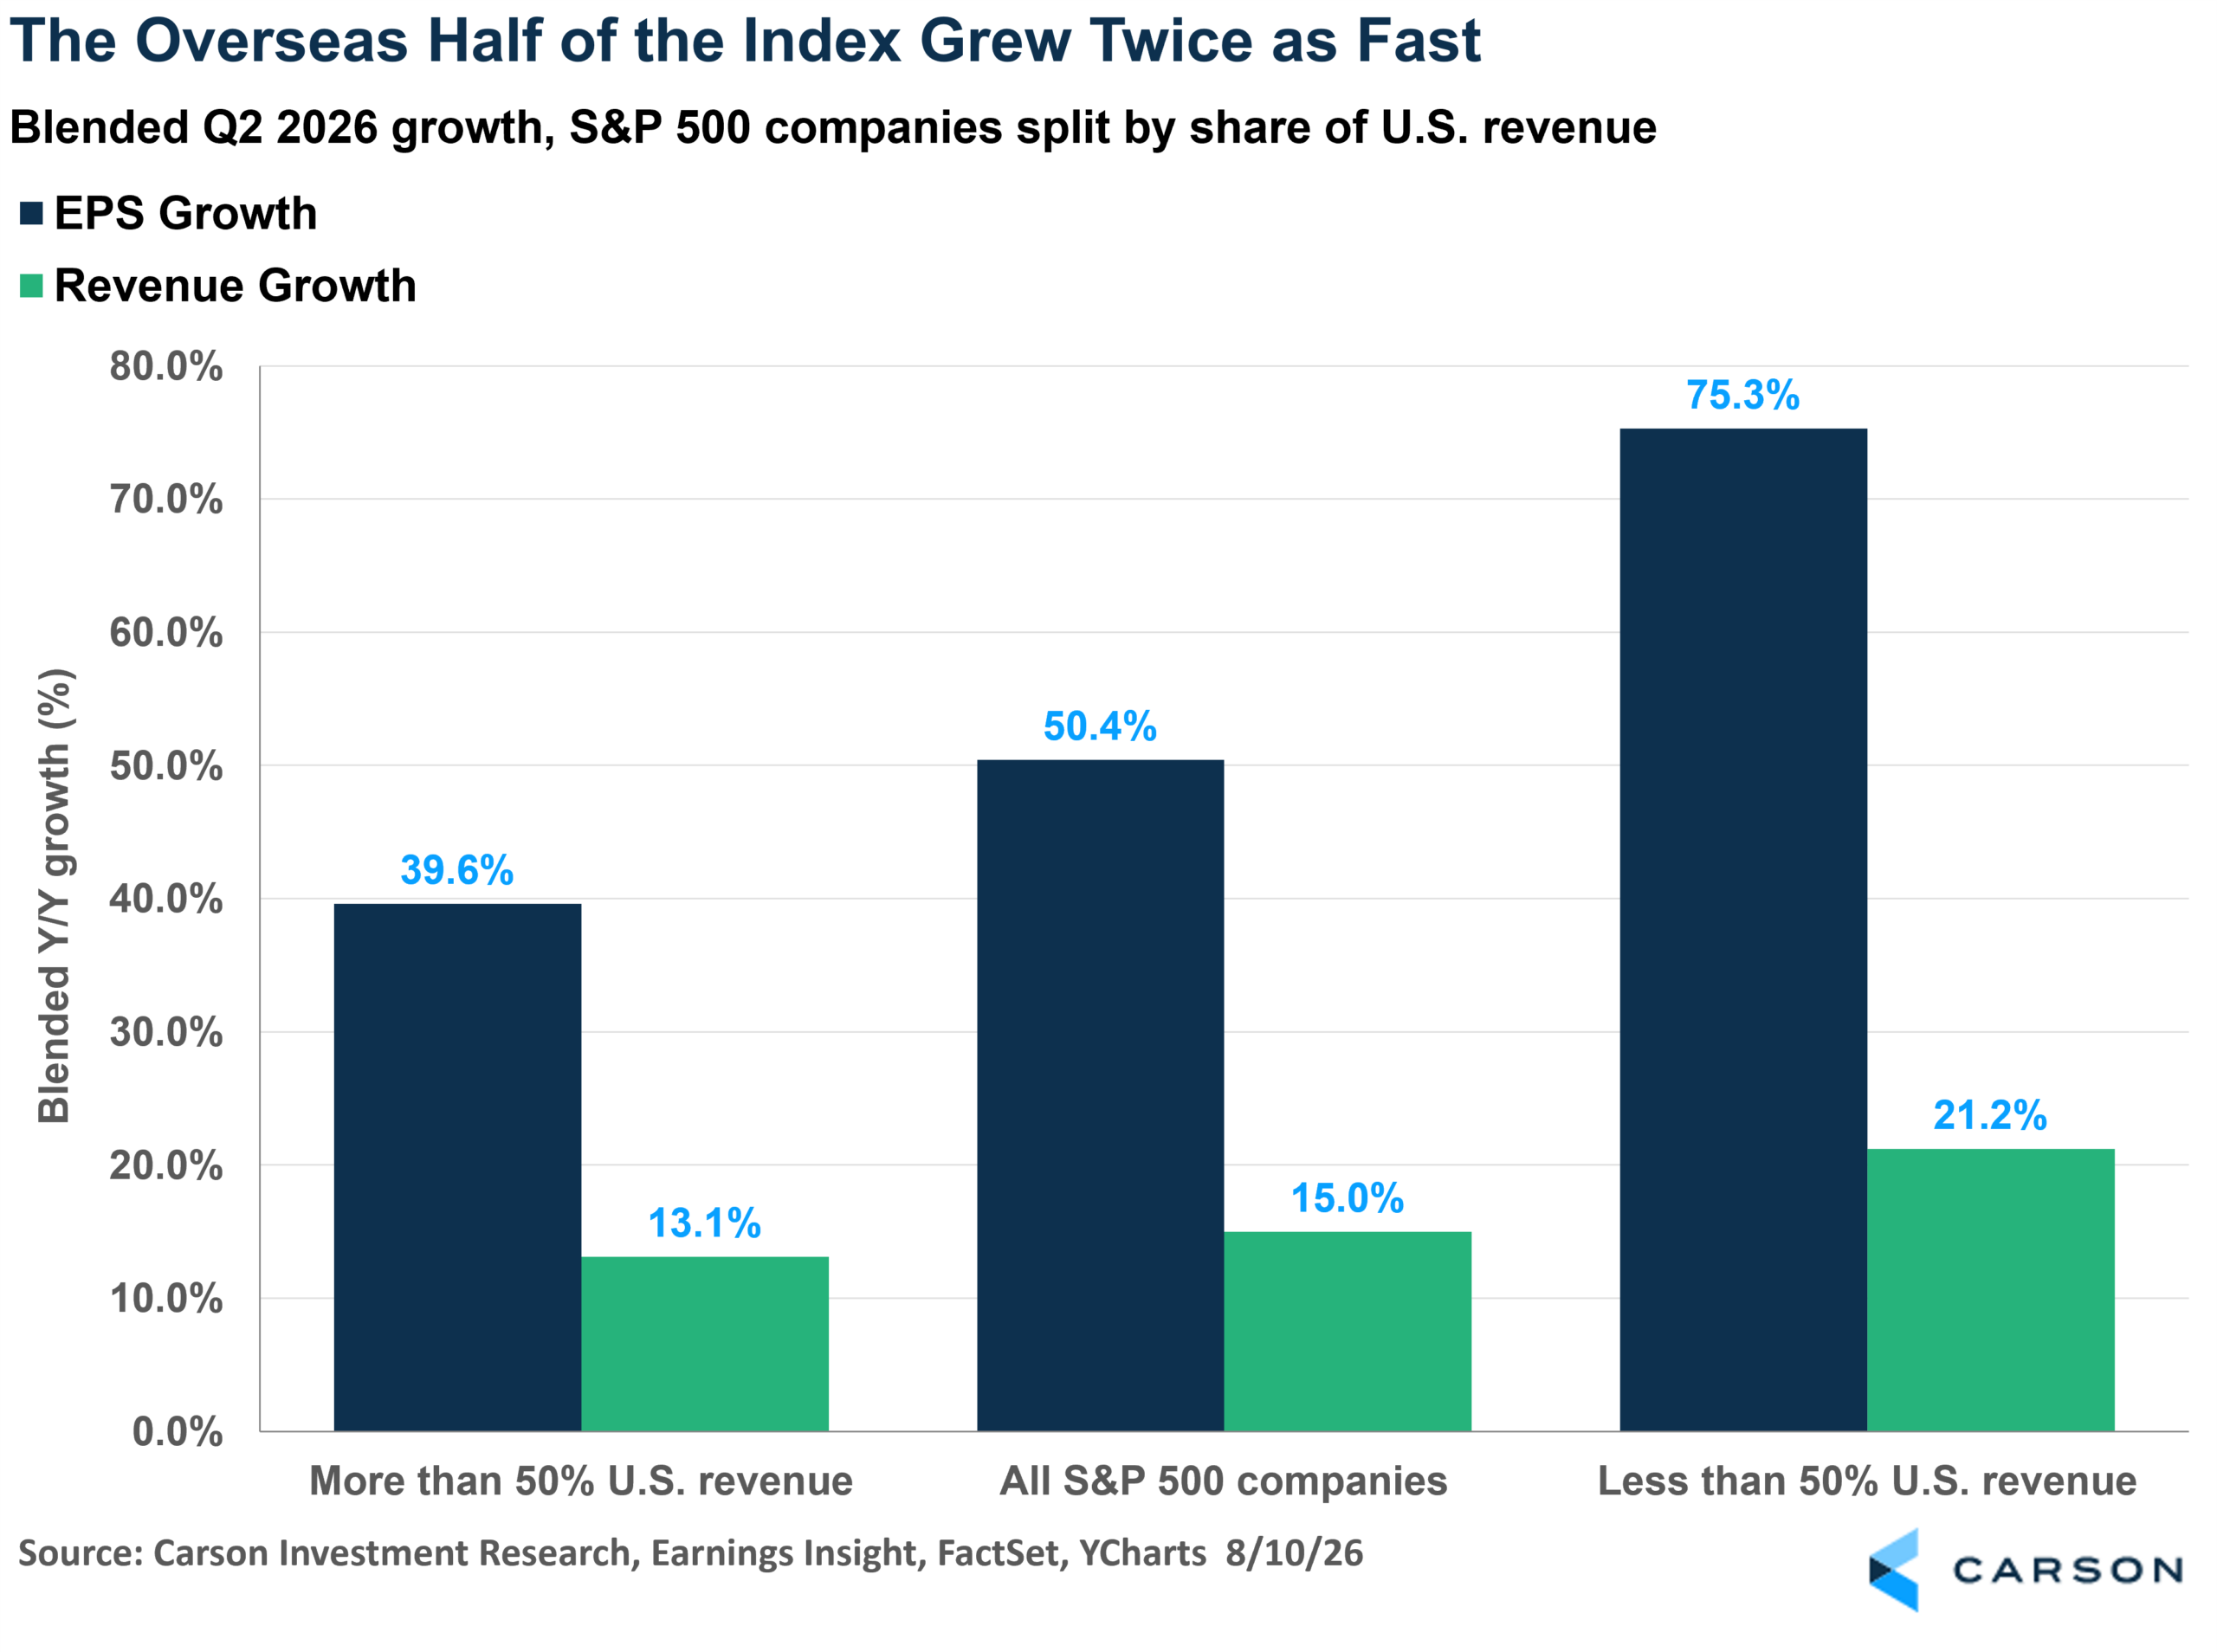
S&P 500 companies that earn less than half their revenue in the United States grew earnings 75.3% this quarter and revenue 21.2%. The more domestic half grew 39.6% and 13.1%. Given that the index as a whole earns 59% of its revenue at home, that’s a meaningful split.
It also lines up with what’s going on overseas. The Stoxx Europe 600 is tracking 22% earnings growth this quarter, its best showing since 2022, and European indices have been setting record highs through the past week. One Citi strategist described the money moving into the region as an anti-AI trade, which is a blunt way to put it but not an unfair one.
Two different datasets on two different continents are saying something similar. The growth that isn’t tied directly to the American AI complex is doing perfectly well right now.
The Sector Scoreboard
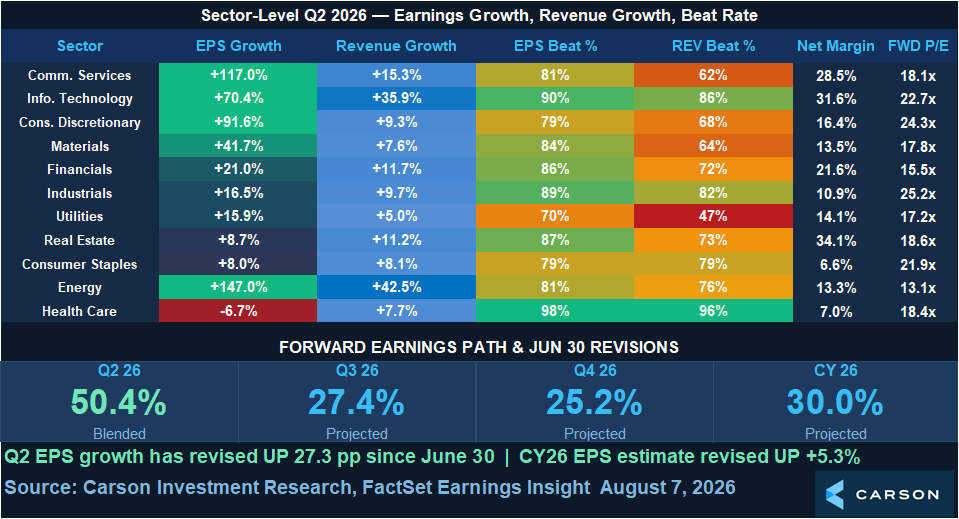
Health Care is still the only sector with falling earnings, at negative 6.7%, though that’s improved considerably from negative 13.8% a week ago. Take out the one-time charges at Gilead Sciences and Merck, and the sector would be growing 17.9% instead. It also has the highest EPS beat rate in the index at 98% and the highest revenue beat rate at 96%.
This is the fifth week in a row where the headline and the underlying business have pointed in opposite directions for Health Care.
See You in Two Weeks
Nine S&P 500 companies report next week, and I believe none of them will move the index in any real way. The one name still outstanding that matters is Nvidia, which reports on August 26 for its quarter ended in July. That report is the last real test of a lot of what’s above, since it should tell us whether the capital cycle driving semiconductor revenue and hyperscaler margins is still accelerating or whether all those commitments are starting to run out ahead of the returns.
FactSet isn’t publishing Earnings Insight on August 14 or August 21, and I’ll be out of town for part of that stretch anyway. So, we’re going to skip next Tuesday and come back on the day before Nvidia reports with an Nvidia preview and a first look at how Q3 is shaping up.
Bottom Line
The part I don’t think we keep is the oil comparison, which was a war premium and is already unwinding (hopefully), along with the two enormous investment gains that won’t repeat. I’d put the 30% full-year growth rate in that pile too, and I’d note that analysts have effectively said the same thing by publishing a 2027 estimate where the two best sectors of 2026 go backward.
The part I do think we keep is more interesting than I expected going in. A record net profit margin that survives stripping out both accounting gains and shows up across eight of eleven sectors is not a trick, and neither is international revenue growing at roughly twice the domestic rate.
That leaves us with a very good quarter that has a shorter shelf life than 50.4% would suggest. Judging by how little the market paid for beats along the way, most investors seem to have worked through the same arithmetic already.
By Harry McDonald, Analyst, Investment Research