
One of the opportunities we highlighted in our 2025 Outlook was a big tax bill that boosted corporate profits, similar to 2017. We never believed it would be as large as the 2017 tax bill’s boost on profits—after all you can only cut the corporate tax rate from 35% to 21% once—but there was still a potential tailwind in the works. We also thought that this tailwind would materialize before the threat of tariffs, similar to the sequencing we saw in the first Trump administration. Of course, as we know only too well, that didn’t happen. We got massive tariffs first, and it was quite a struggle to get the tax bill past the finish line. The Senate passed their version of the One Big Beautiful Bill (OBBB) last week and jaw-boned the House into accepting their version in its entirety (or else, we’d have weeks, or months, more of wrangling). President Trump signed the bill into law on July 4th.
The question is how this impacts markets.
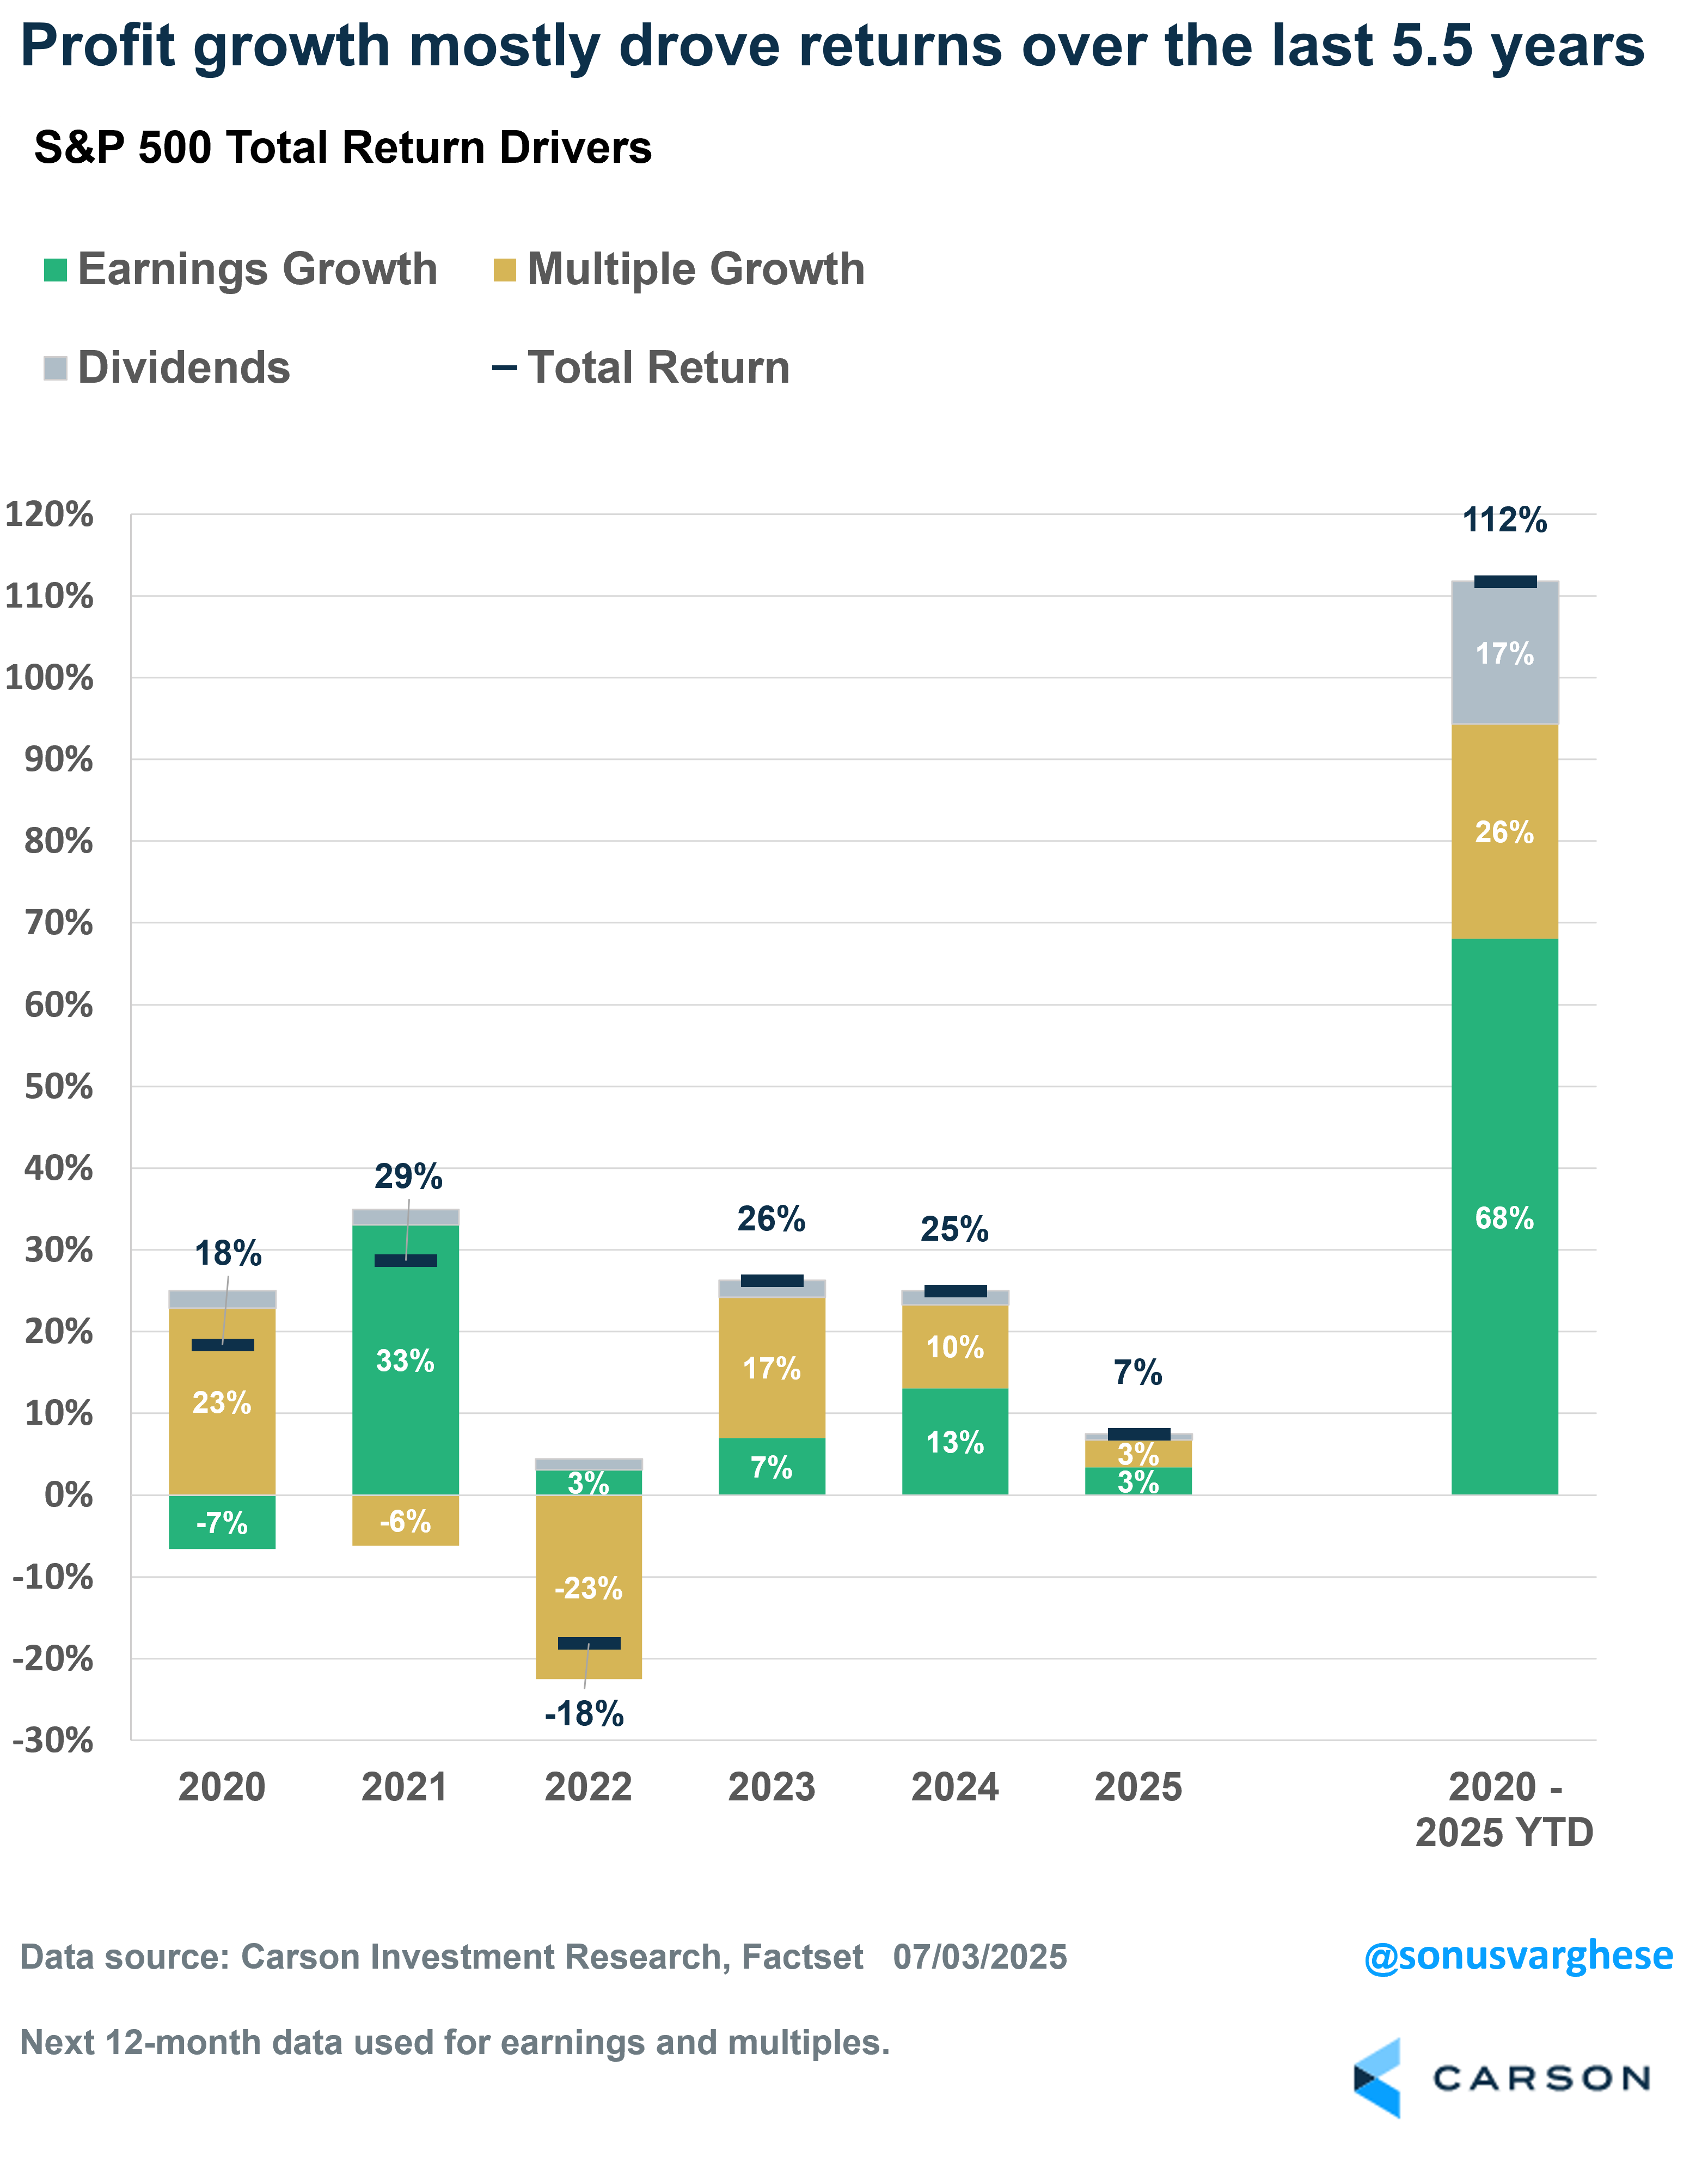
Ultimately, what matters for markets is profits, and so it’s useful to use that lens anytime we’re thinking about policy, especially fiscal policy. The S&P 500 price index has a year-to-date return of 6.8% (through July 3rd, 2025), and a total return of 7.5% once you include dividends. Note that this has come on the back of a 25% total return in 2024 and 26.3% return in 2023. And half the S&P 500’s return this year has come from profit growth. We can separate the S&P 500’s return into contributions from earnings growth, multiple change, and dividends, and using this framework the S&P 500’s YTD return of 7.5% came from:
- Earnings growth contribution: +3.4%-points
- Multiple growth contribution: +3.4%-points
- Dividends: +0.7%-points
In short, 4.1%-points of the index’s YTD return in 2025 came from profits, both retained and distributed (dividends). Zooming back over the past 5 years (2020-2025 to date), the S&P 500 has gained 112%, which we can break down to:
- Earnings growth: 68%-points
- Multiple growth: +26%-points
- Dividends: +17%-points (don’t ignore dividends!)
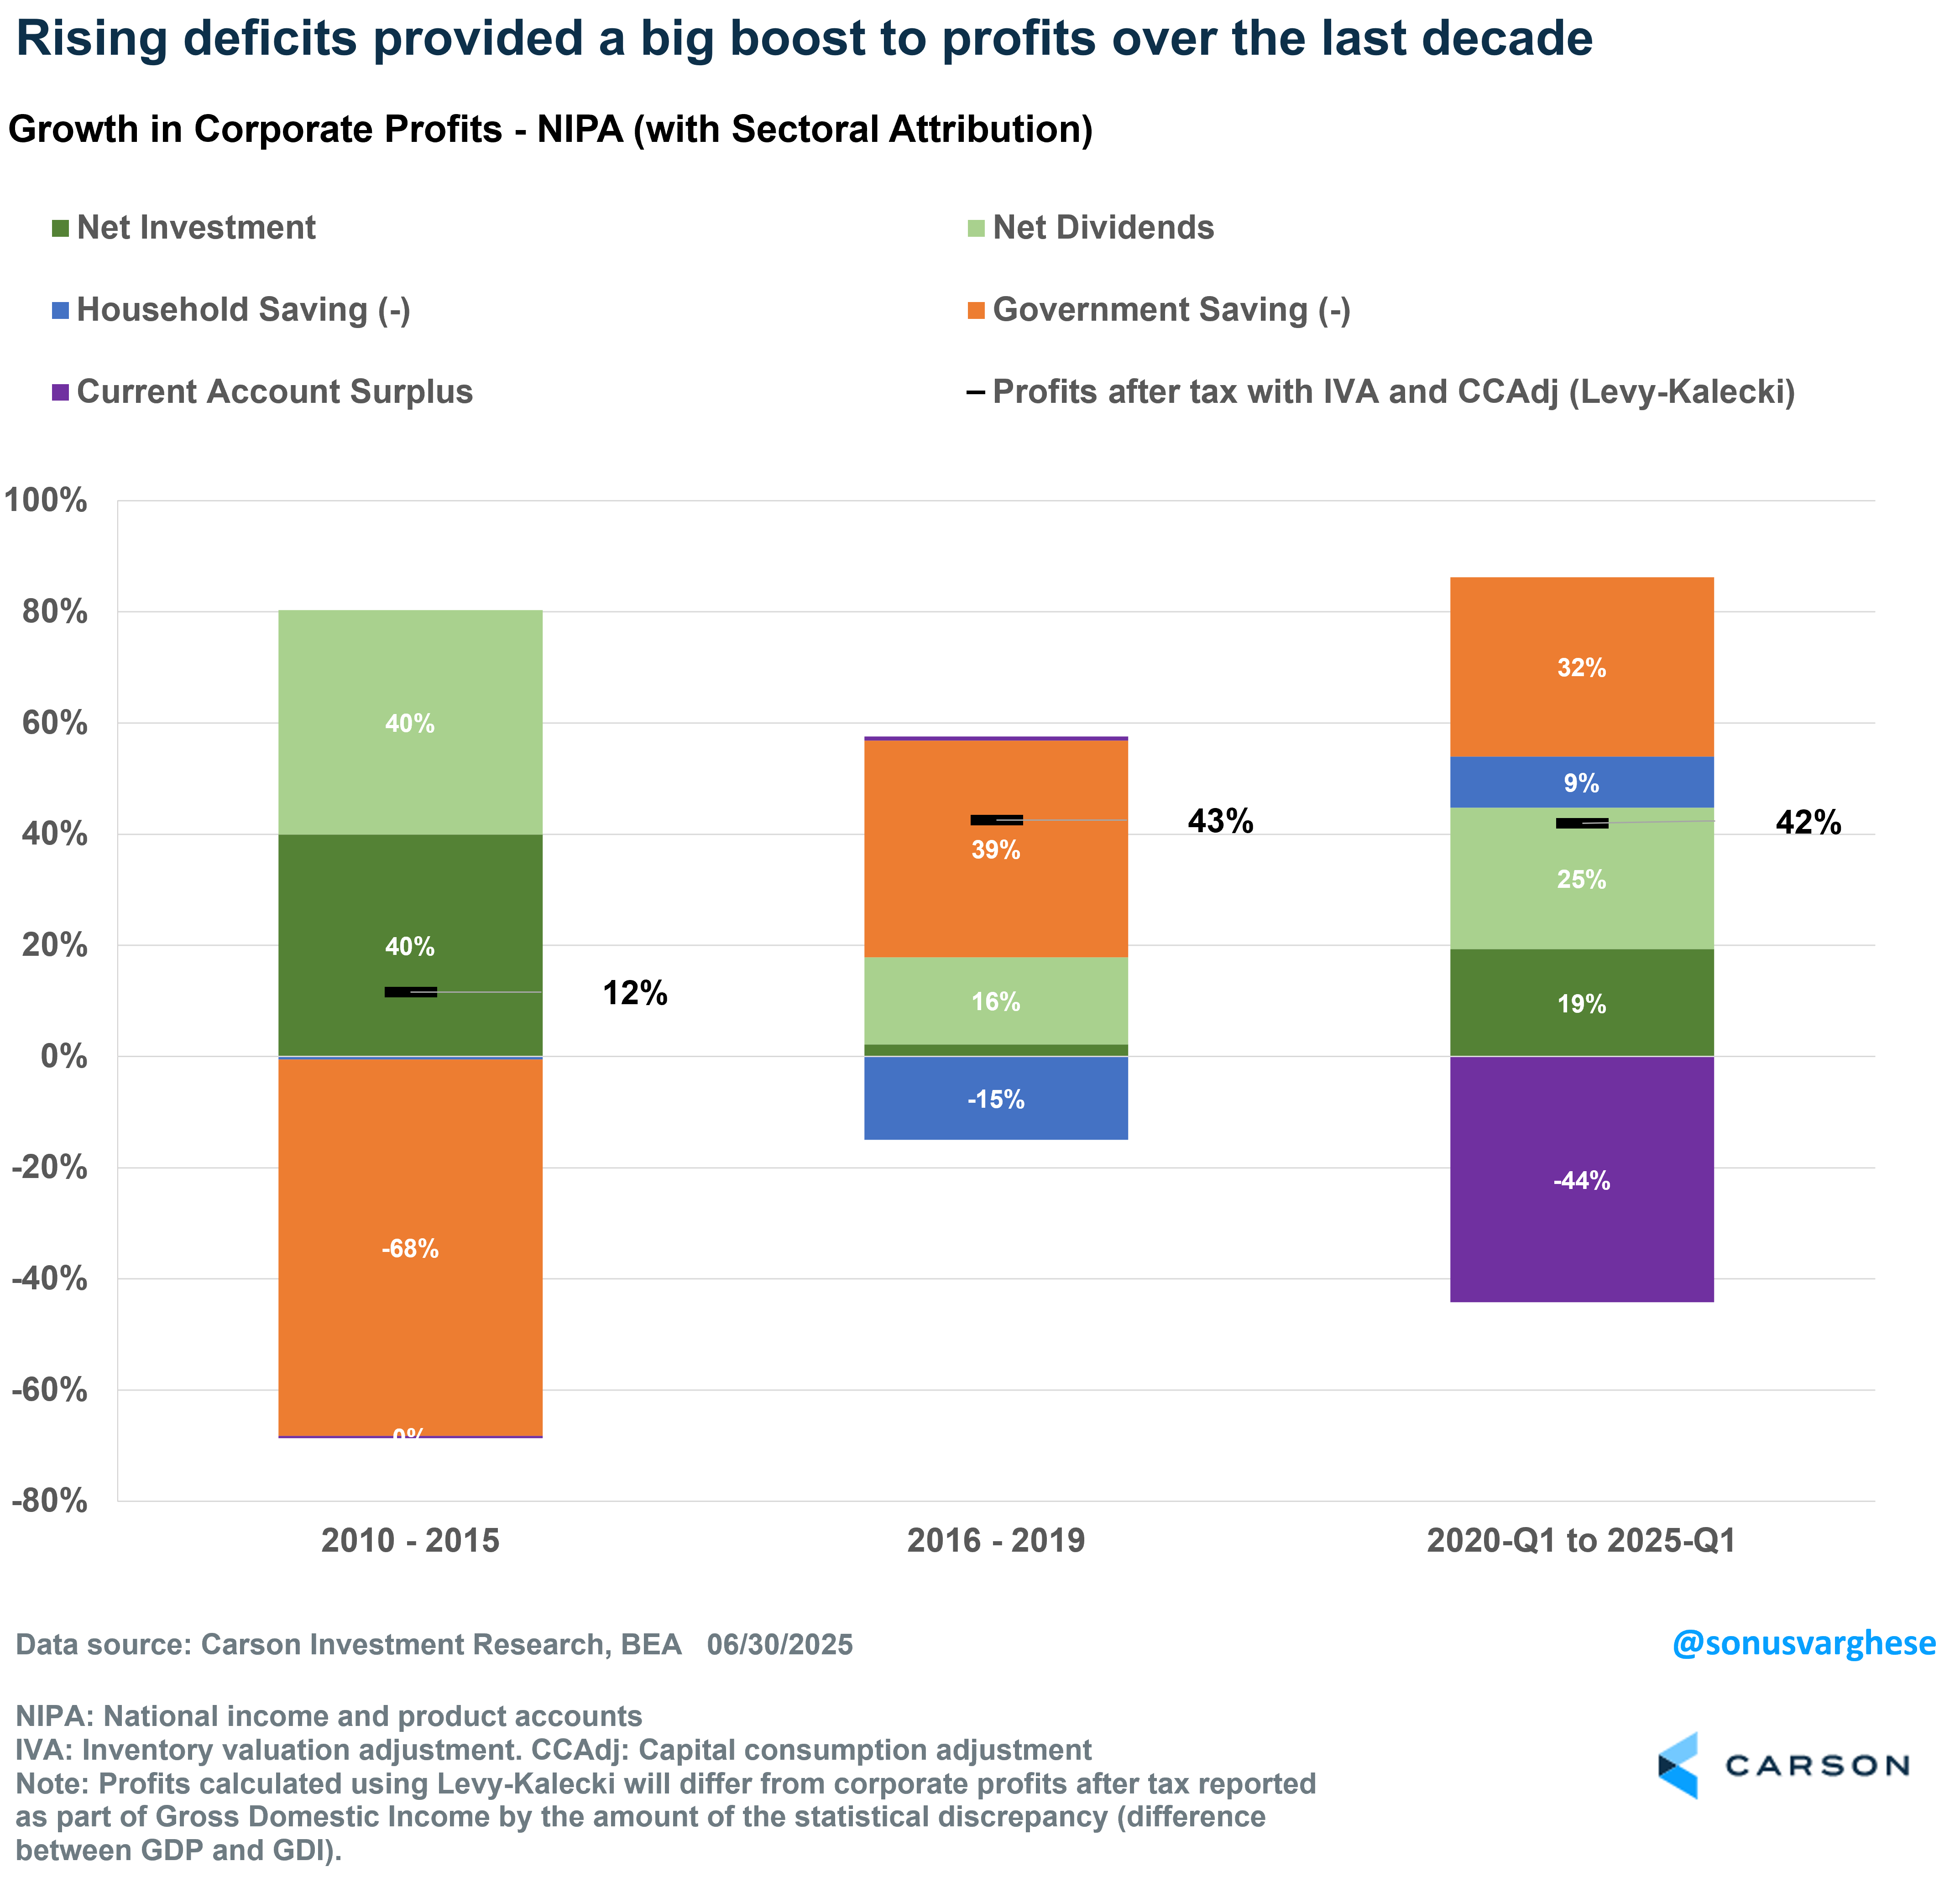
Rising Deficits Have Boosted Profits in the Past
Over the long run, market returns are mostly driven by profit growth, which depends on the economy. It’s the net result of saving and consumption by four sectors of the economy: households, businesses, governments, and the rest of the world via trade. In fact, there’s a national accounting identity that precisely relates profits to the various components of GDP, called the Levy-Kalecki profit equation:
![]()
What it captures is the various sources of profits on a macro aggregate level:
- Investment: More businesses investing in equipment, structures, etc., increases profits. The idea is that one business’s investment is another business’s revenue, and profits.
- Dividends: Income received by shareholders tends to get spent, unless households increase their savings, and so dividends go back to businesses as revenue, with any part saved reflected in the next category.
- Household savings: If households spend more, that translates to more revenue and profits for businesses. Conversely, increasing household savings reduces profits.
- Government savings: Rising government savings reduces corporate profits, and vice versa. In other words, deficit-financed spending adds to profits, all else equal. There may be negative long-term consequences of deficit spending, but in the near term, it pumps more money into the economy that goes to corporate profits.
- Current account surplus: A rising current account surplus means the rest of the world is buying more US-made goods and services than Americans buy from other countries, and that increases business revenues and profits, whereas a current account deficit (which is typically what the US has) means Americans buy relatively more from abroad, and that’s a drag on profits.
By definition, this accounting identity has to be true. It doesn’t tell us which companies are growing profits, or how profits are distributed across industries. But it tells us what can happen to drive profits up or down. For example, if the government is reducing its deficit, corporate profits will rise only if the private sector is increasing consumption such that it offsets increased government saving. If not, corporate profits will fall.
The chart below shows an attribution of corporate profit growth over several sub-periods since 2010. Note that this is not equivalent to S&P 500 profits, as it comes from macroeconomic data and includes all businesses in the US, public and private. Still, it can explain a lot.
- 2010–2015: Business investment and dividends drove profit growth, overcoming the drag from the reduction in government spending (which started to fall after the 2008–09 recession).
- 2016–2019: Profit growth surged thanks to rising fiscal deficits (on the back of the 2017 tax cuts), offsetting the increase in household savings.
- 2020 Q1–2021 Q2: Profit growth was given a huge boost by massive fiscal deficits during the post-Covid era, adding to profits drivers like increased household spending and investment. This more than overcame the drag from surging trade deficits.
Stay on Top of Market Trends
The Carson Investment Research newsletter offers up-to-date market news, analysis and insights. Subscribe today!
"*" indicates required fields
The One Big Beautiful Bill Is Likely to Increase Deficits
Unlike the 2017 Tax Cuts and Jobs Act (TCJA), the OBBB doesn’t contain a lot of promising provisions that can potentially boost growth, especially on the investment front. Most of the provisions went toward maintaining the status quo, i.e. preventing taxes from going up in 2026, which is by far the most “expensive” part of the bill. The key provisions include:
- Permanent extension of individual and estate tax cuts (same thresholds set by the 2017 tax bill)
- Enhanced standard deduction, from $25,000 to $31,500, for a married couple
- New individual tax benefits that are set to expire in a few years
- $6,000 additional deduction for seniors
- An exclusion of up to $25,000 for tip income
- Deduction for overtime pay
- Permanently enhanced child tax credit of $2,200
- Inflation adjustment for tax brackets (the 12% and 22% tax brackets get an extra year of inflation adjustment, resulting in higher bracket thresholds)
- Business and international tax provisions, including making 100% bonus depreciation and full expensing of R&D expenses permanent
- Repeal and modification of energy and clean vehicle tax credits
Offsetting this are cuts to other parts of the federal budget, mainly Medicaid and safety net programs like SNAP (food stamps). Still the bill is expected to increase the deficit by about $3.4 trillion over the next decade (2025-2034), and $4.7 trillion if temporary provisions are made permanent. The bill increases the primary deficit (excluding interest costs) by about $500-$600 billion annually over the next four years. Most of the spending is front-loaded and “savings” backloaded.
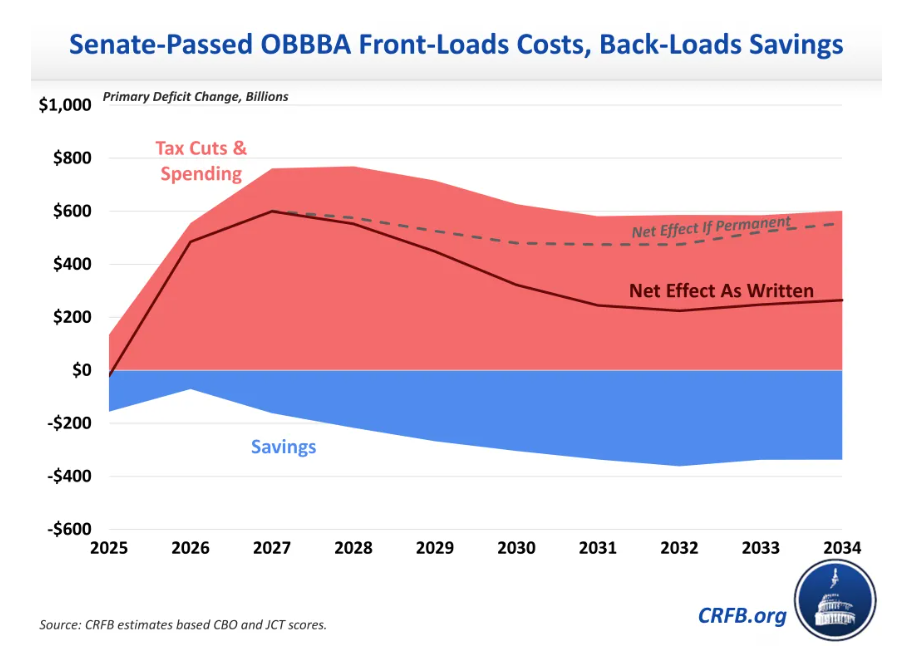
Of course, interest costs are also a “cost” here, and that’s expected to run an additional $700 billion over the next decade as a result of this bill. That means the overall deficit increase over the next decade would be $4.1 trillion, assuming expiring provisions are not made permanent, which is unlikely. If expiring provisions are made permanent, the cost of the bill rises to about $5.5 trillion. Simply put, this is a massive bill, bigger than all the recent tax bills put together:
- CARES Act of 2020 ~ $1.7 trillion
- American Rescue Plan of 2021 ~ $1.9 trillion
- Bipartisan Infrastructure Law of 2021 ~ $250 billion
- CHIPS and Science Act of 2022 ~ $280 billion
And all this is to more or less maintain the status quo.
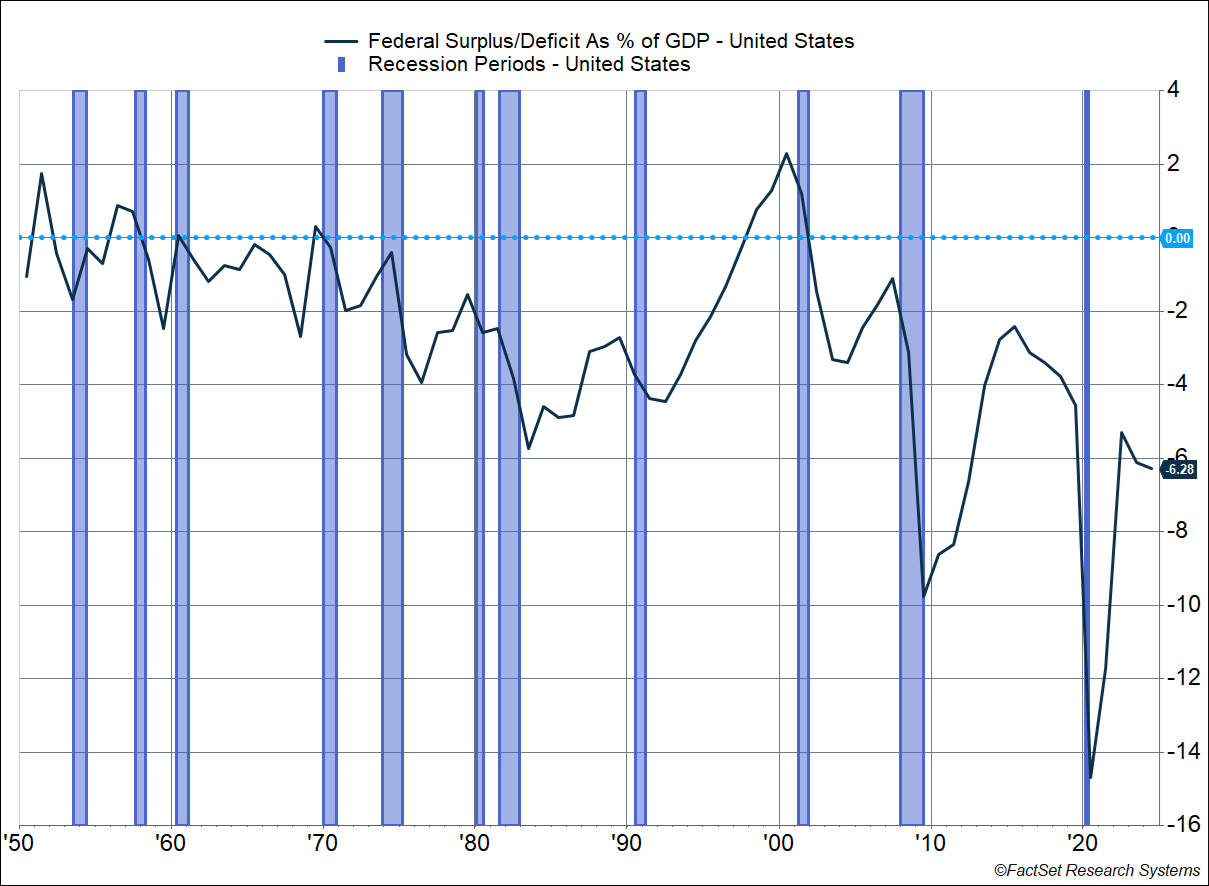
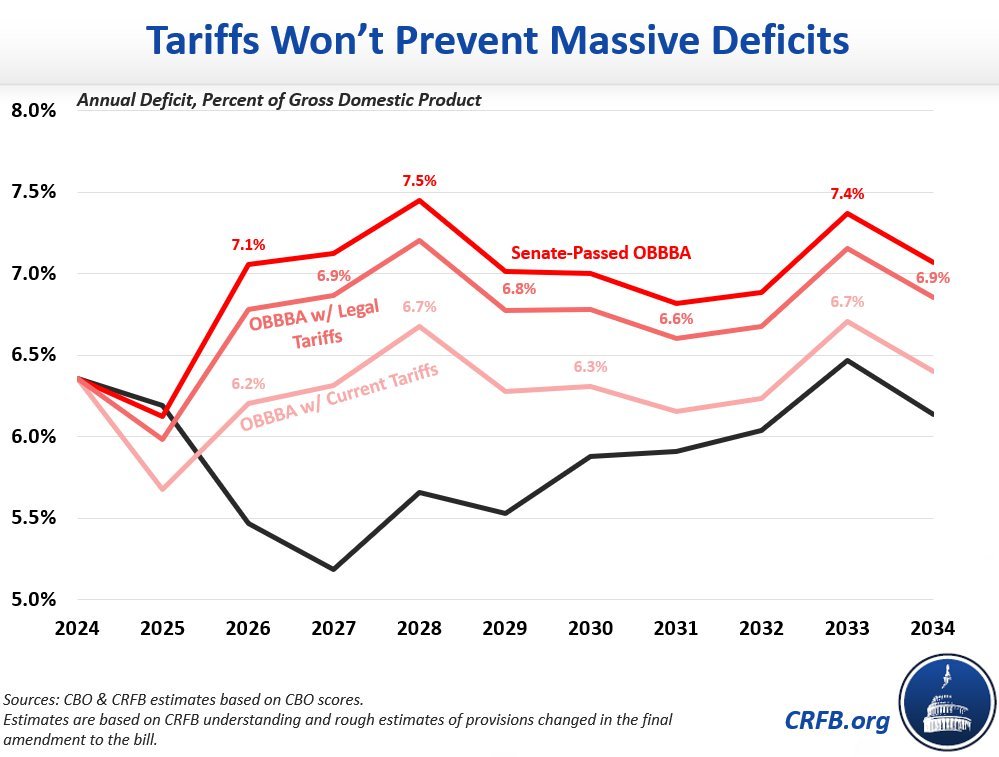
The federal deficit is already running at a whopping 6.3% of GDP, much larger than anything we’ve seen during expansions after WWII, especially this far into an economic expansion (this one is already over 5 years old).
Here’s the thing though. The deficit needed to increase for aggregate profits to get a boost from that sector of the economy. If not for the tax bill, the deficit would likely have started to shrink in 2026 and 2027, creating a headwind to profits. But that’s no longer the case, and we should see deficits rise to 7.5% by 2028. That’s a pretty significant boost: a 1%+ increase in the deficit is similar to the deficit increase we saw in 2018-2019.
On the other hand, we have tariffs, which offset some of this.
Tariffs Mute Some of The Positive Impact of OBBB
There’s increased tariff revenue coming into the government’s coffers, but as I’ve explained in the past, that’s not being paid by foreigners. Instead, businesses and consumers in the US are paying the higher import duties, which means the government is sucking up money from the private sector, offsetting some of the impact of the tax bill. Assuming current tariffs stay in place, and are held up as legal by the courts, deficits are expected to rise to about 6.7% of GDP by 2028. That’s still a massive deficit, but not a big increase relative to where we are now, which means the tailwind for aggregate profits may not be that large.
The courts could still rule some of the tariffs illegal, but the Trump administration has other avenues to implement similar levels of tariffs.
There’s No Free Lunch
The other side of all this deficit spending is that we’re likely to see interest rates stay elevated for much longer, with adverse consequences for rate-sensitive areas of the economy like housing, which is already a drag on economic growth. Higher interest rates are big reason why housing affordability has crashed, and right now there’s no relief in sight.
Rising deficits means there’s going to be a lot more issuance of Treasuries. However, if tariffs reduce imports, that means Americans are going to send fewer dollars abroad. That in turn means foreigners will be buying fewer US assets with those dollars, including Treasuries (which have typically been the US asset of choice for foreigners). So at the margin, lower demand from abroad is likely to keep rates elevated (unless we see a recession, but that’s not our base case right now).
Foreign holdings of US Treasury debt as a percent of overall US debt have been declining over the last decade—it’s dropped from 45–50% to about 30%. This is partly because of massive debt issuance post-Covid, most of which has been gobbled up by the US private sector, albeit at higher interest rates (everyone likes their high yield savings accounts and money markets). The other reason is that a lot of foreign inflows went toward purchasing US equities, which have had an amazing decade of returns. But as I mentioned above, if foreigners have fewer dollars, they’re going to buy fewer US assets, which could raise the premium on US assets at the margin.

To summarize, the OBBB is a potential tailwind for the economy and markets. But it’s not all rosy. The positive impact of OBBB is likely to be muted by higher-than-expected tariffs, but there’s considerable fog around the tariff endgame. If anything, the tariffs have pushed interest rate cuts (from the Fed) further down the road. Massive deficits, high tariffs, and a longer path to interest rate normalization means rates are likely to stay higher for longer, dragging down the cyclical areas of the economy. Keep an eye out for our 2025 Midyear Outlook, in which we discuss all these themes and what it means for portfolios. Ryan and I also discussed it on our latest episode of Facts vs Feelings, take a listen below:
For more content by Sonu Varghese, VP, Global Macro Strategist click here
8153525.1-07.09.25A
