The Federal Reserve (Fed) kept rates unchanged in the 4.25-4.50% range at their June meeting, as was expected. The most notable change in their official statement was that the Fed believes uncertainty concerning the economic outlook has reduced – but that’s only relative to a couple of months ago (post-Liberation Day). They still believe uncertainty remains high, which is the main theme behind everything we saw coming out of this week’s meeting.
The Fed releases their Summary of Economic Projections (“the dot plots) every quarter – March, June, September, December. The June dot plot update was widely anticipated to see how Fed members views evolve on inflation, especially amid tariffs, and even unemployment since it’s been rising recently (albeit, very slowly). Also, it was expected to see whether their December projection of 2 cuts (each worth 0.25%-points) would change.
The Fed moved in a “stagflationary” direction, with higher inflation expectations and higher unemployment, and slower real GDP growth. For 2025:
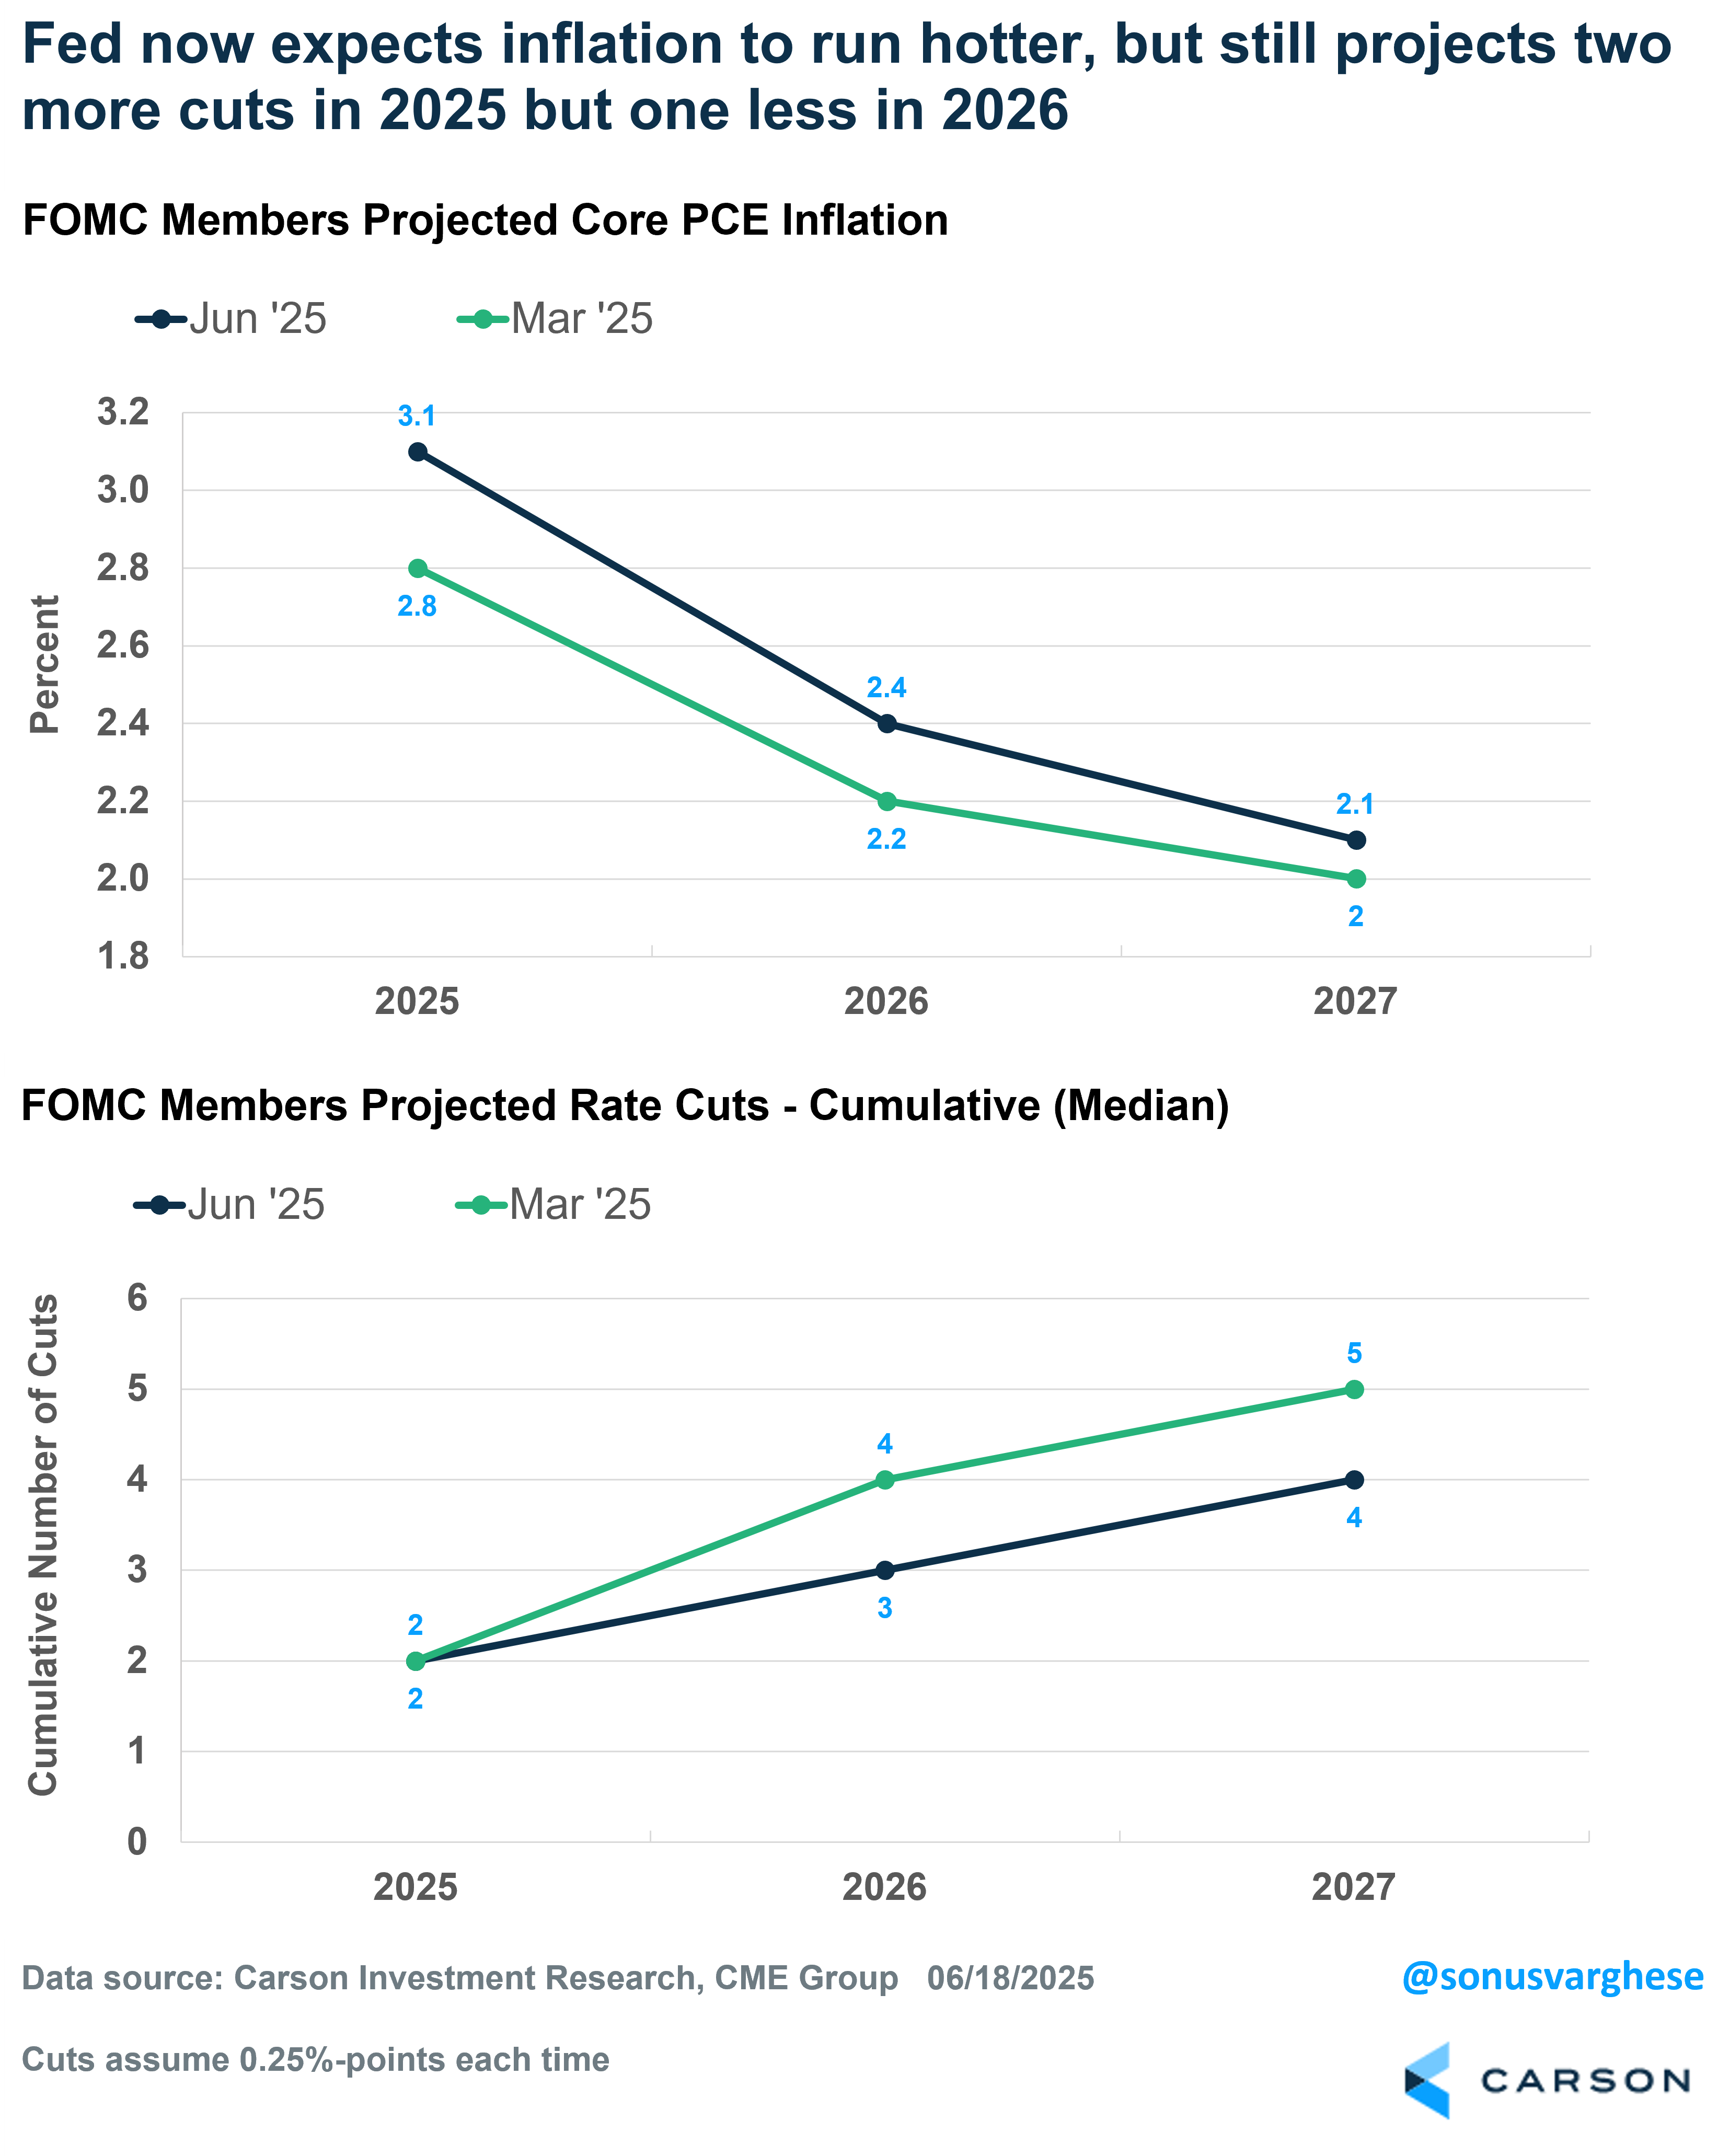
- Core inflation projection rose from 2.8% to 3.1%. It was 2.5% six months ago (Dec ’24).
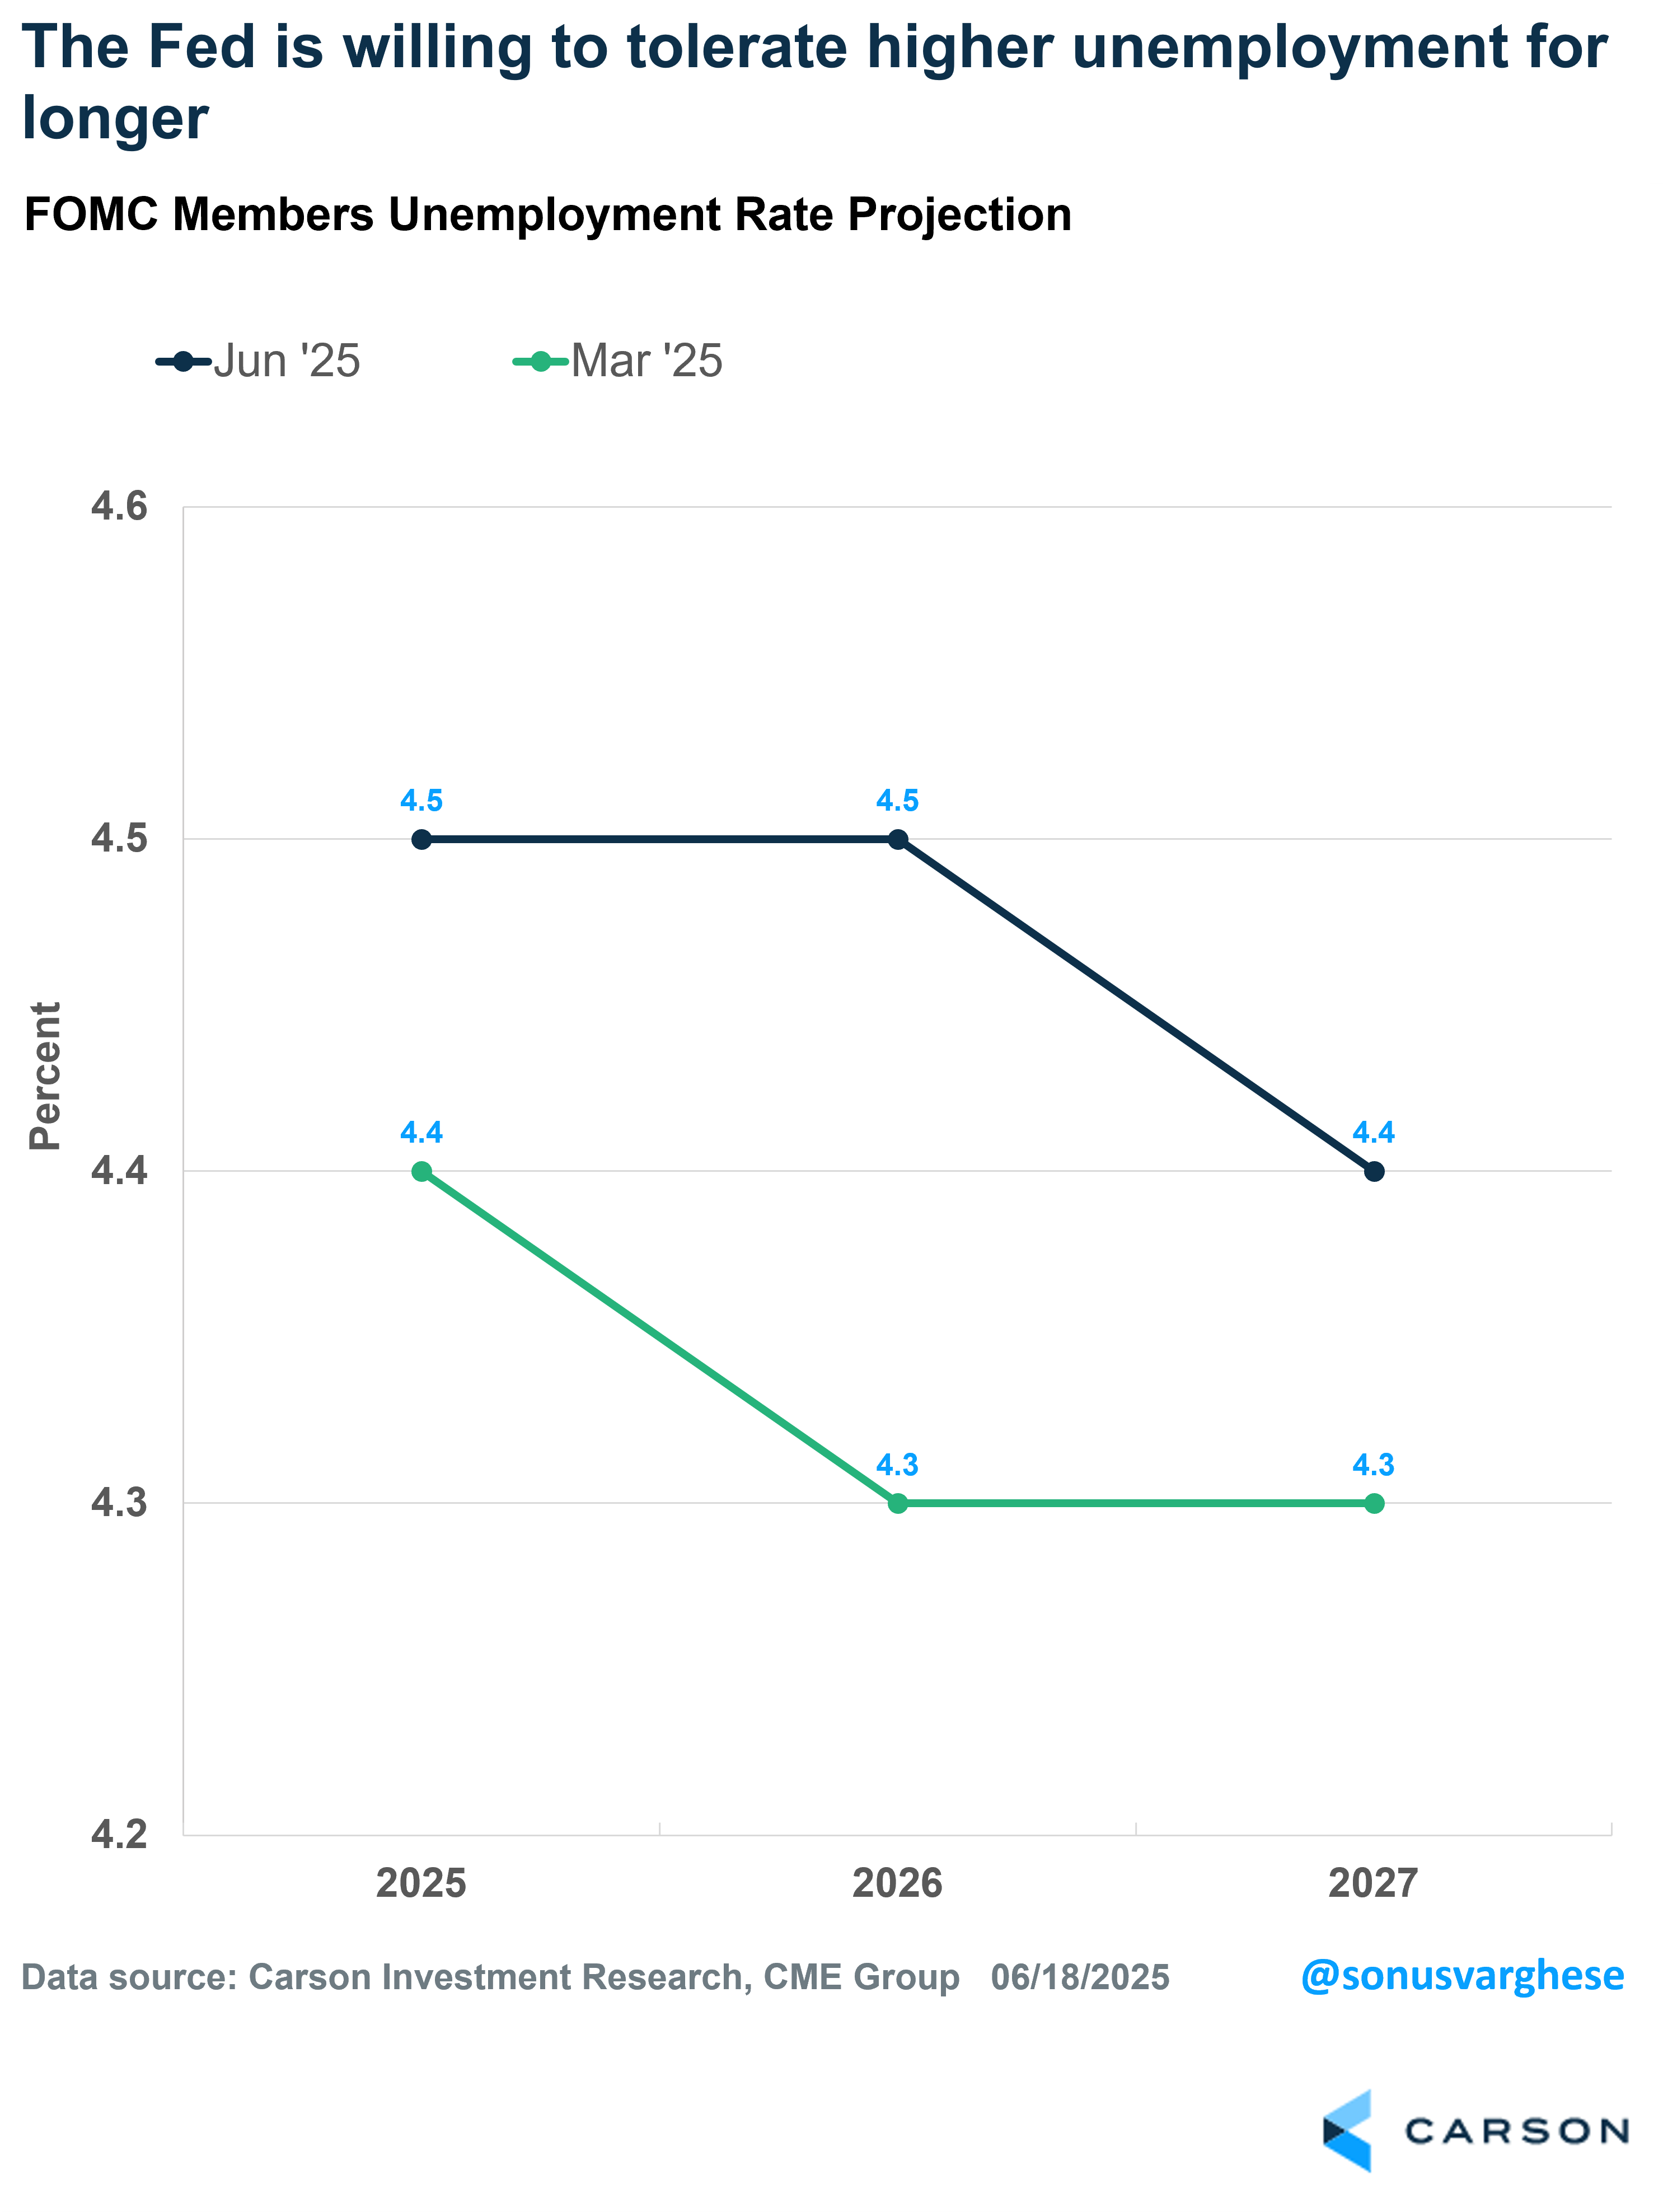
- Unemployment rate projection rose from 4.4% to 4.5%. It was 4.3% six months ago.
- Real GDP growth projection fell from 1.7% to 1.4%. It was 2.1% six months ago.
Given the core inflation projection, you would expect them to project a higher fed funds rate. On the other hand, the higher unemployment rate projection, along with lower output, would imply more cuts.
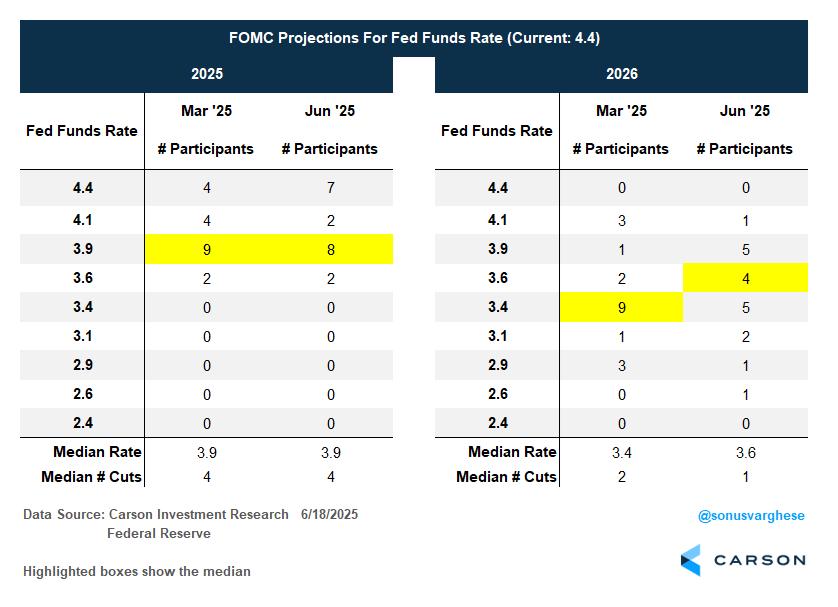
Net result: They did neither. The median rate projection for 2025 remained unchanged at 3.9%, i.e. the median member still projects two cuts in 2025.
Even looking beyond 2025, the Fed is now projecting higher inflation in both 2026 and 2027. They’ve reconciled this by reducing the number of rate cuts in 2026 to just one (each cut is 0.25%-points). So, including the 2 cuts in 2025, the Fed is now projecting a total of 3 cuts by 2026 and 4 by 2027. That’s down a cut from what they projected in March.
In other words, the median Fed member expects the policy rate in 2027 to be 3.4%, only 1%-point lower than it is now. Note that the Fed’s estimate of the “neutral rate” is 3.0% (the rate that is neither too accommodative, nor too restrictive) – of course, in reality it could be higher or lower. Still, it’s instructive that they think that policy should be on the more restrictive side for the next three years.
The Fed also seems willing to tolerate higher unemployment for longer. Last September, when they started rate cuts with a bang (with a 0.5%-point cut) it looked like they weren’t willing to tolerate unemployment rate above 4.4%. Their actions at the time, i.e. 1%-point worth of cuts over three meetings, reflected that. But now, they’ve moved expectations of the unemployment rate to 4.5% for both 2025 and 2026 and dropping to just 4.4% by 2027.
This gets to the point that if it comes to choosing between their inflation mandate and their maximum employment mandate, the Fed will likely prioritize the former. Keep in mind that even if they cut rates twice this year to 3.9%, that still leaves rates in restrictive territory.
Nobody believes the forecasts and things can still shift a lot
Ignore the dot plots is sort of what Fed Chair Powell implied in his post-meeting press conference. He pointed out that the dot plot projections reflect a diverse range of views, and that these are just point-in-time forecasts.
Case in point: the projected rate for 2025 was a result of the median landing at 3.9% (implying 2 cuts). But there was a shift under the hood. Back in March, only 4 members projected no cuts for 2025. On June 3 additional members projected no cuts at all. And for 2026, there’s now a much wider dispersion of where the fed funds rate will be versus the views in March.
All this to say, members’ projections are quite varied, and estimates can shift by a lot. Exactly a year ago, Fed members projected just one 0.25%-point cut across the rest of 2024. However, within 6 months, they cut the fed funds rate by a whole percent point. This was because the data showed that labor market conditions were weakening, and they went big.
We could very well see inflation pick up, with core inflation rising from 2.7% to 3.1% (as they project) but it’ll be interesting to see if the Fed follows through on rate cuts in that event. Upward trending inflation tends to spook central bankers, and more so because they missed the boat in 2021. If the unemployment rate doesn’t pick up meaningfully from here, we may see no cuts in 2025, or perhaps just one cut in December. On the other hand, if the unemployment rate starts to move above 4.5%, the Fed may step in, unless inflation starts moving closer to 3.5%.
Stay on Top of Market Trends
The Carson Investment Research newsletter offers up-to-date market news, analysis and insights. Subscribe today!
"*" indicates required fields
If that all sounds confusing, it is. There’s a lot of uncertainty now, which is why the Fed feels stuck.
Paralysis
At the end of the day, the Fed seems paralyzed by the prospect of higher unemployment versus higher inflation. For now, they are taking comfort in the notion that labor market conditions are consistent with maximum employment. This doesn’t seem to reflect the reality we see in the underlying data, whether its payroll growth being driven by a few non-cyclical sectors or climbing continuing claims, or even an unemployment rate that has been rising ever so slightly since January (even though it still remains relatively low at 4.2%). Nevertheless, it’s the Fed’s internal view that matters. The Fed is erring on the side that they have the labor market situation under control – which may work out well if the unemployment rate only ticks up ever so slowly (as it has over the first five months of the year).
On the inflation side, despite lower inflation data, the Fed is forecasting inflation to be higher due to the tariffs – essentially erring on the side of tight policy since they think inflation risk is skewed to the upside.
Powell was quite explicit in saying that they’re waiting to understand what will happen with tariff inflation, because somebody will pay for the tariffs, whether it’s the manufacturer, the exporter, the importer, the retailer, and/or the consumer. He noted that each one of these groups is going to be trying not to pay for the tariff. But ultimately, somebody will pay, whether it’s a combination or one party.
Who’s paying the tariffs?
Somebody is already paying the tariffs because federal government revenue from import duties has surged, which shouldn’t be a surprise. Despite the Liberation Day tariff pause, average tariff rates are about 10%-points higher than they were at the beginning of the year. Then we get to Powell’s question of who is paying. Right now, it does not appear foreign exporters are paying the tariffs.
May import prices were flat but if you exclude fuels, import prices rose 0.3%. Import prices exclude the tariff duty paid at US customs. If foreign exporters were paying for the tariffs, you would expect them to reduce prices for goods they export to the US and import prices would be much lower. Instead, it’s gone the other way, across the board for every end-use category
- Capital goods: +0.2% (2-month Apr-May annualized pace: 5.5%).
- Industrial supplies/materials ex fuels: +1.3% (2-month annualized 10.7%).
- Autos & parts: +0.1% (2-month annualized 1.8%).
- Consumer goods ex autos: +0.2% (2-month annualized 4.3%).
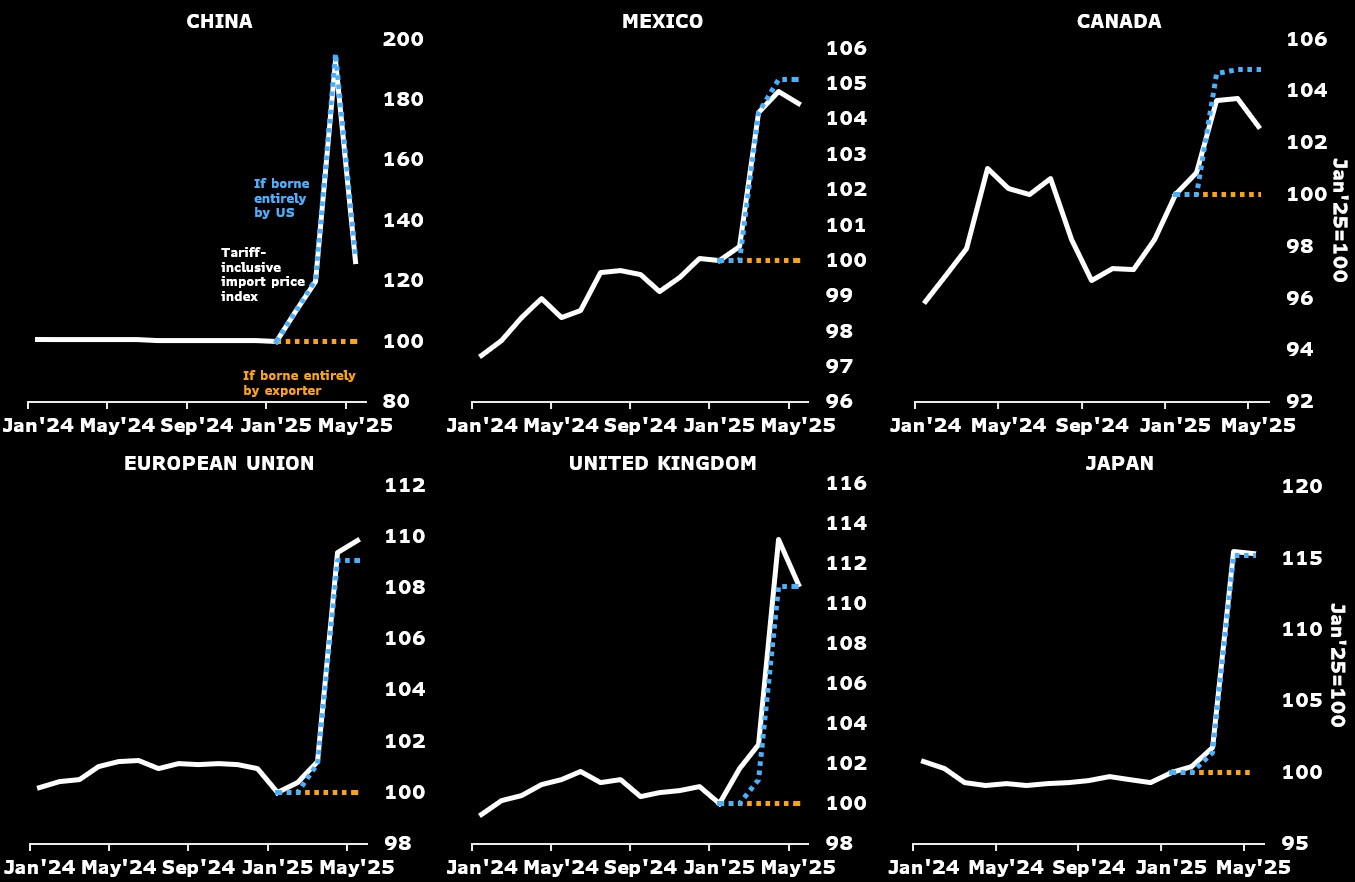
Bloomberg constructed “tariff-inclusive” import-price indexes for major US trading partners by adding the tariff increase to the published price index data for each month. They found that the “tariff-inclusive” import-price index increased in line with tariffs – by about 11% through the end of May, versus the year-to-date effective tariff increase of 11.1%-points.
Specifically, to China, tariff inclusive import prices fell 34.5% in May, but that reflects the temporary roll-back in tariffs negotiated last month in Geneva. Tariff-inclusive import prices are up 26.4% since January, compared to the 28.3%-point increase in tariff duties through May.
Canada and Mexico seem to be absorbing more of the duties.
- Tariff-inclusive prices for Mexico are up 4.4% year-to-date while tariffs are up 5.1%-points.
- Tariff-inclusive prices for Canada are up 2.7% year-to-date while tariffs are up 4.8%-points.
On the other hand, tariff-inclusive import prices from Europe are up 9.9% year-to-date, which is more than the 9.1%-point increase in tariffs this year.
All this suggests that most of the cost increase is being assumed by the US side. Of course, the question is whether businesses are shouldering it (via profit margins) or consumers (via inflation).
The other consequential question is when and how it shows up in the data. The answer to the second question is especially relevant for the Fed, as they’re going to wait until the data tells them what’s happening with tariffs. And we could be waiting some time, especially given the vagaries of how official inflation data is measured. As we’ve found out over the last few years, there are significant lags in the official data relative to what’s happening with the economy. So even if tariffs push up inflation for a month or two (as businesses pass higher costs to consumers), we may not see it reflected in the official data until later this year. It may not even show up all at once, with prices for different items not rising in tandem.
The Fed has the option of looking through all of this, since tariffs are likely to be one-off anyway. They can focus on protecting the labor market, which is weakening. However, instead of getting ahead of the data, they’ve opted to wait. The problem is that if the unemployment rate starts to surge, it can get out of control quickly, and policy by design is going to be behind the curve.
8093207.1.-06.20.25A
For more content by Sonu Varghese, VP, Global Macro Strategist click here.
