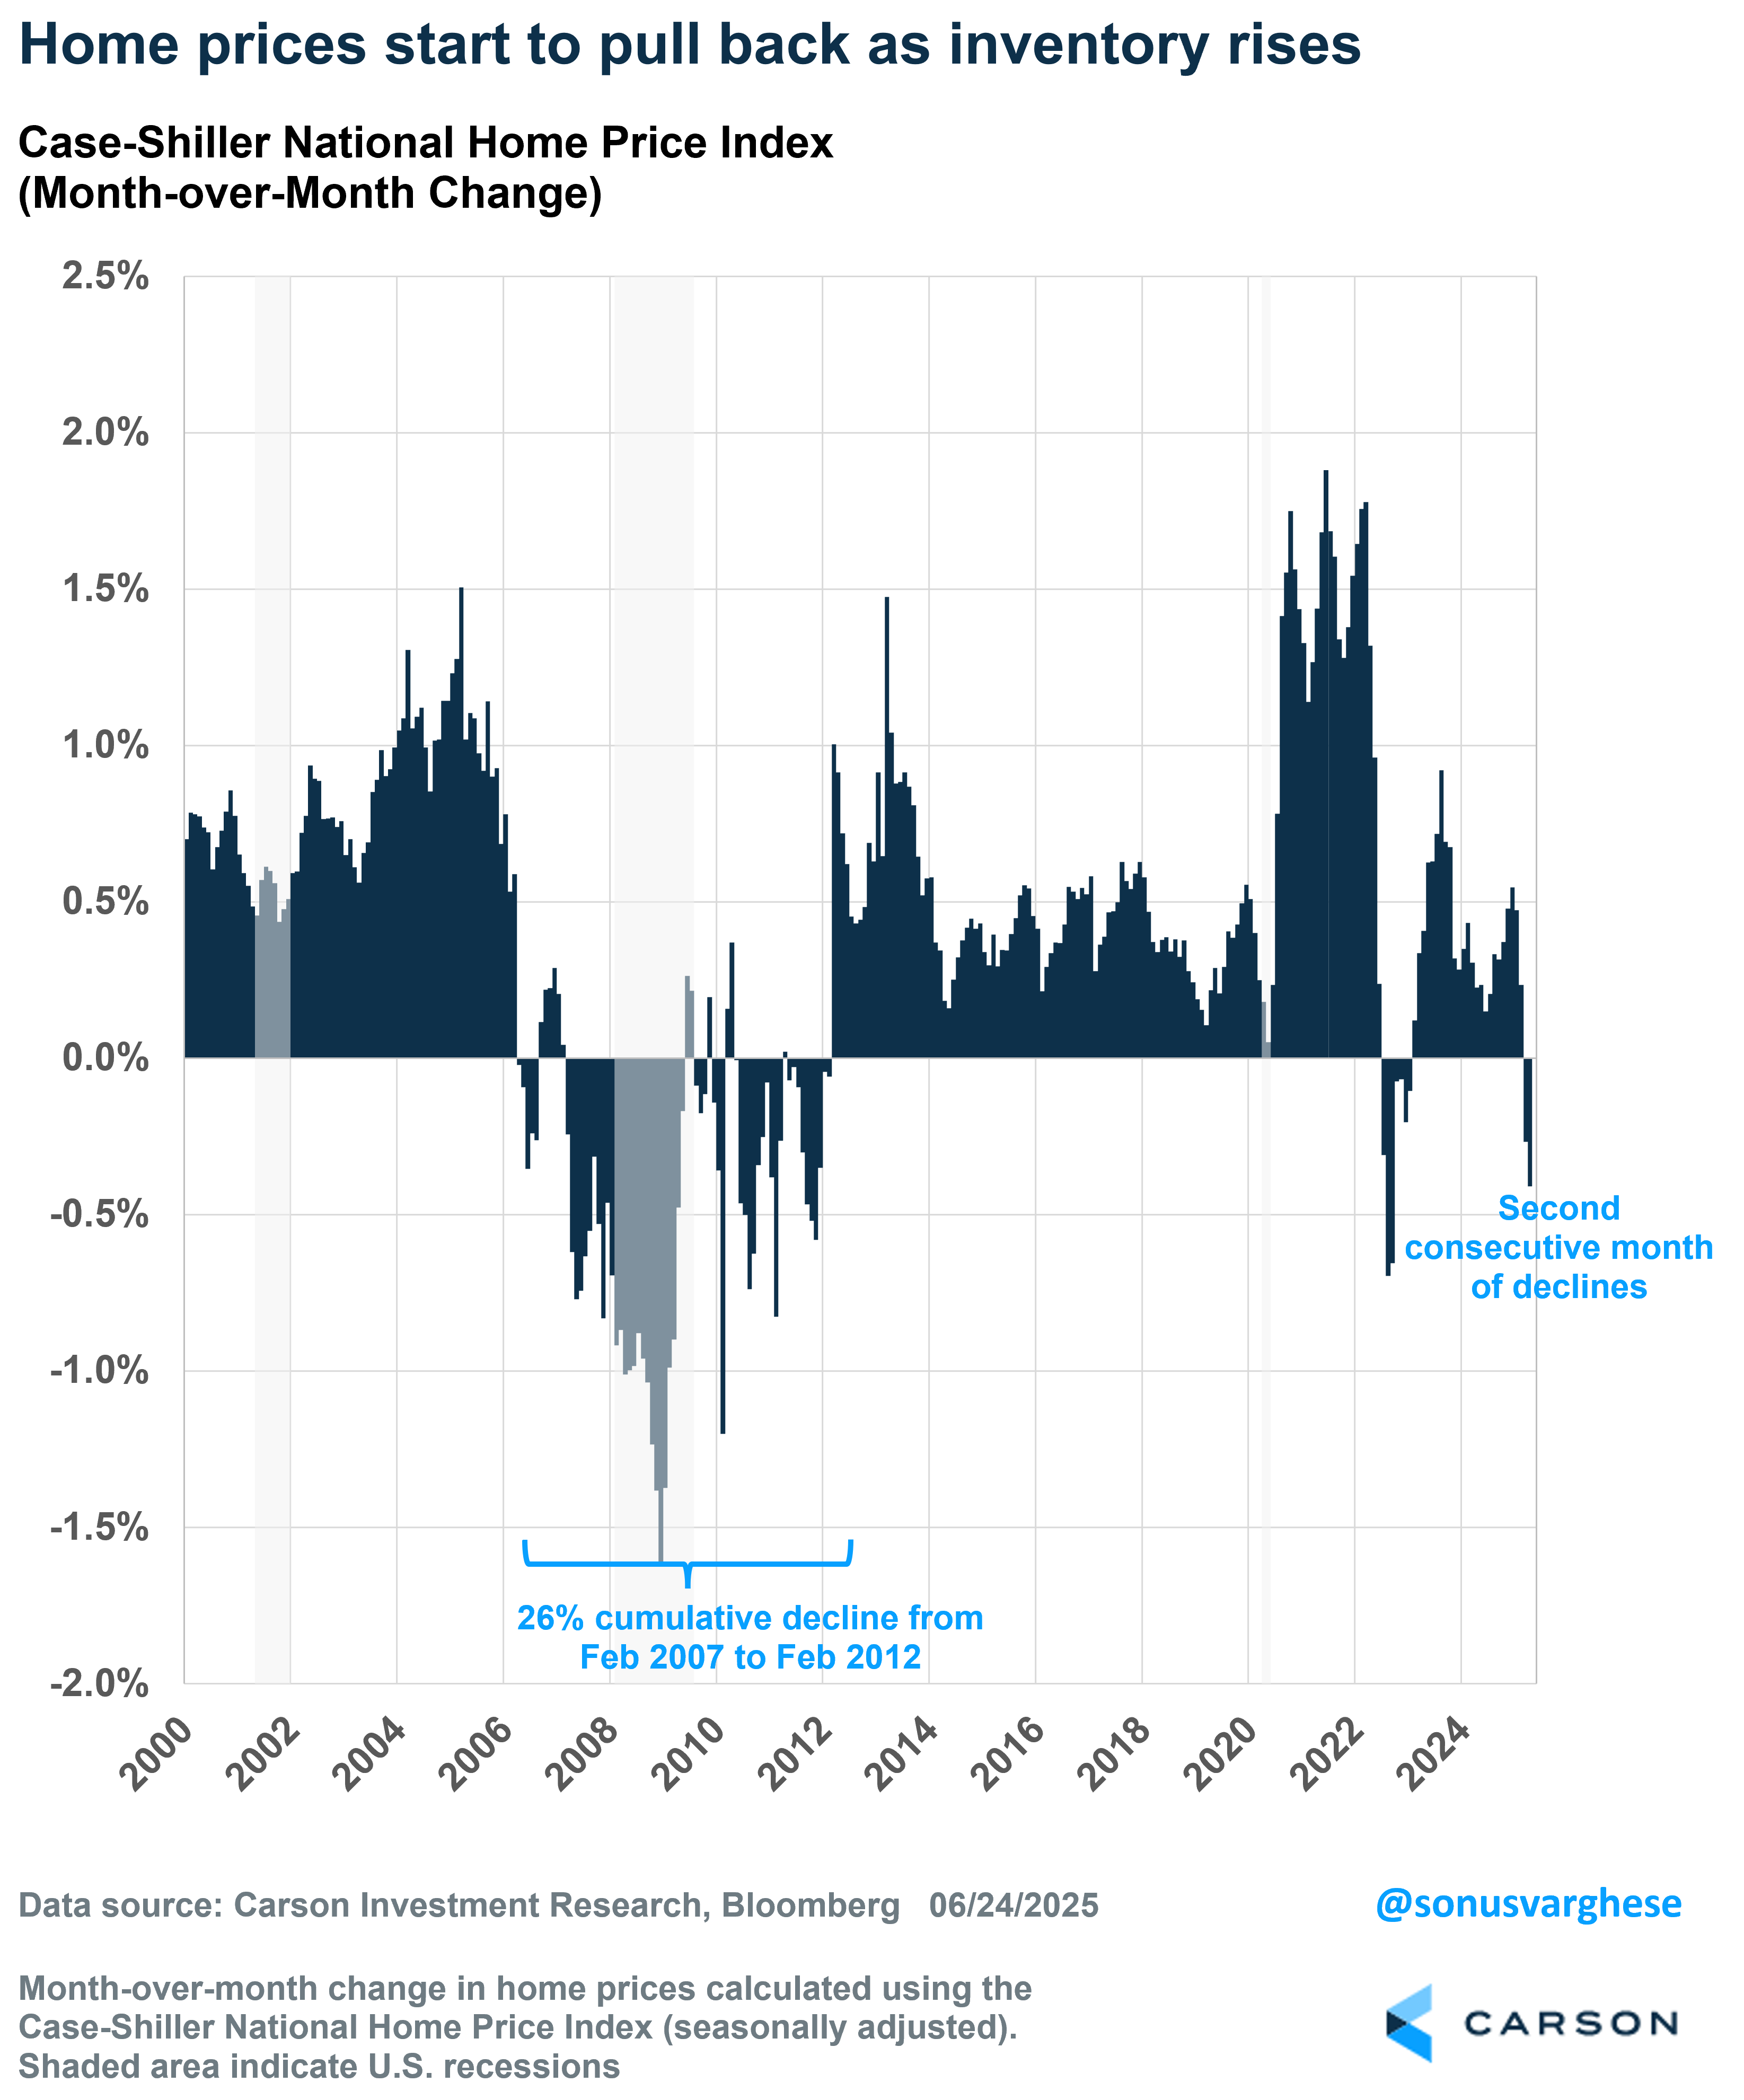
The Case-Shiller National home price index fell 0.4% month over month in April, the second consecutive month of declines following the 0.3% decline in March. Note that the Case-Shiller index is actually a three-month average, and so the April index prices are a three-month average of February, March, and April. That means the actual monthly decline in April alone is larger than the three-month average.
The national home price index is now up 2.7% over the last year, which is below the 3.4% expected. A year ago, home prices were up 6.4%, and back in December prices were up 4% trailing year, so this is a fairly sharp deceleration and it’s really about rising inventories. Inventories were the reason why prices rose in 2023 – 2024 despite falling home affordability. Inventories were low, and that drove prices higher. That’s no longer the case.
Looking at the top 20 cities, prices rose in just 4 of them, mostly in the Midwest (Cleveland, Detroit, Chicago) and New York. A couple of cities are now seeing a year-over-year price drop (Tampa (-2.2%) and Dallas (-0.3%)). But you’re seeing a sharp deceleration in the year over year pace from one year ago (April 2024) across the board, with San Diego, Miami, LA, Tampa, and Charlotte topping the list.
Prices are more than 2% off their peak levels in 8 of the 20 cities, with San Francisco seeing prices 7.5% below peak levels, followed by Denver (-2.8%) and Tampa (-2.7%).

Inventory rising and home prices easing
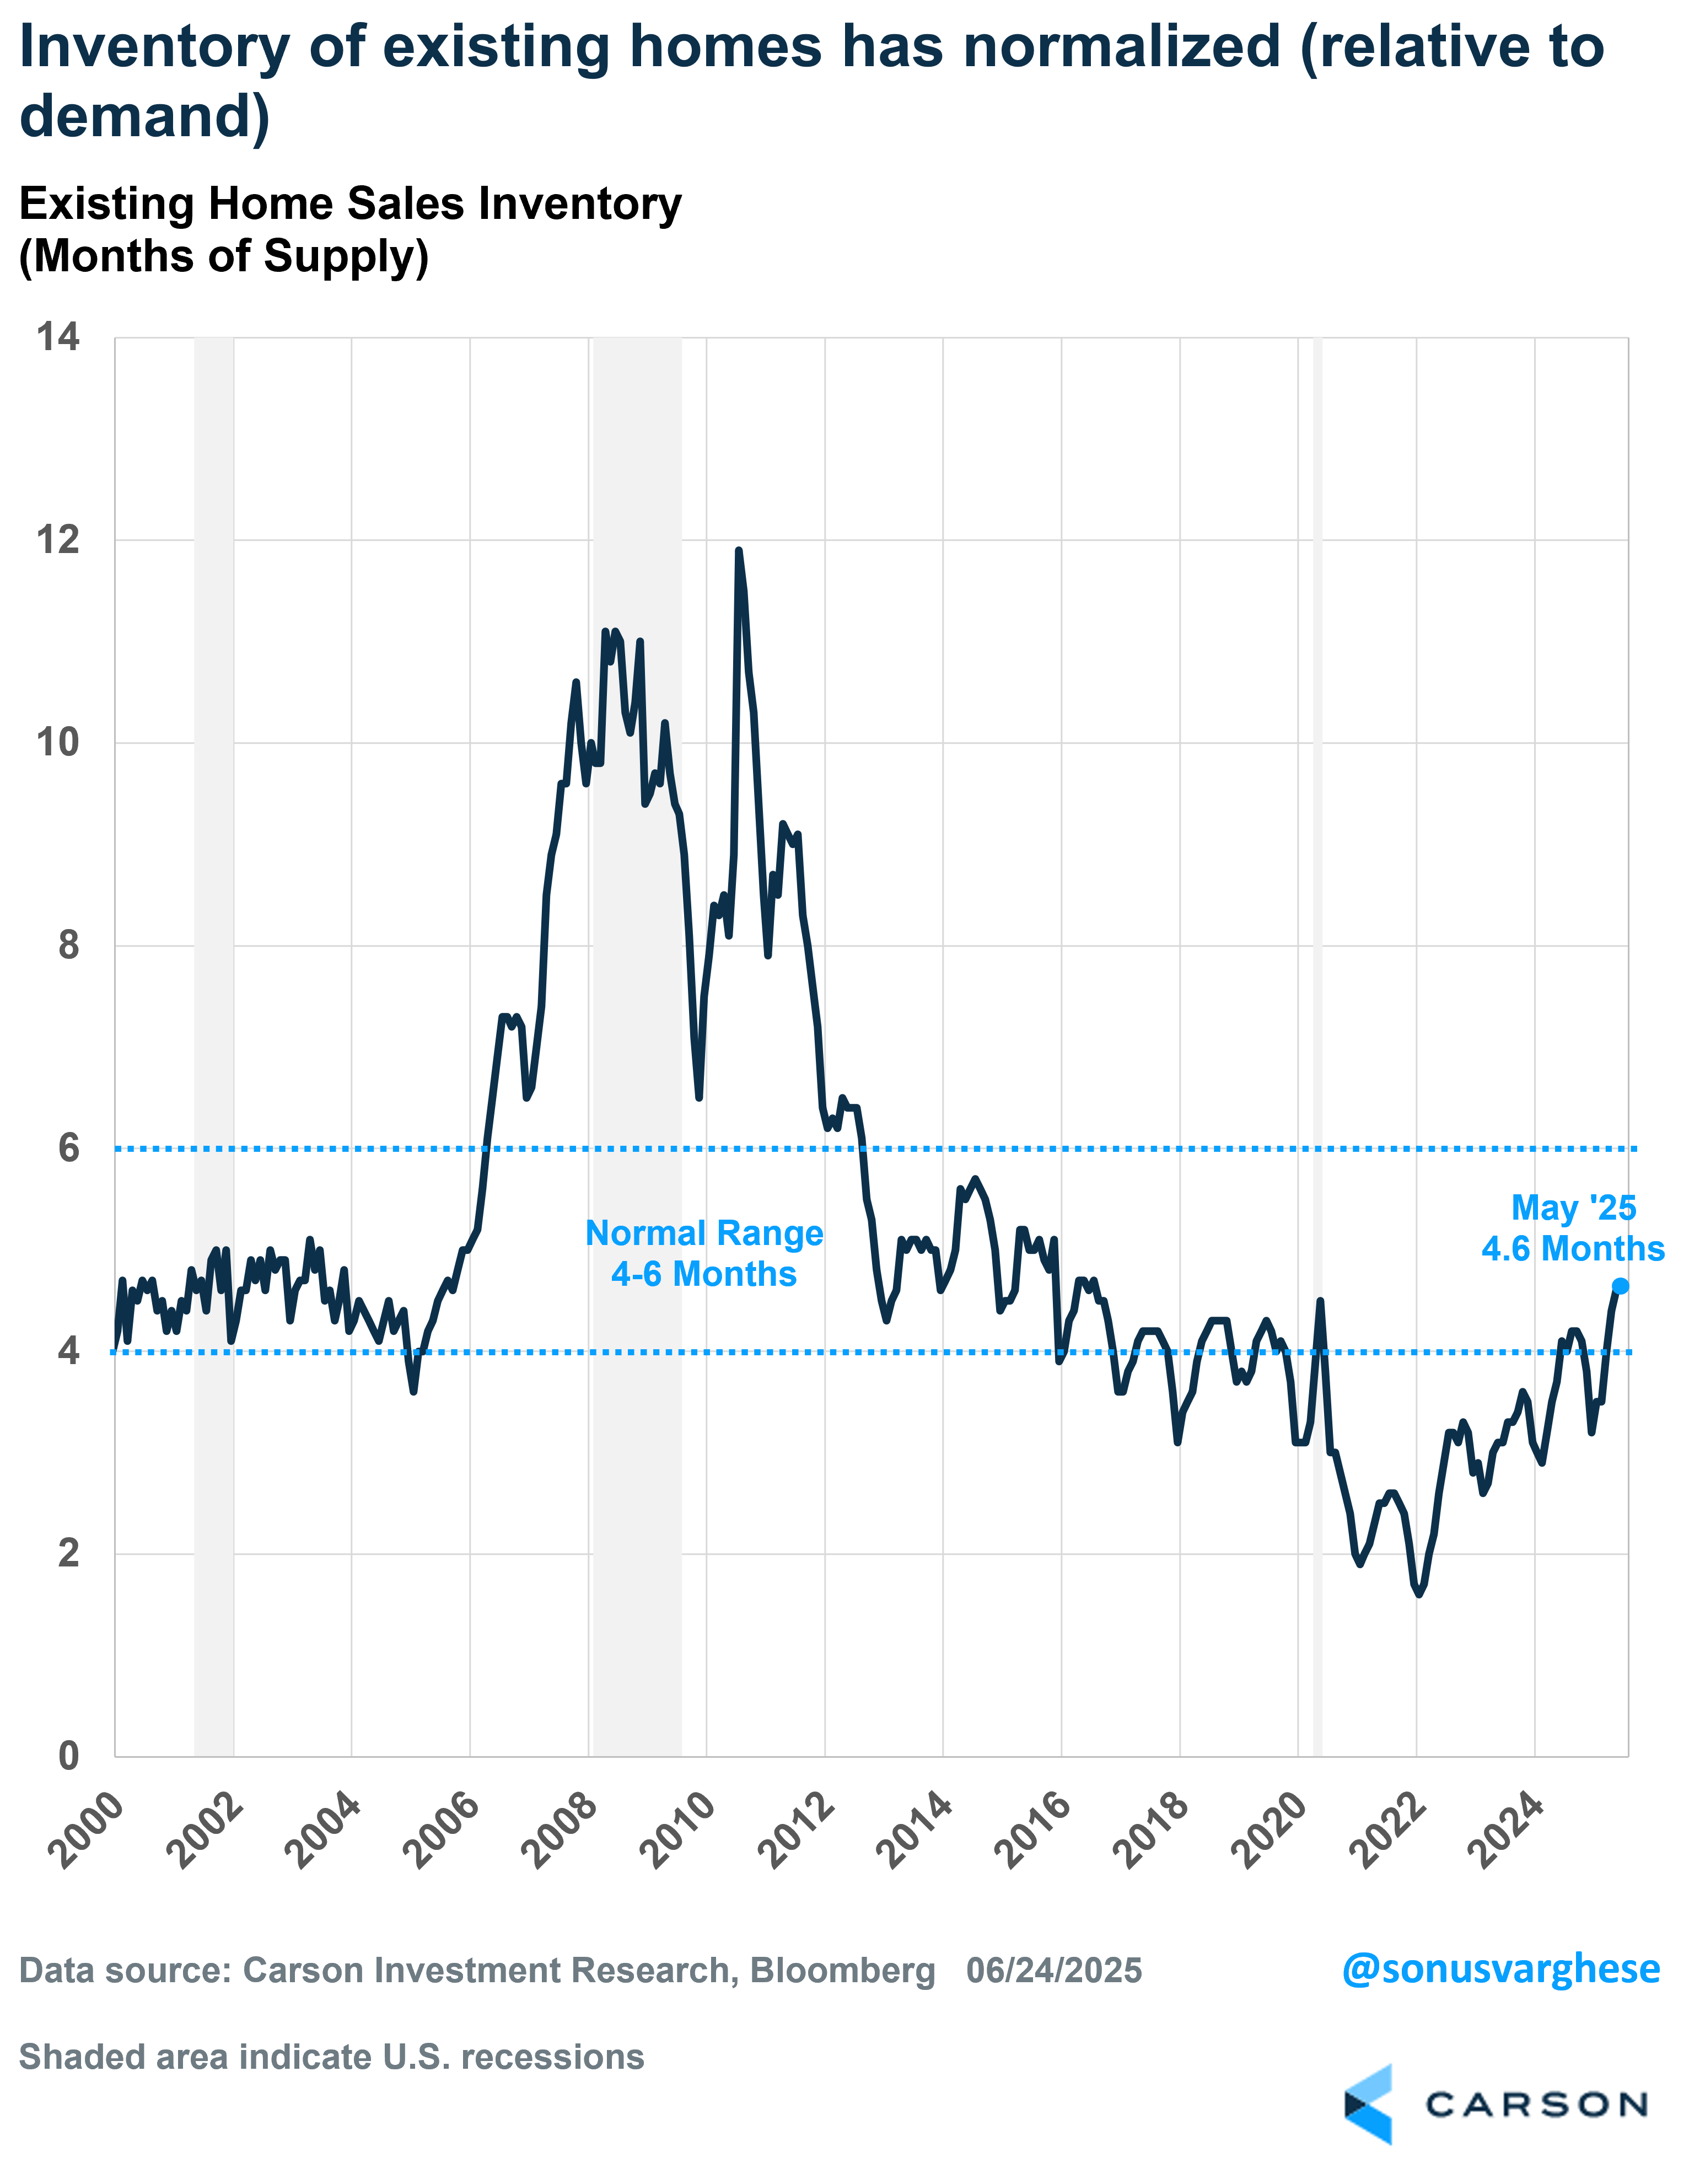
Higher home prices are good for homeowners unless you want to move to another home (because that home is also more expensive) with a higher mortgage rate. Of course, this can go on for only so long. If you have to move, you have to move, and this year we’re starting to see supply increasing. The inventory of existing homes (which widely outnumber new homes) is at 1.54 million as of May 2025, up 20% from a year ago. Inventory is still low relative to history—it’s down 12% from average 2019 levels.
However, if you normalize inventory by sales (months-of-supply at the current sales pace), inventory looks normal. The current months-of-supply is now at 4.6, which is in the normal range of 4-6 months of supply.
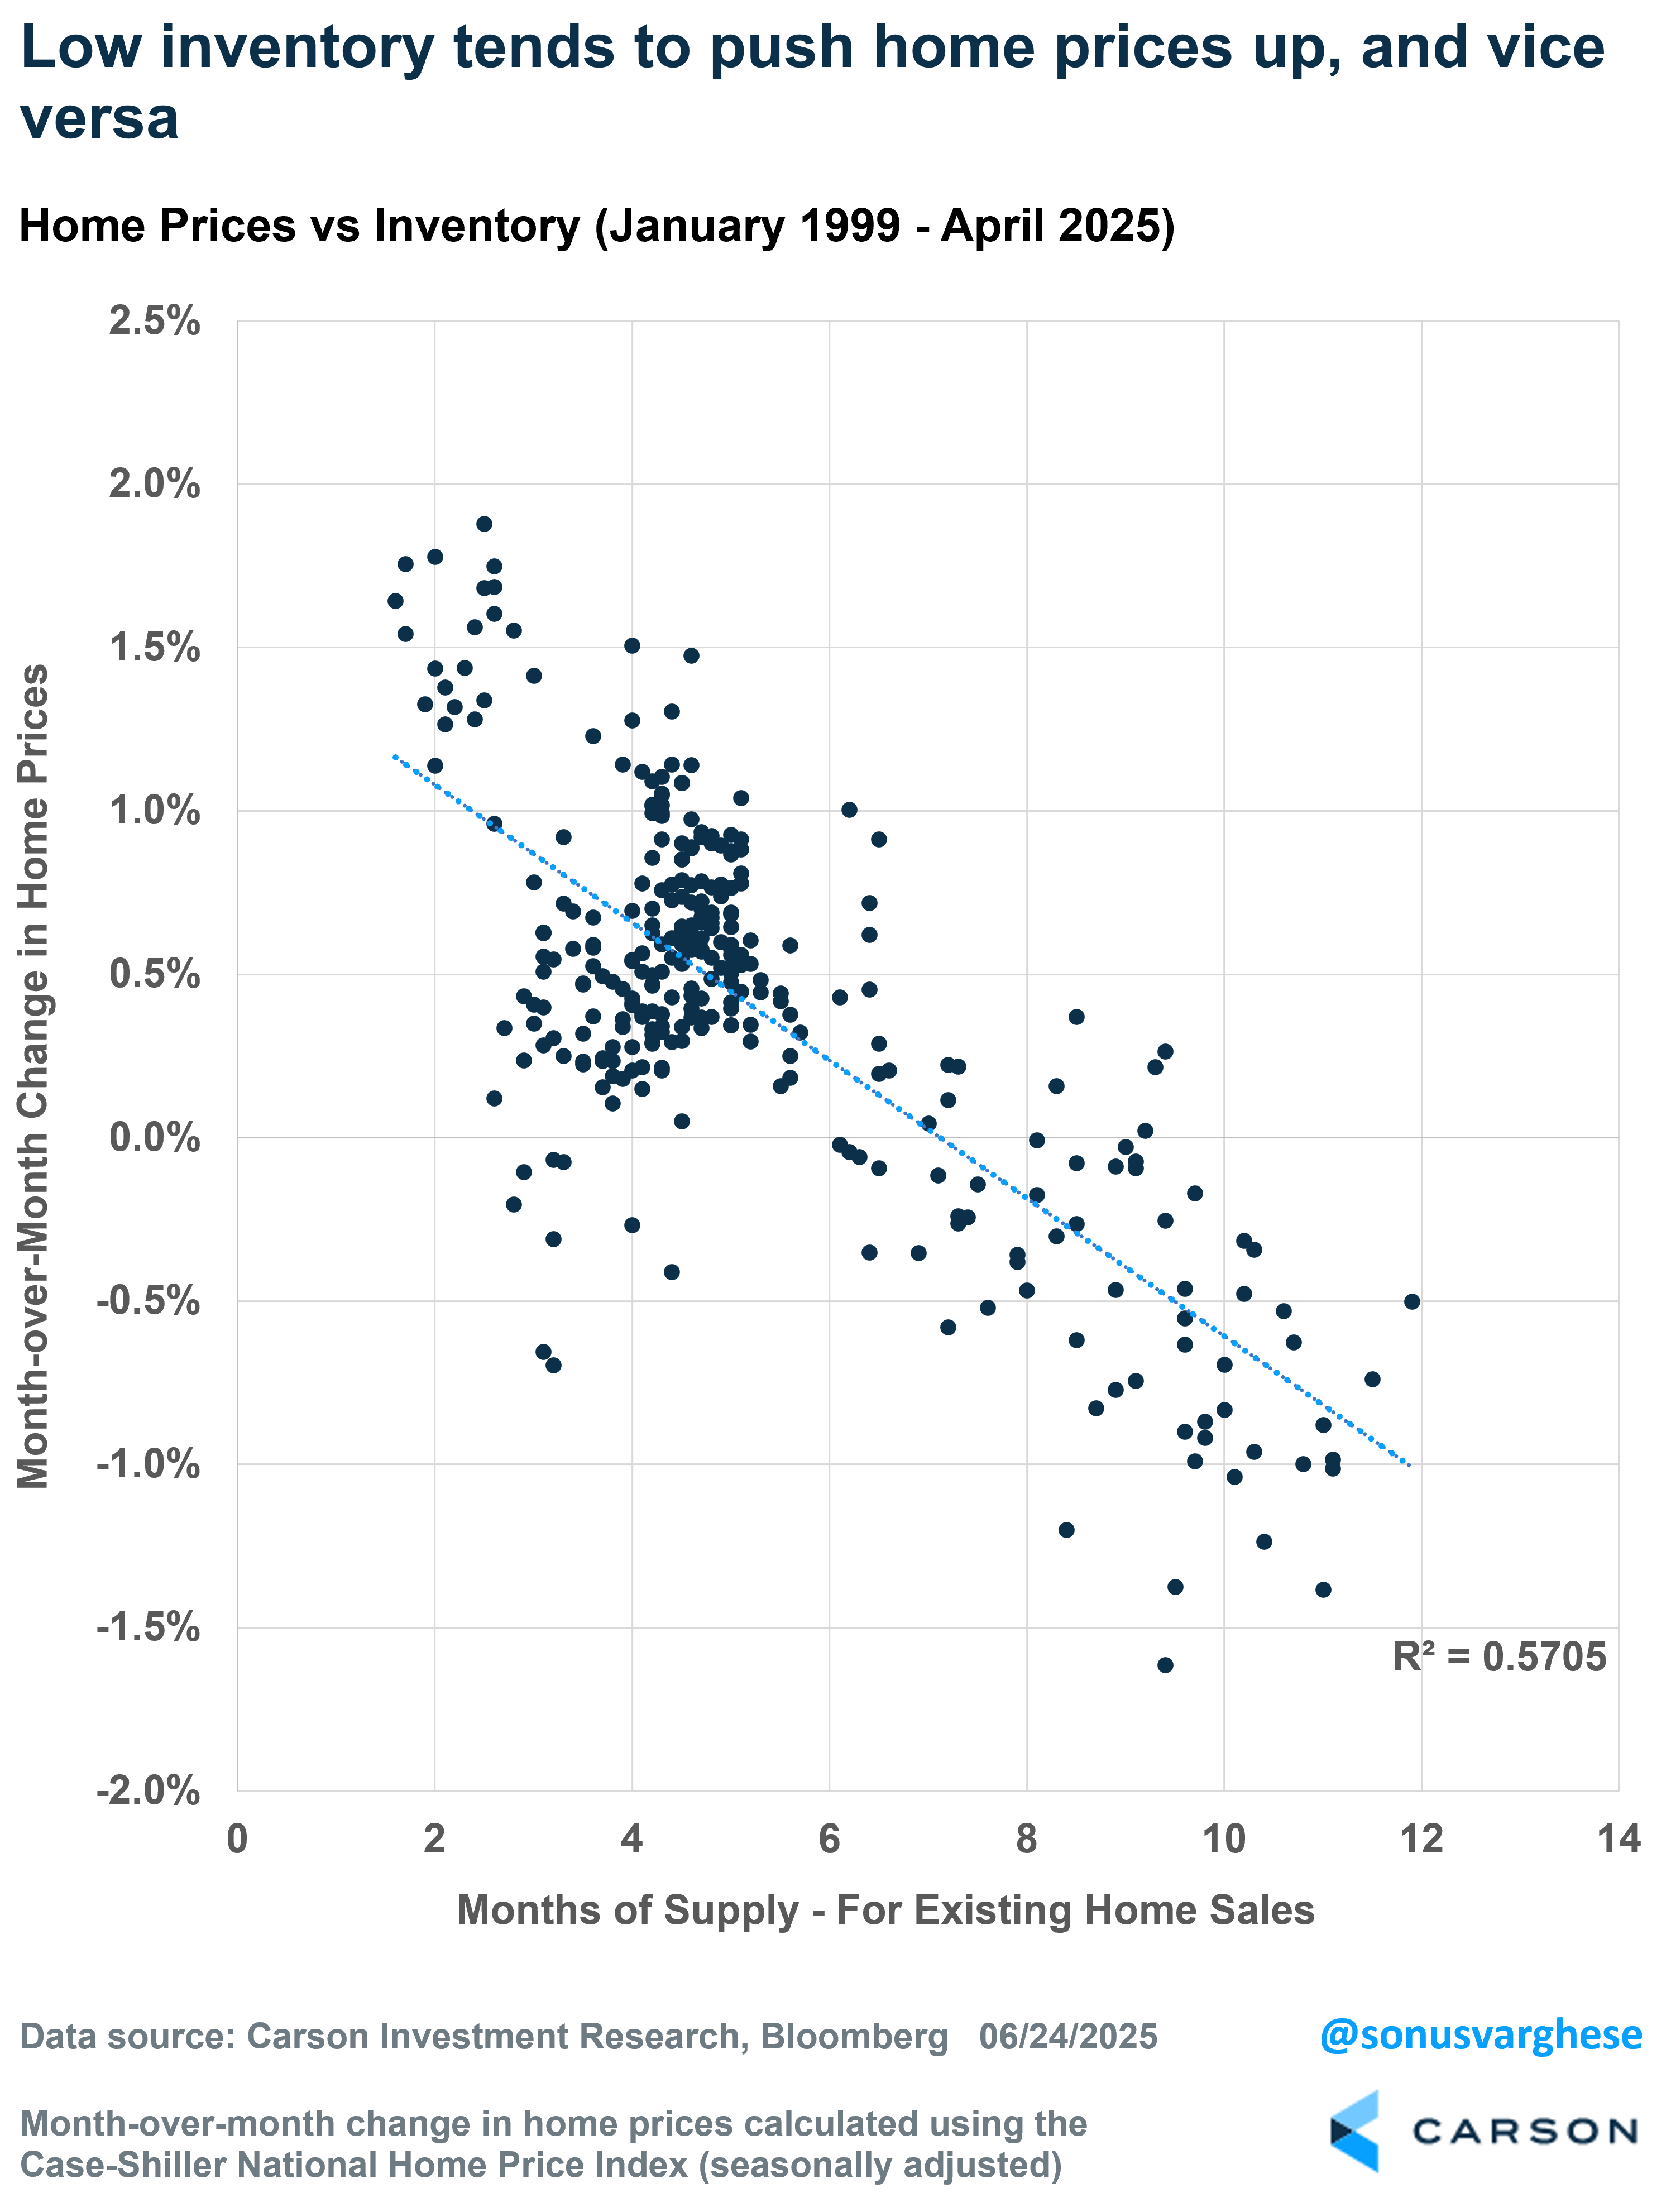
Rising inventory, and normalization, is why home prices are now pulling back. Home prices have historically been inversely correlated with inventory levels. Over the last 25 years, we’ve seen that as inventory pulls back, home prices generally rise, and as inventory rises, home prices ease.
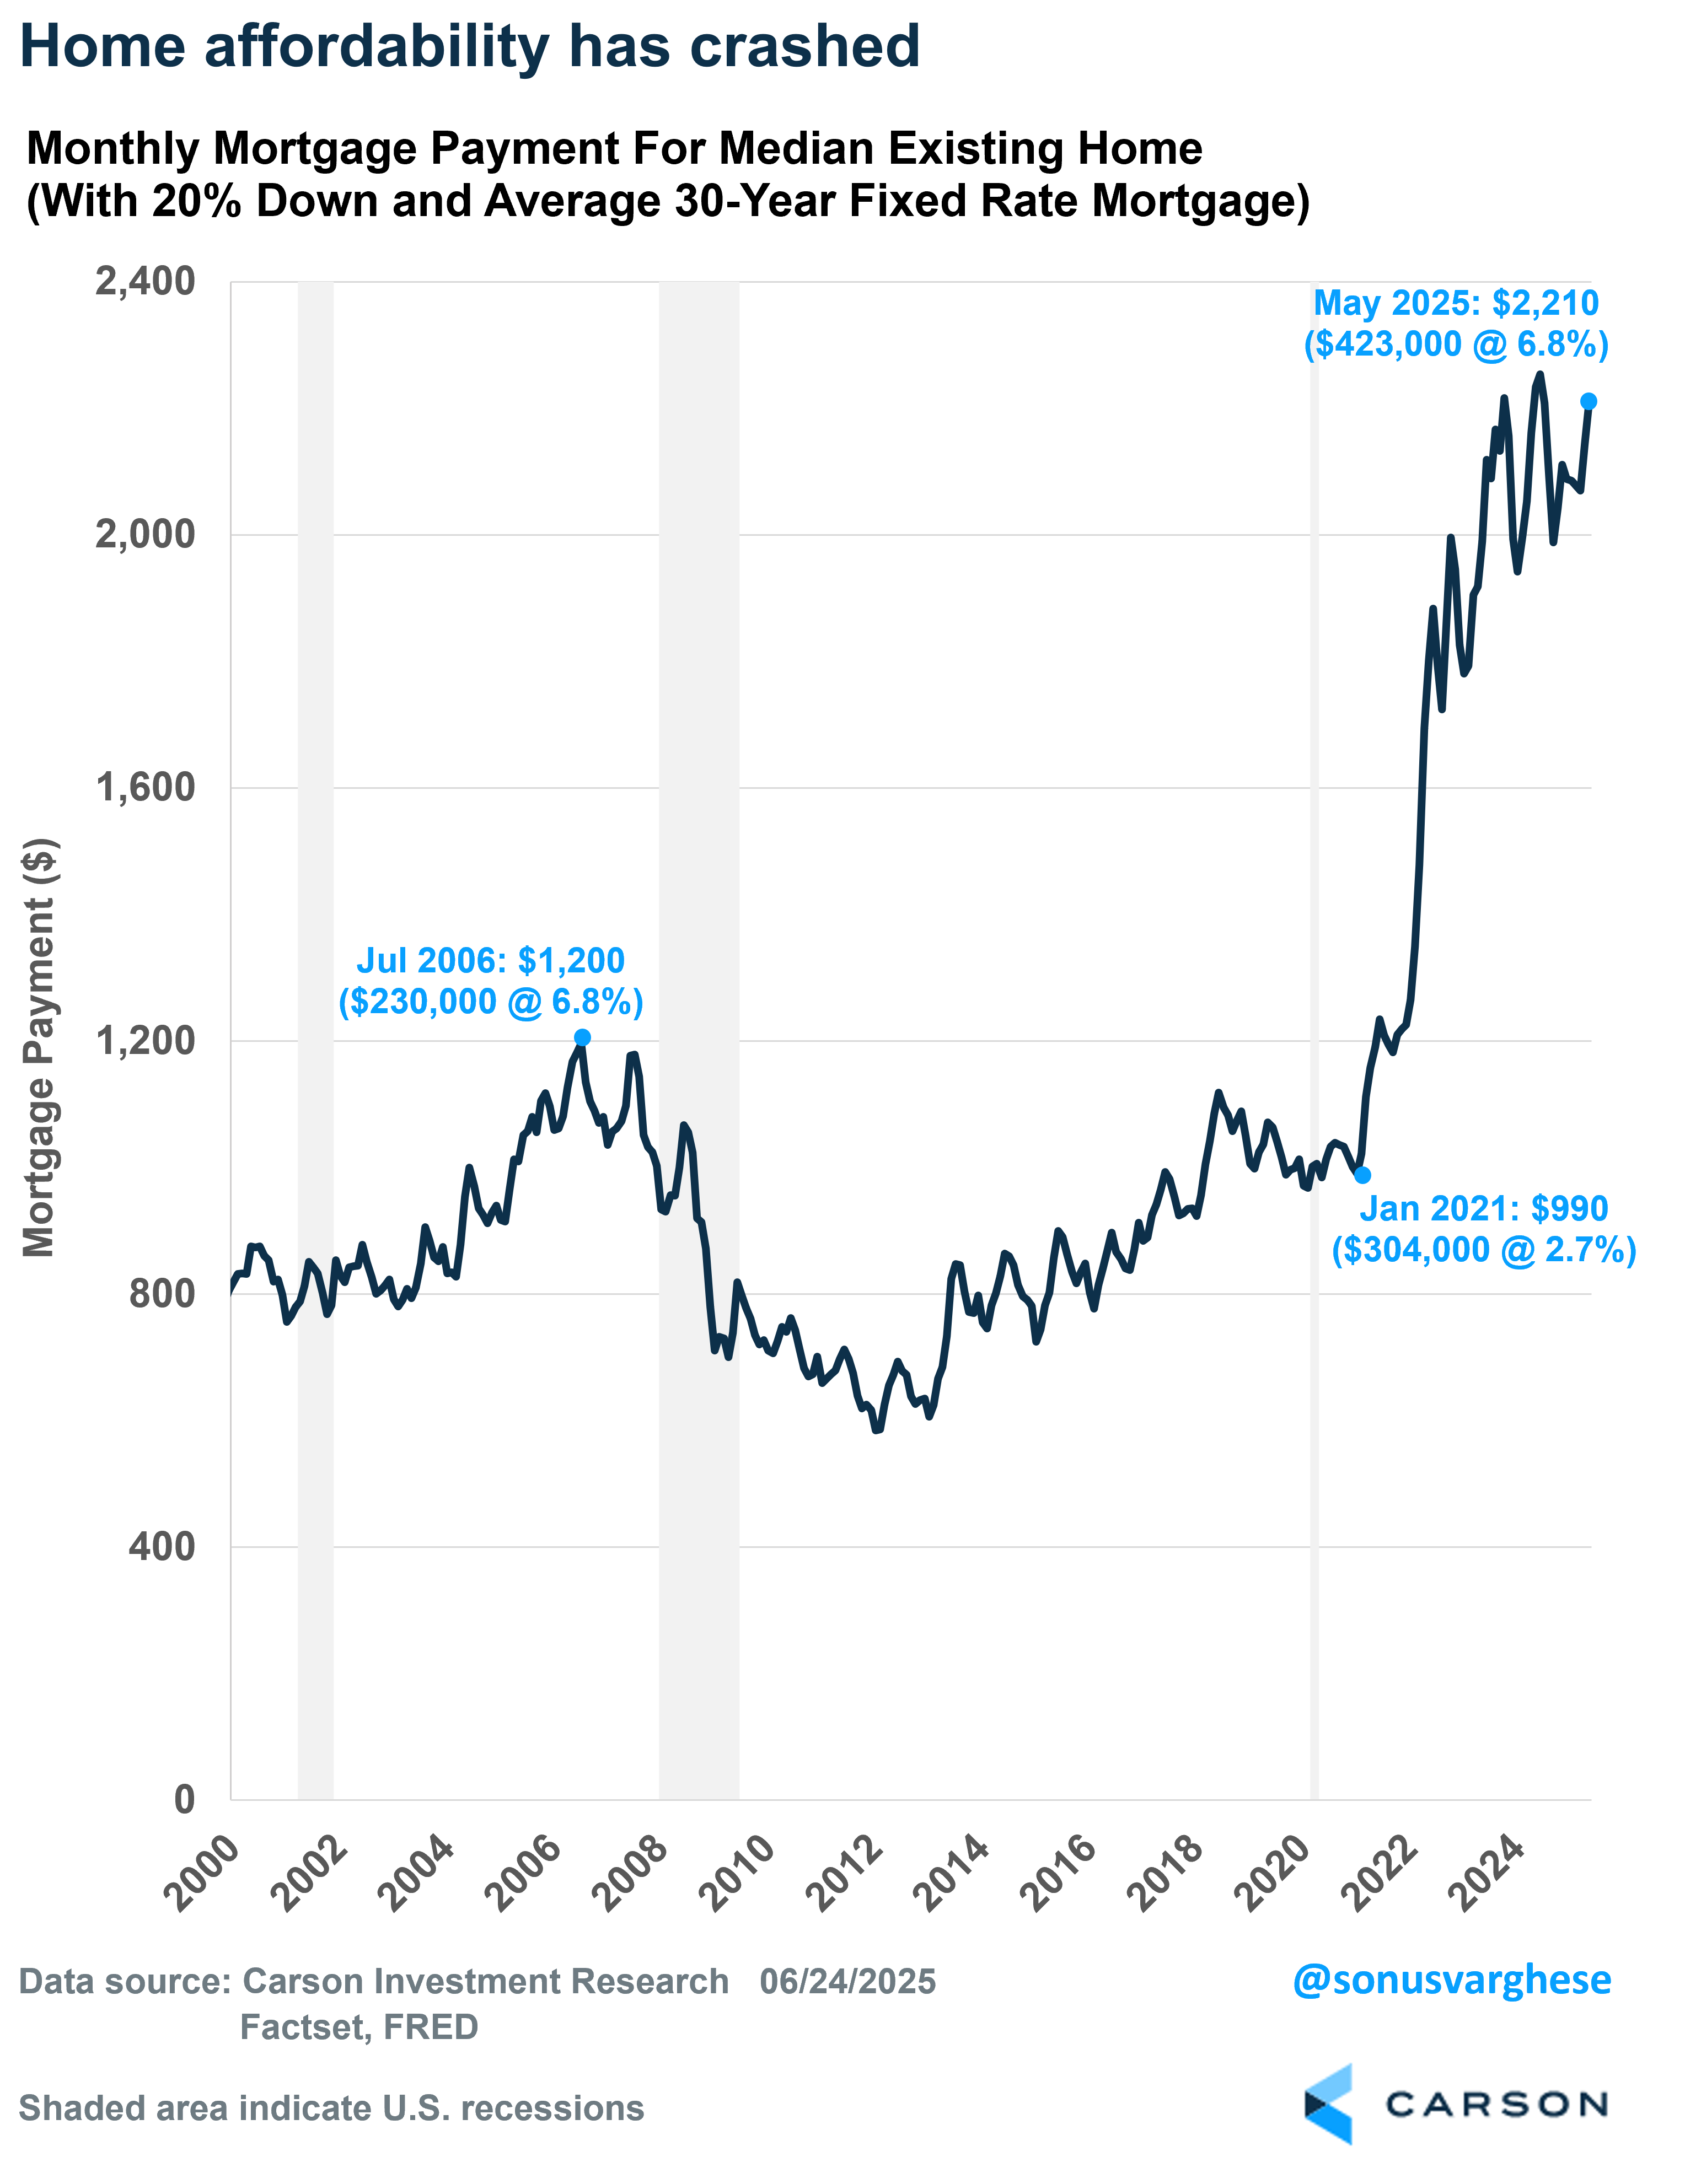
In addition to more supply, demand has been falling. No surprise that it’s being driven by low affordability due to higher home prices and higher mortgage rates. Here’s a comparison of monthly mortgage payments at different times, assuming 20% down, prevailing mortgage rate, and median home price:
- Jan 2021: $990
- Jun 2022: $1,880
- Jun 2024: $2,250
- May 2025: $2,210
Affordability has hardly improved over the last two years. Keep in mind that in 2021 – 2022, wage growth was running around 5 – 6%, but that’s pulled back to below 4% now (using the employment cost index). Meanwhile, mortgage rates have gone in the other direction. Also, the median home price has increased by 49% over the last five years.
Housing, or residential investment, makes up just 4% of GDP, but it’s amongst the most cyclical parts of GDP and can drive changes in GDP growth (up or down). Also, keep in mind that homes are important even beyond the direct impact on GDP growth via new building. It also drives household formation and is an important source of wealth, especially for lower income groups.
However, we now have a potentially toxic combination of:
- High interest rates, with mortgage rates running close to 7%
- Extremely poor home price affordability
- Rising home inventory and a pullback in home prices
- A weakening labor market, with easing wage growth (running well below mortgage rates)
This is not to say we’ll get an immediate economic crash, but there’s a slow burn happening, with risks increasing. But it’s worth discussing how large these risks are (or not).
Stay on Top of Market Trends
The Carson Investment Research newsletter offers up-to-date market news, analysis and insights. Subscribe today!
"*" indicates required fields
Consumer balance sheets are currently in good shape
Here’s a chart I’ve been sharing for a few years now, showing how consumer balance sheets are in really good shape (in aggregate). As of 2025 Q1, net worth as a percent of disposable income is 740%, up from 688% at the end of 2019.

There are 3 reasons for the increase in household net worth over the last five years.
One, lower debt. Liabilities as a percent of disposable income have dropped (thanks to low mortgage rates in 2020-2021) to 93%. It was 101% at the end of 2019, and 137% just before the financial crisis in 2007. That’s one reason why the 2008 – 2009 recession was as bad as it was—households were much more levered and when unemployment rose and home prices fell, everything crashed.
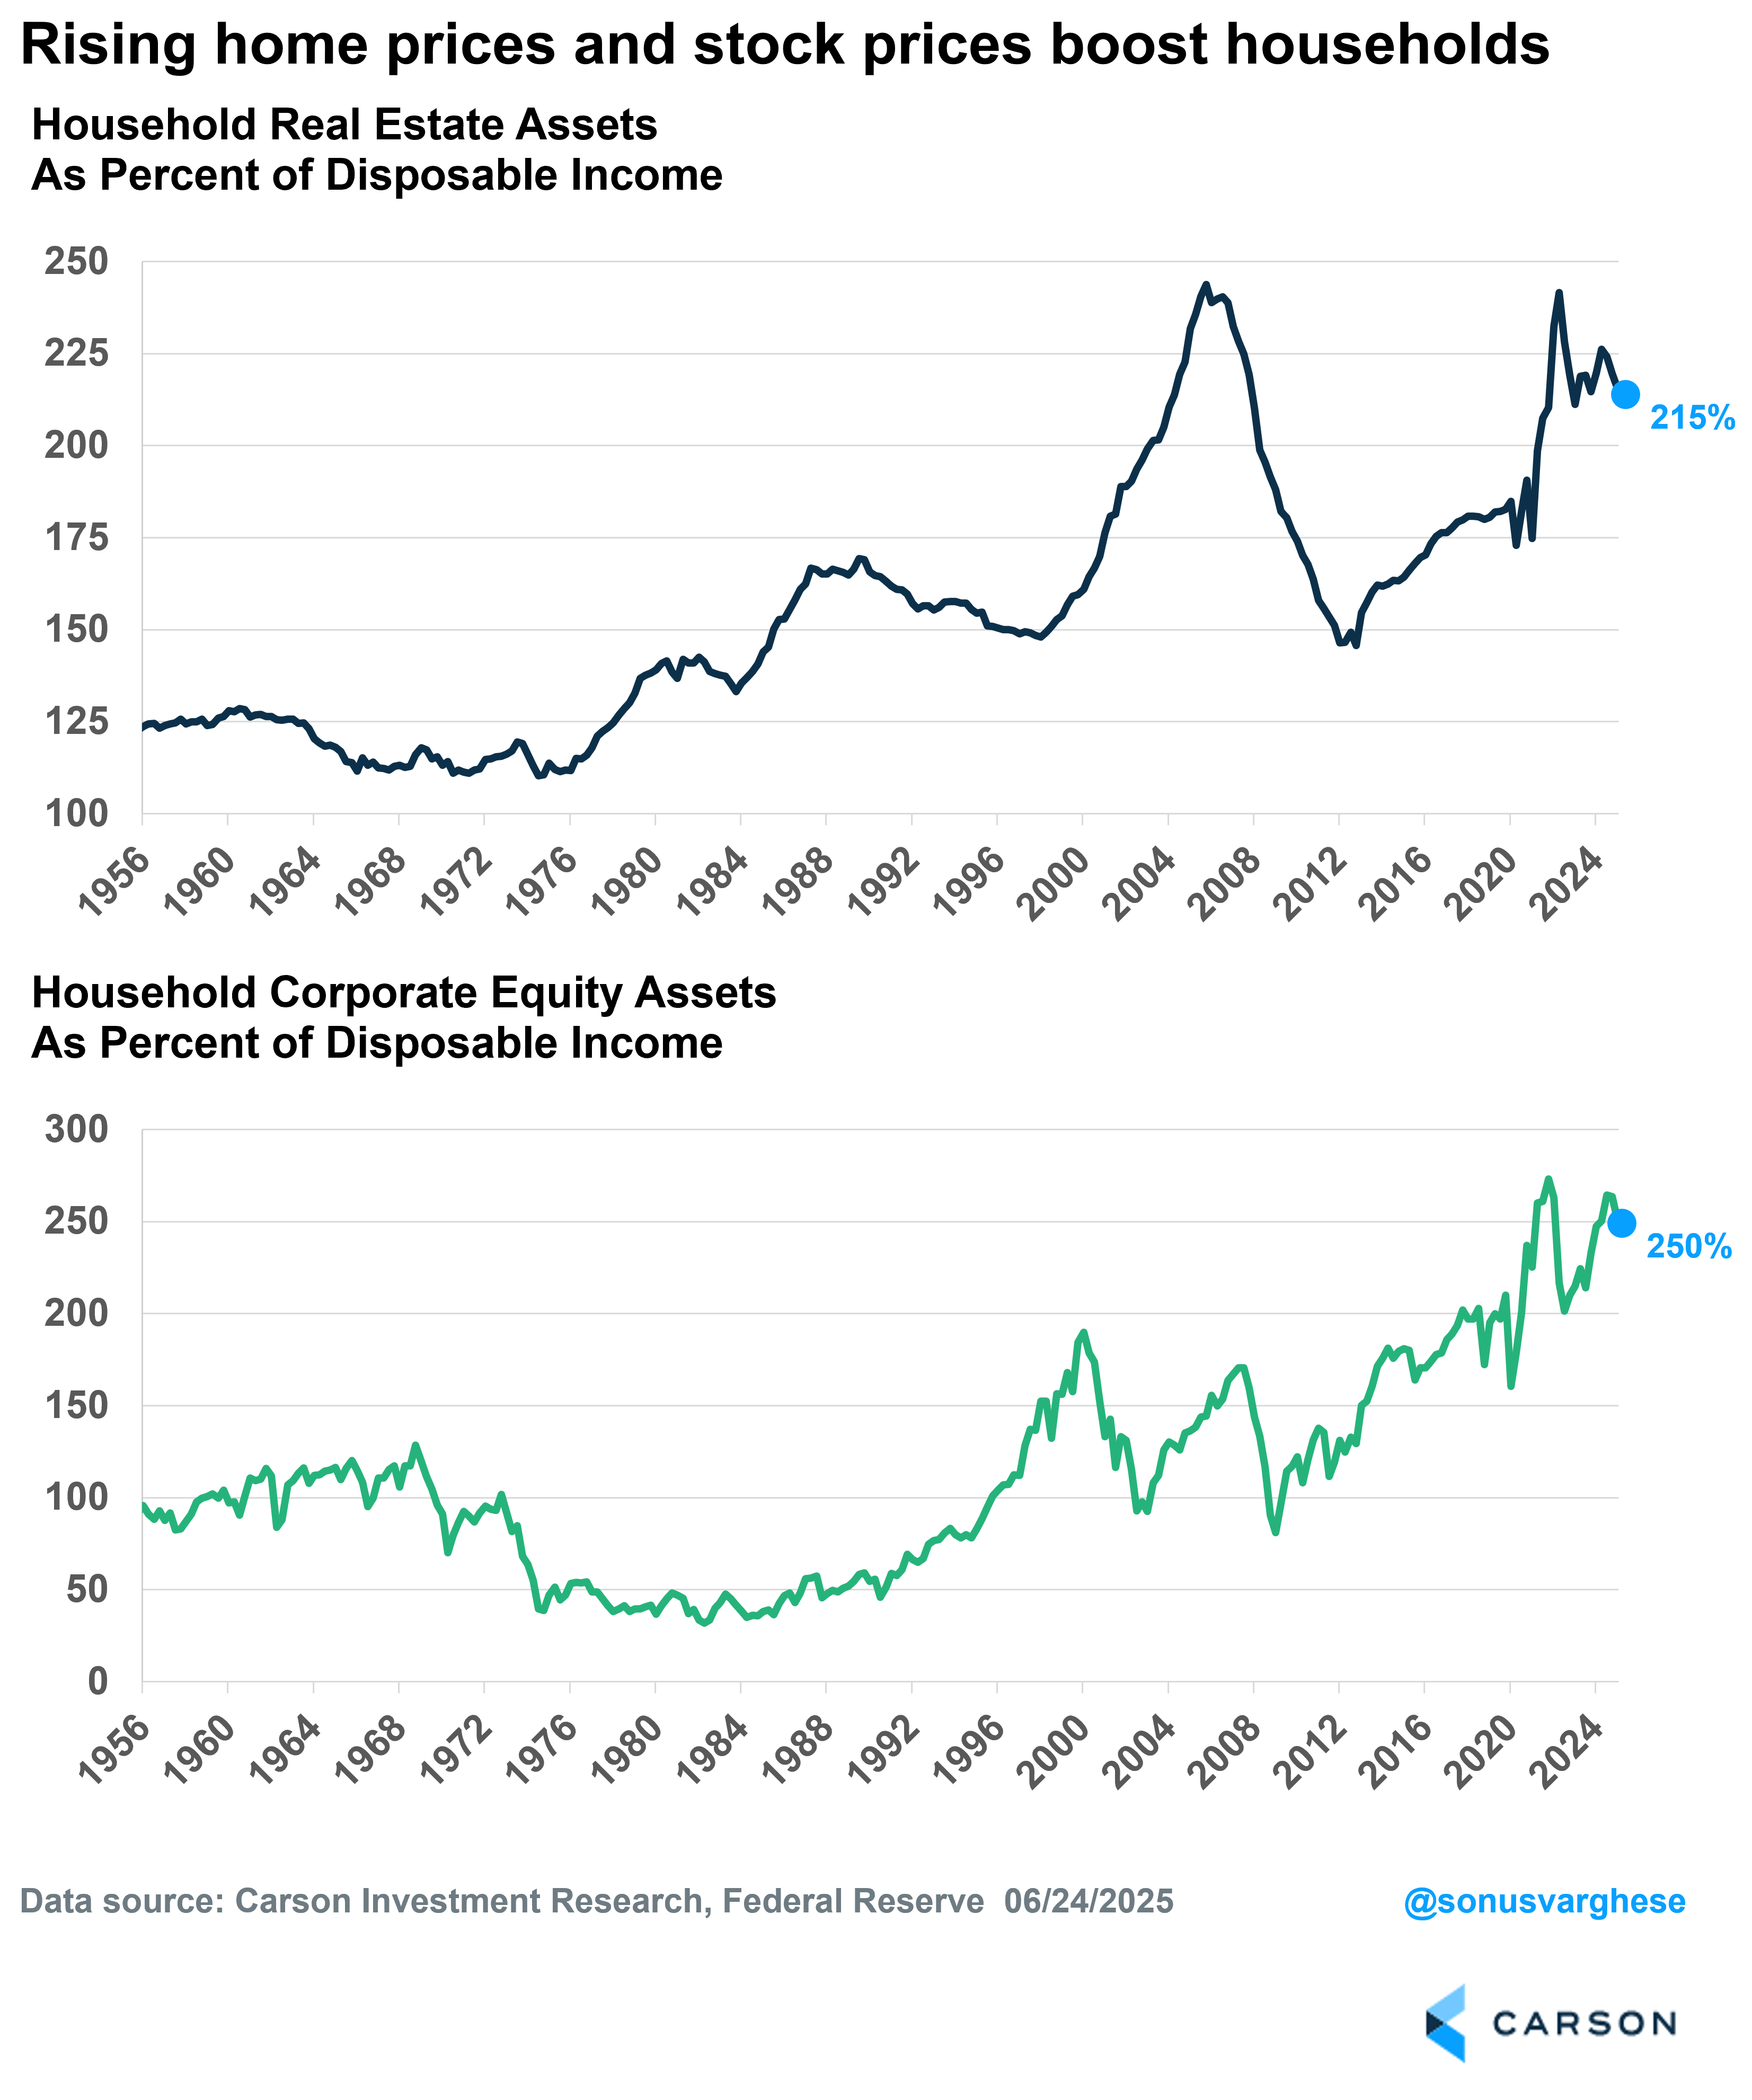
Two, rising home prices. Real estate assets are now at 215% of disposable income. That’s up from 183% at the end of 2019, and close to the 219% back in 2007, except now it’s happened without households taking on as much leverage.
Three, rising stock prices. Equity holdings as a percent of disposable income is at 250%. That’s up from 210% at the end of 2019, and 160% in 2007. Even at the height of the dot-com bubble in 1999, equity holdings as a percent of disposable income was 160%. Note that this is somewhat offset by a falloff in defined benefit pension entitlements, from 99% in 2019 to 73% in 2025 Q1.
Will falling home prices hit consumers hard?
There’s really two questions here that need to be answered to understand how much consumer balance sheets could potentially be hit by falling home prices.
One, assuming home prices fall, the big question is how much. As I discussed above, inventory is rising, which is why there’s downward pressure on home prices. Demand is also down amid poor affordability, but supply is also relatively low. I think that should prevent huge home price declines, like the kind we saw back during the housing crash. The Case-Shiller National home price index declined by a cumulative 26% between 2007 and 2012—it’s unlikely we see anything of that magnitude in this cycle.
Two, how levered households are. The greater the leverage, the harder the crash (like in 2008-2009). As I noted above, aggregate liabilities as a percent of disposable income are running at the lowest levels since the late 1990s. This is not to say there won’t be a hit to consumer balance sheets, but the impact is likely to be less, especially if home price declines are on the milder side.
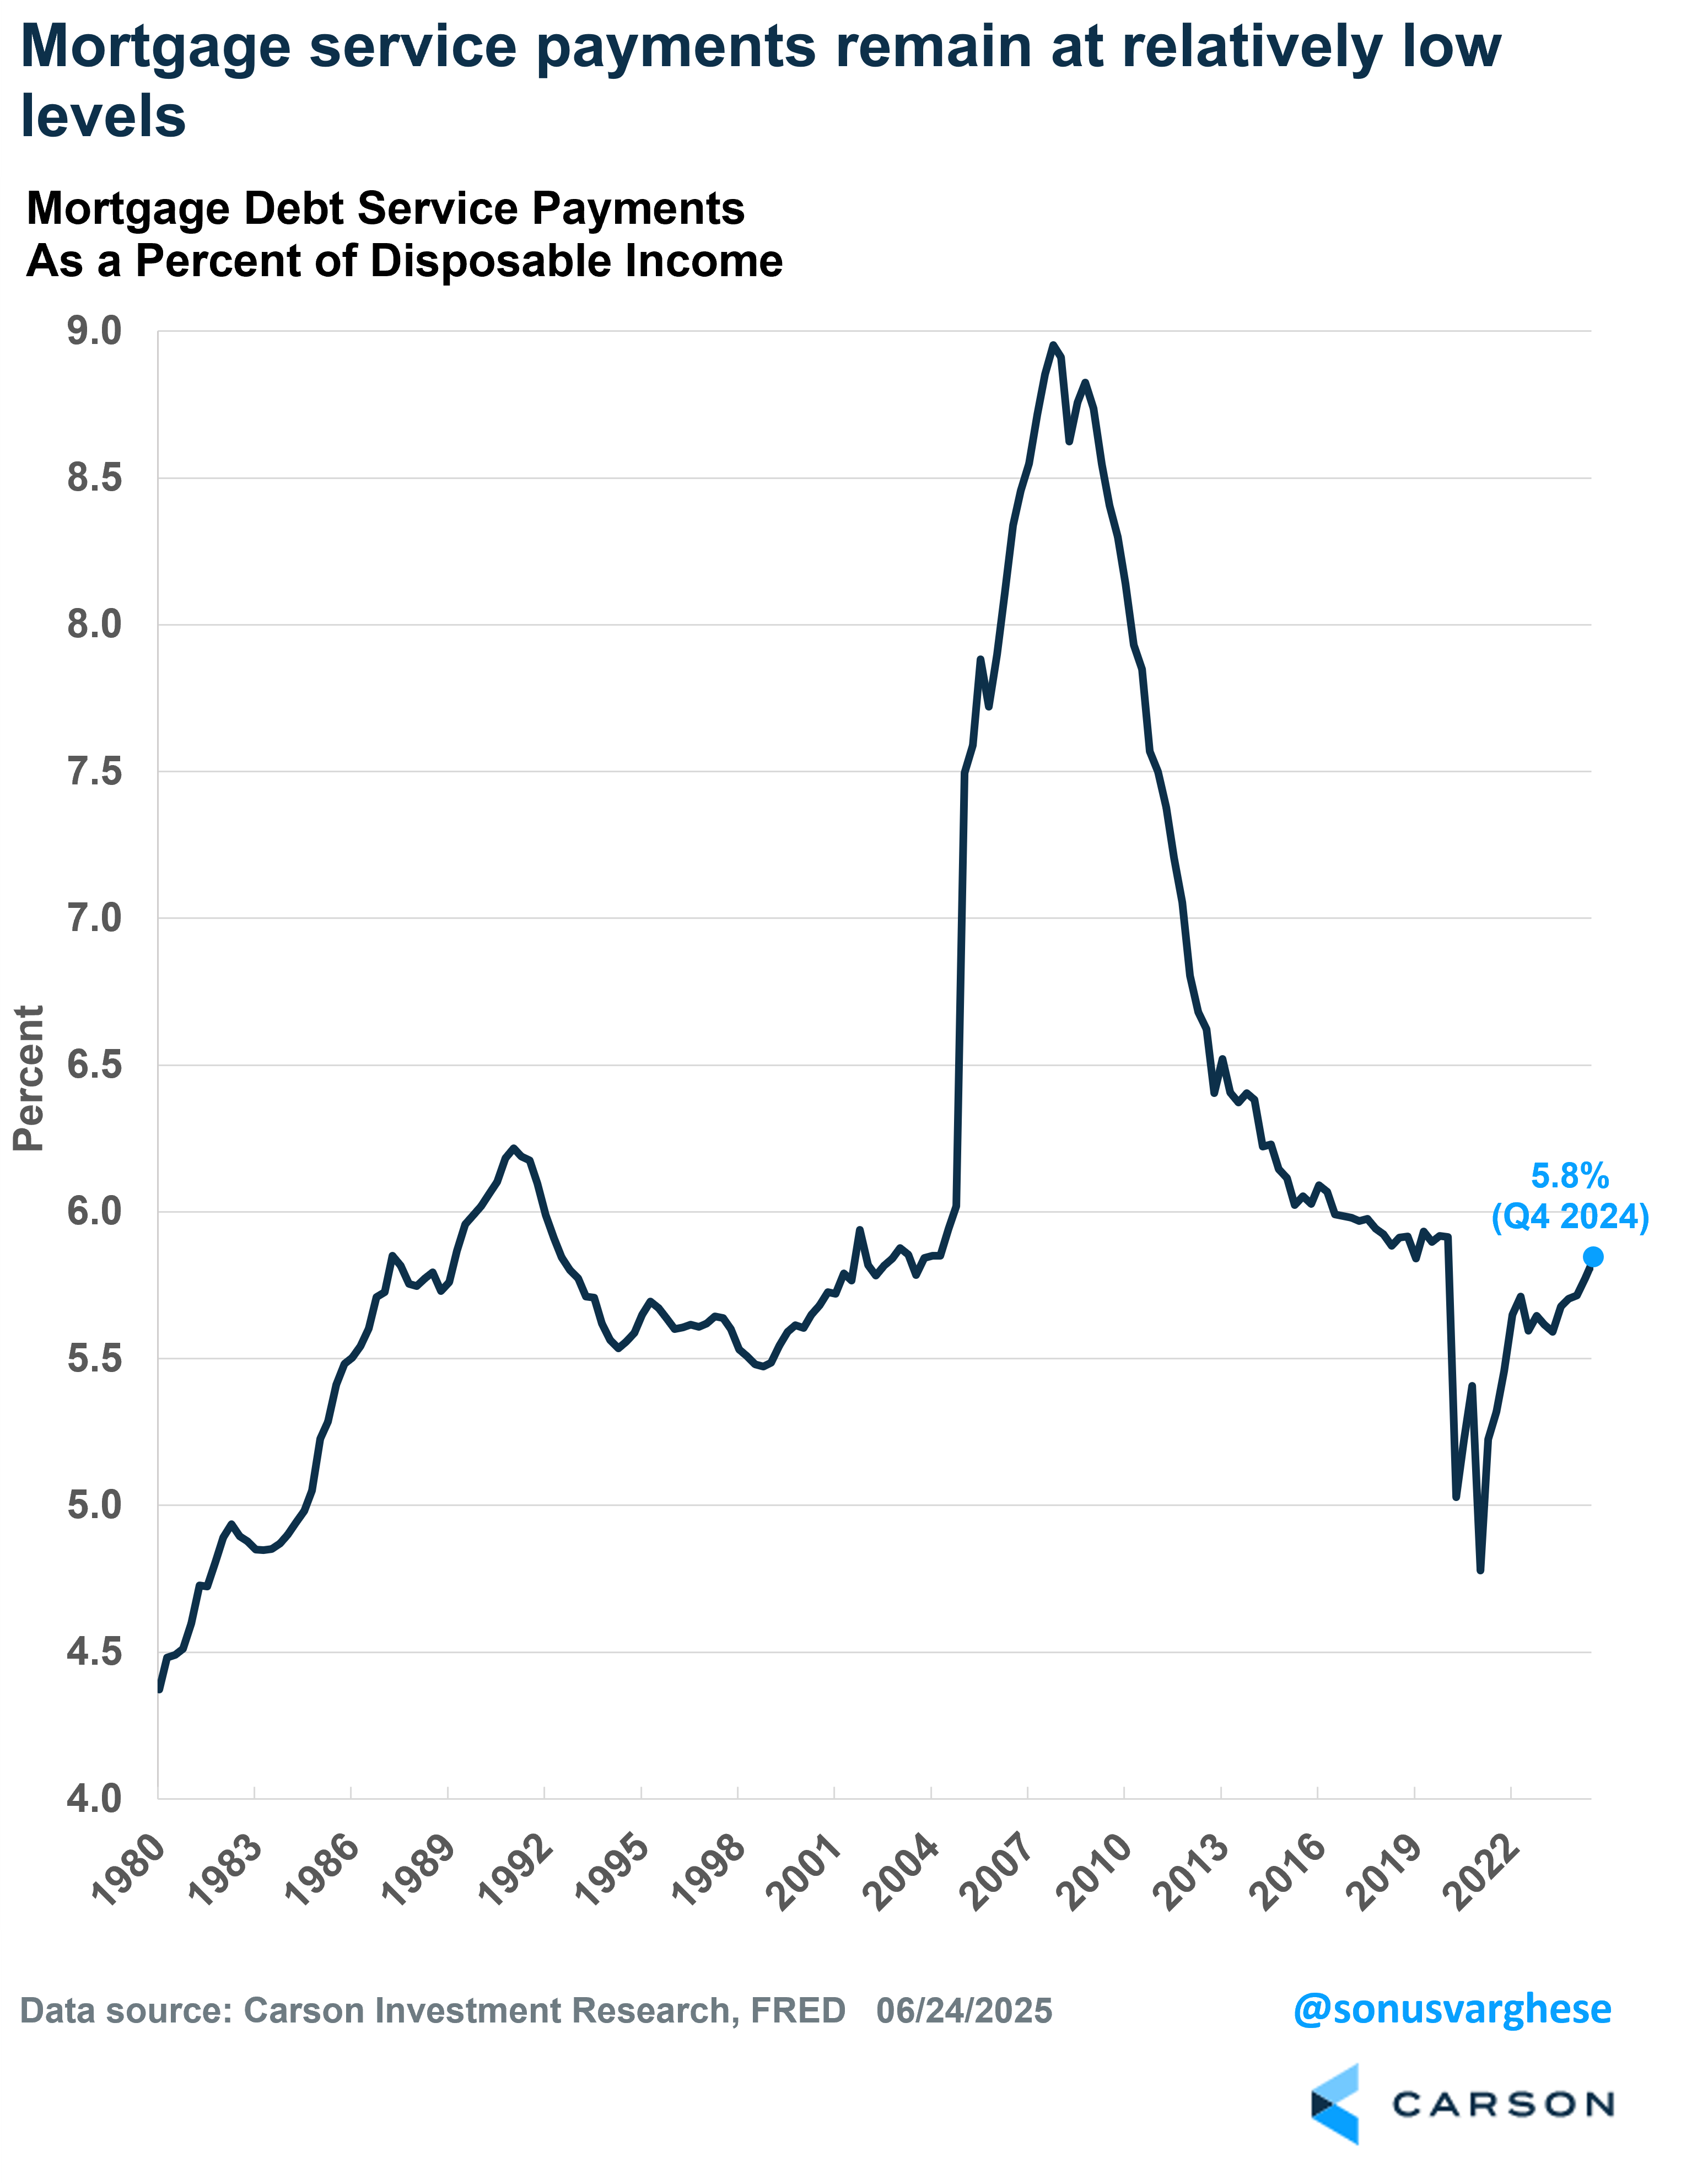
Keep in mind that households already have a significant amount of home equity, not to mention the fact that most households (at least those who bought or refinanced prior to 2022) have mortgage payments less than 8-12% of household income (on average). Mortgage service payments (and mortgages are the bulk of household liabilities) are running less than 6% of disposable income. That’s below what we saw in 2019, and that came at the end of a deleveraging cycle when households were trying to rebuild their balance sheets after the Great Recession (when stocks and home values crashed).
What could upset the apple cart? A bear market
In my opinion, a bear market, and especially a sustained one, would be extremely detrimental to household balance sheets. As I discussed above, the biggest driver of net worth over the last five years has been rising stock prices. Some of this has gone to offset the fact that defined benefit pension plans have greatly declined, with business focusing more on defined contributions to retirement accounts instead. Equities make up over a third of net worth as a percent of disposable income. That’s massive.
But it also means that a sustained bear market could send things the other way. Obviously all of this feeds on itself, and we could end up in a vicious cycle of:
- Rising unemployment ->
- Falling aggregate income ->
- Lower spending ->
- Lower profit growth, if not an outright decline ->
- Bear market ->
- Weaker household balance sheets (including from falling home prices) ->
- Lower spending ->
- Lower revenues and hiring -> Back to top
Once the process starts, it can feed on itself. An external catalyst is needed to put sand into the gears of this negative feeedback loop so it can’t get going, whether its rate cuts (which should boost housing earlier than any other sector) or fiscal support.
Right now, this kind of vicious cycle is not our base case, which is not to say we won’t have market volatility. But for stock prices to really damage household balance sheets, we would need to see a sustained bear market that lasts a lot longer than recent bear markets (or near bear markets where the S&P 500 just misses 20% drawdown).
8108051.1.-06.25.25A
For more content by Sonu Varghese, VP, Global Macro Strategist click here