The inflation data doesn’t look good, no matter how you slice it. The headline Consumer Price Index (CPI) rose 0.64% in July (equivalent to 8% annualized rate), with the three-month annualized pace running at 7.3%. CPI is now up 3.8% over the past year, the highest reading since May 2023.
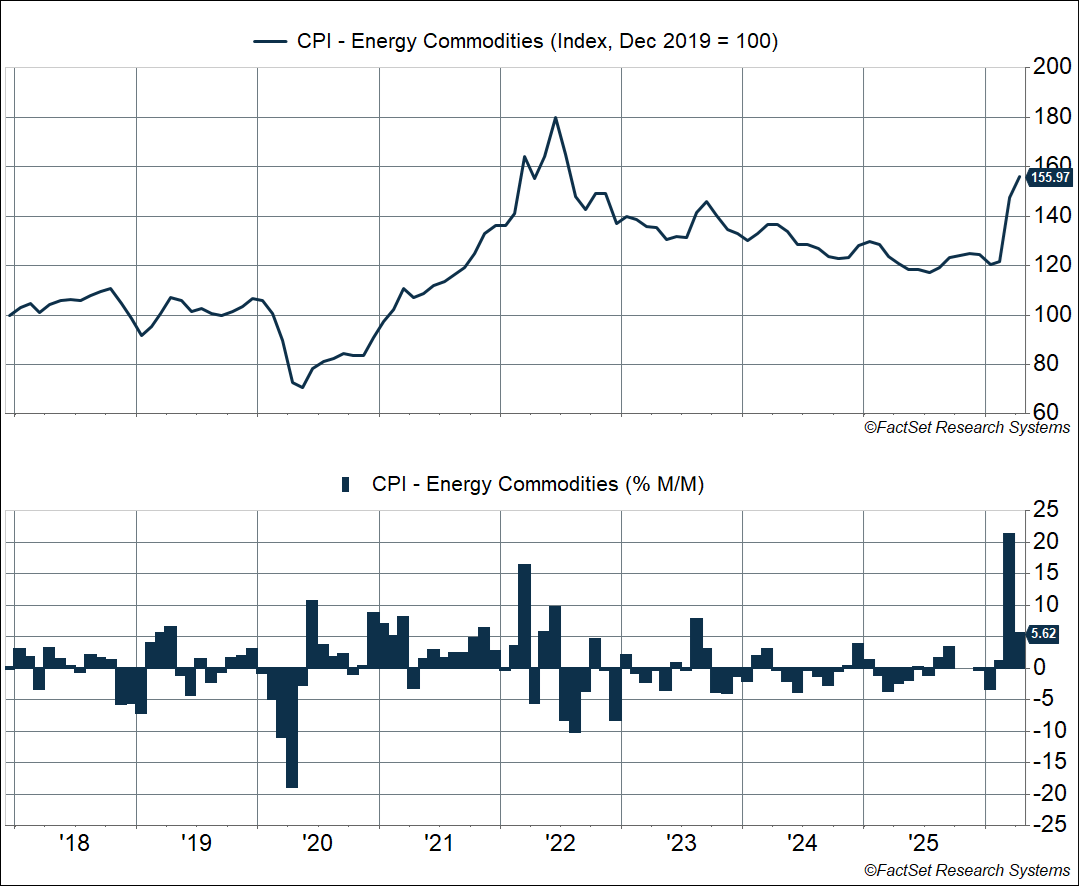
The big driver here is energy, with gasoline prices rising over 5% in April, on the back of a 22% increase in March (which was higher than any single month in 2022). Energy commodities (which include gasoline and fuel oil) have now increased more than 28% over the past two months, taking prices to the highest level since July 2022. Back in 2022, prices rose 32% over the first six months of the year. This current spike is larger, and it’s happening quickly.
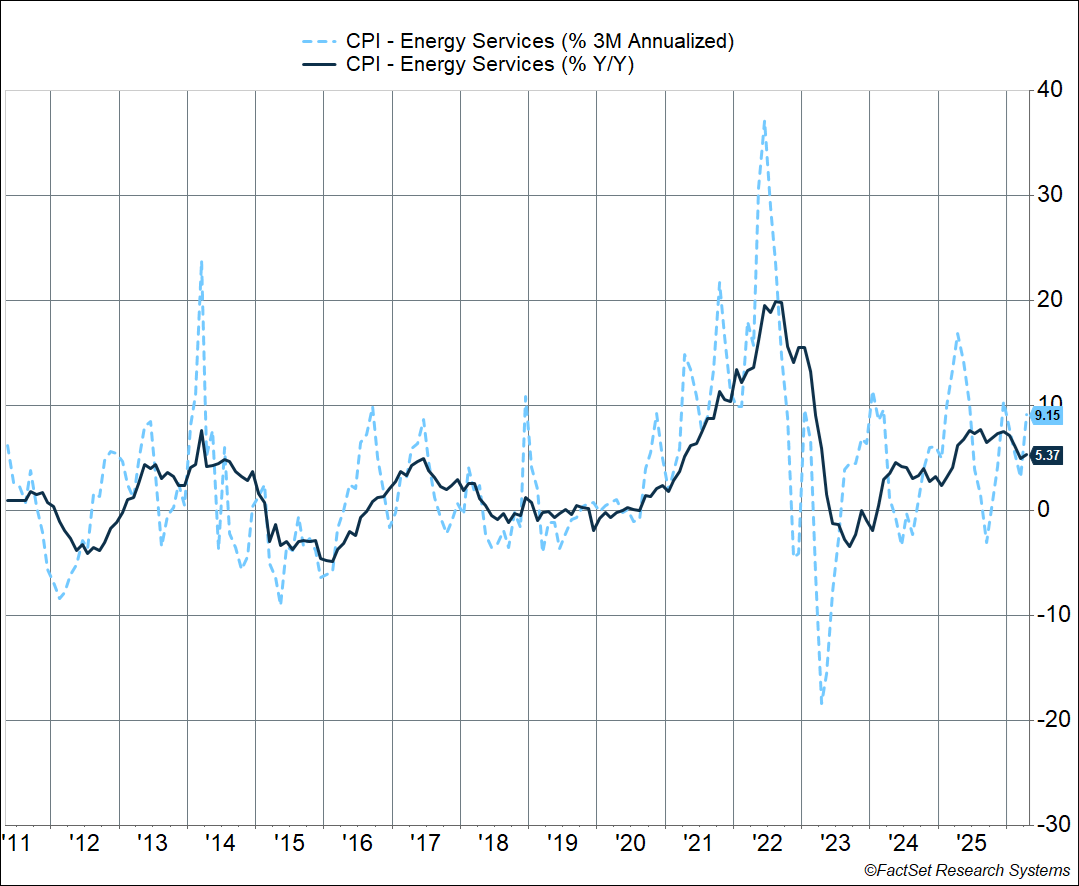
On top of that, energy services inflation (electricity and utilities) is also elevated, rising at a 9.2% annualized pace over the past three months and 5.4% over the past year.
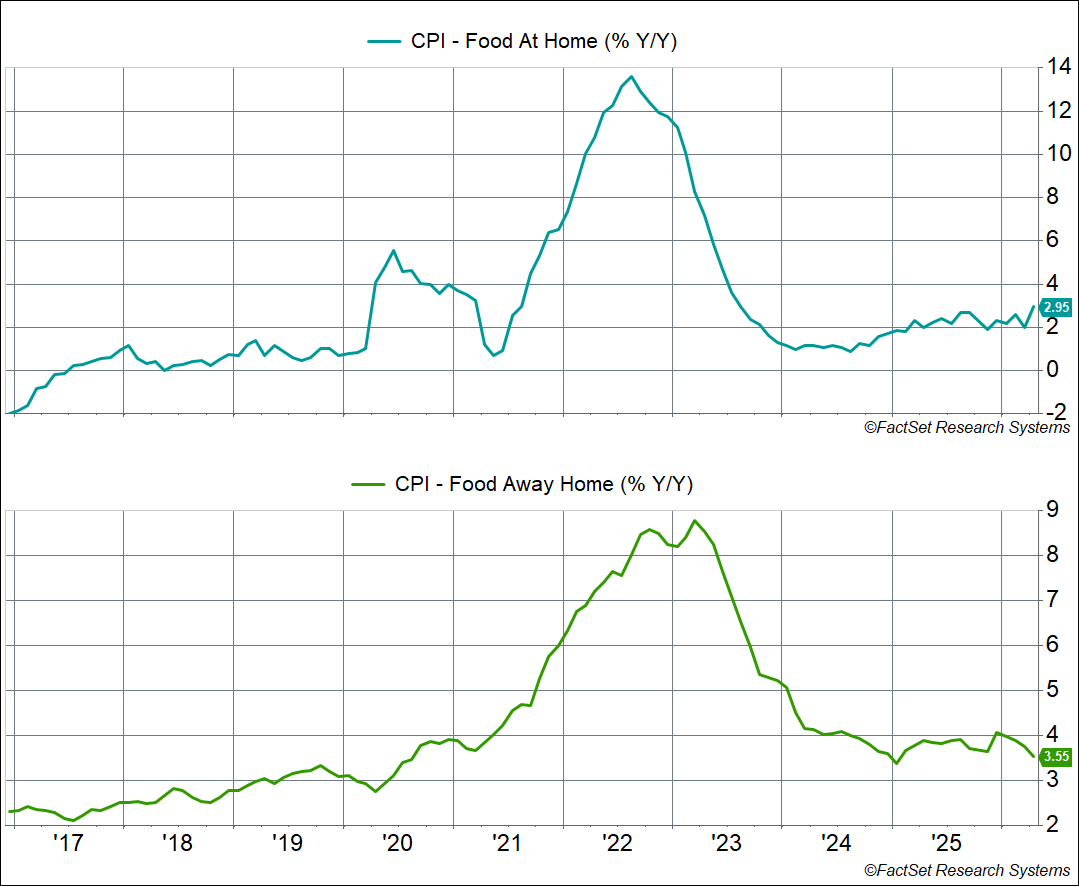
Meanwhile, food prices (both grocery and restaurant prices) are also rising at a hot clip. Before the pandemic (2017-2019), grocery inflation (food at home) ran at an average annualized pace of 0.4%, and inflation for food away from home ran at 2.7%. We’re well above that now.
- Food at home inflation is up 3.9% annualized over the last three months, and 3.0% year over year. Inflation’s running really hot for several popular items:
- Meats: +8.8% y/y
- Fresh vegetables: +11.5% y/y
- Tomatoes: +39.7% y/y
- Lettuce: +7.9% y/y
- Coffee: +18.5% y/y
- Food away from home inflation is up 3.2% annualized over the last three months, and 3.6% year over year.
It’s too early for elevated food price inflation to be a direct consequence of the Middle East war and higher energy prices. While higher prices for diesel (used for transportation) and fertilizer (a by-product of natural gas) should impact food prices, that’s probably further down the road. Of course, that means we could be in store for a more prolonged period of food inflation.
All of the above is stuff that is excluded from “core” inflation, since they’re traditionally more volatile. But the reality is that these are everyday items that make up a sizable portion of household budgets – energy (commodities and services) and food make up 20% of the CPI basket. Rising inflation for these items puts a real strain on households.

Stay on Top of Market Trends
The Carson Investment Research newsletter offers up-to-date market news, analysis and insights. Subscribe today!
"*" indicates required fields
Keep in mind that the Fed targets headline inflation (though their preferred metric is the Personal Consumption Expenditures Price Index). They focus on core inflation only to gauge the underlying trend. That trend isn’t good.
Core Inflation Also Has a Lot of Problems, and Widespread Heat
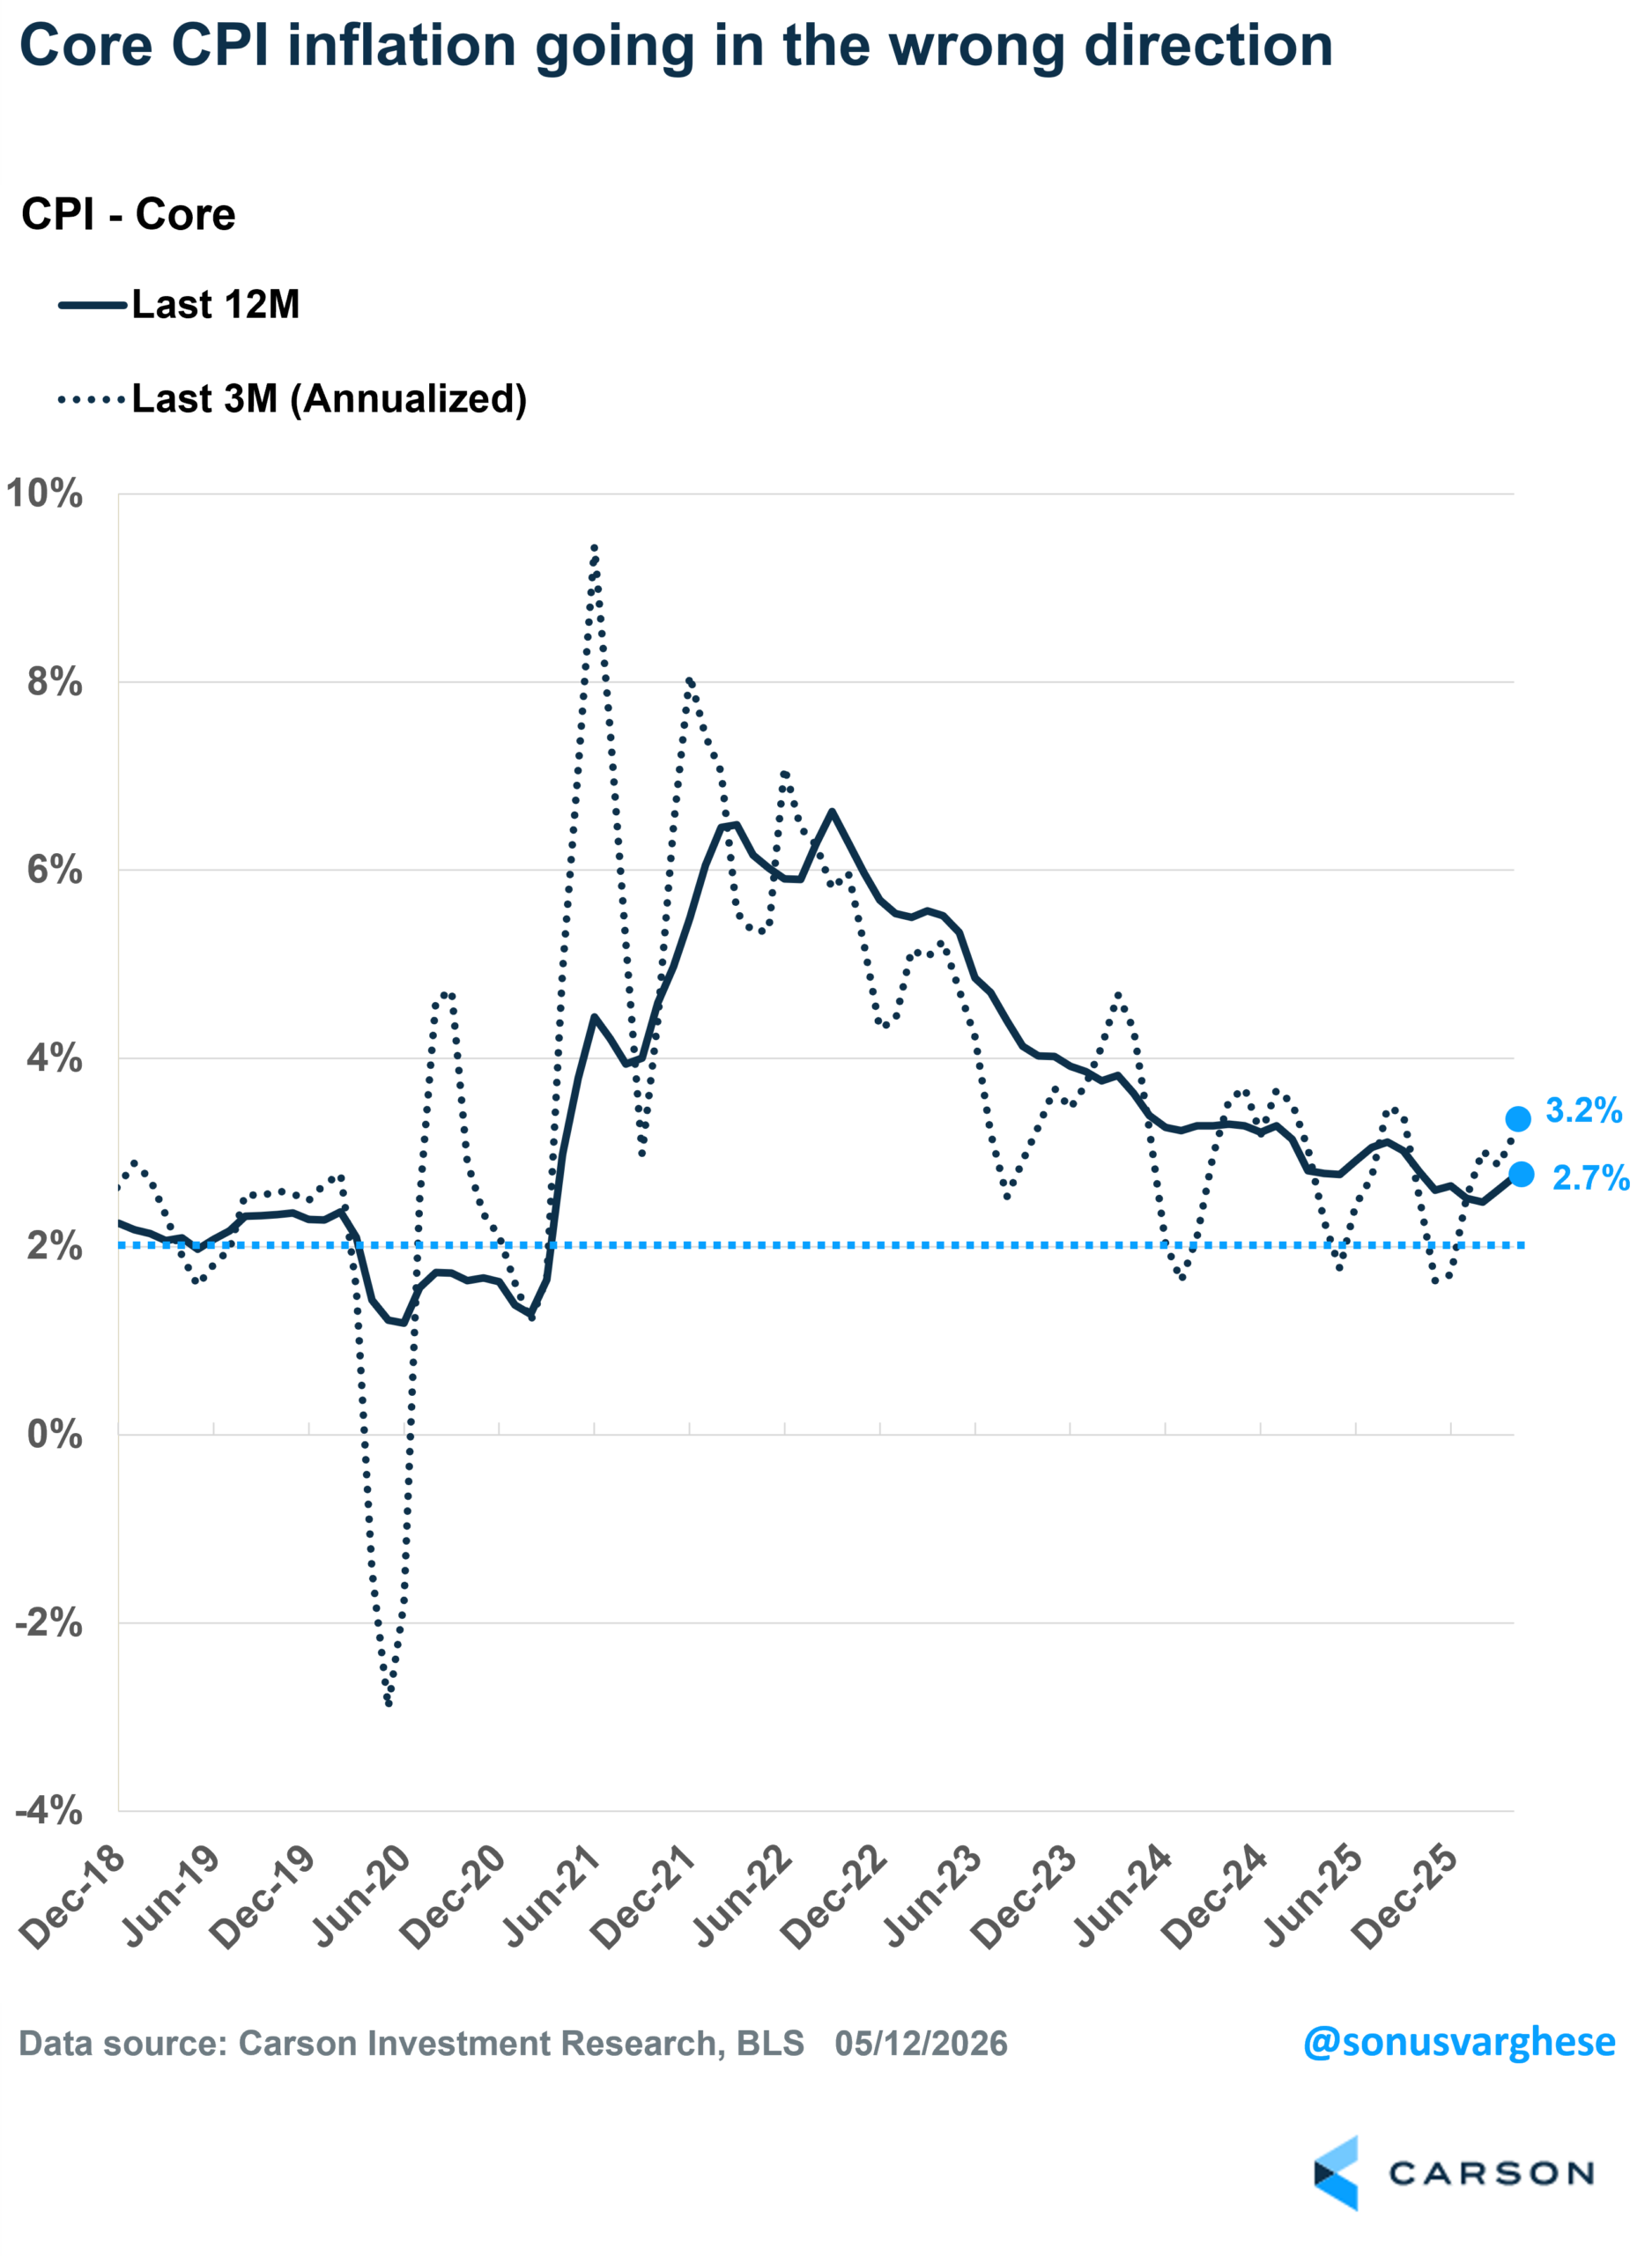
Core CPI rose 0.38% in April, which translates to a 4.6% annualized pace. That’s hot, as is the three-month annualized pace of 3.2%. Core CPI is now up 2.7% over the past twelve months. Inflation is elevated and going in the wrong direction.
Now, a big chunk of core CPI is housing, which makes up about 43% of the basket. This came in on the hotter side in April and reverses some of the softness we saw over the past six months. This is due to a statistical quirk. Missing data in October amid the government shutdown led the Bureau of Labor Statistics to assume there was no change in prices that month, i.e., zero inflation. We’re catching up to reality now.
There are some commentators who’ve said that if you exclude housing, core inflation was “moderate,” but that’s not really the case, as we’ll see below.
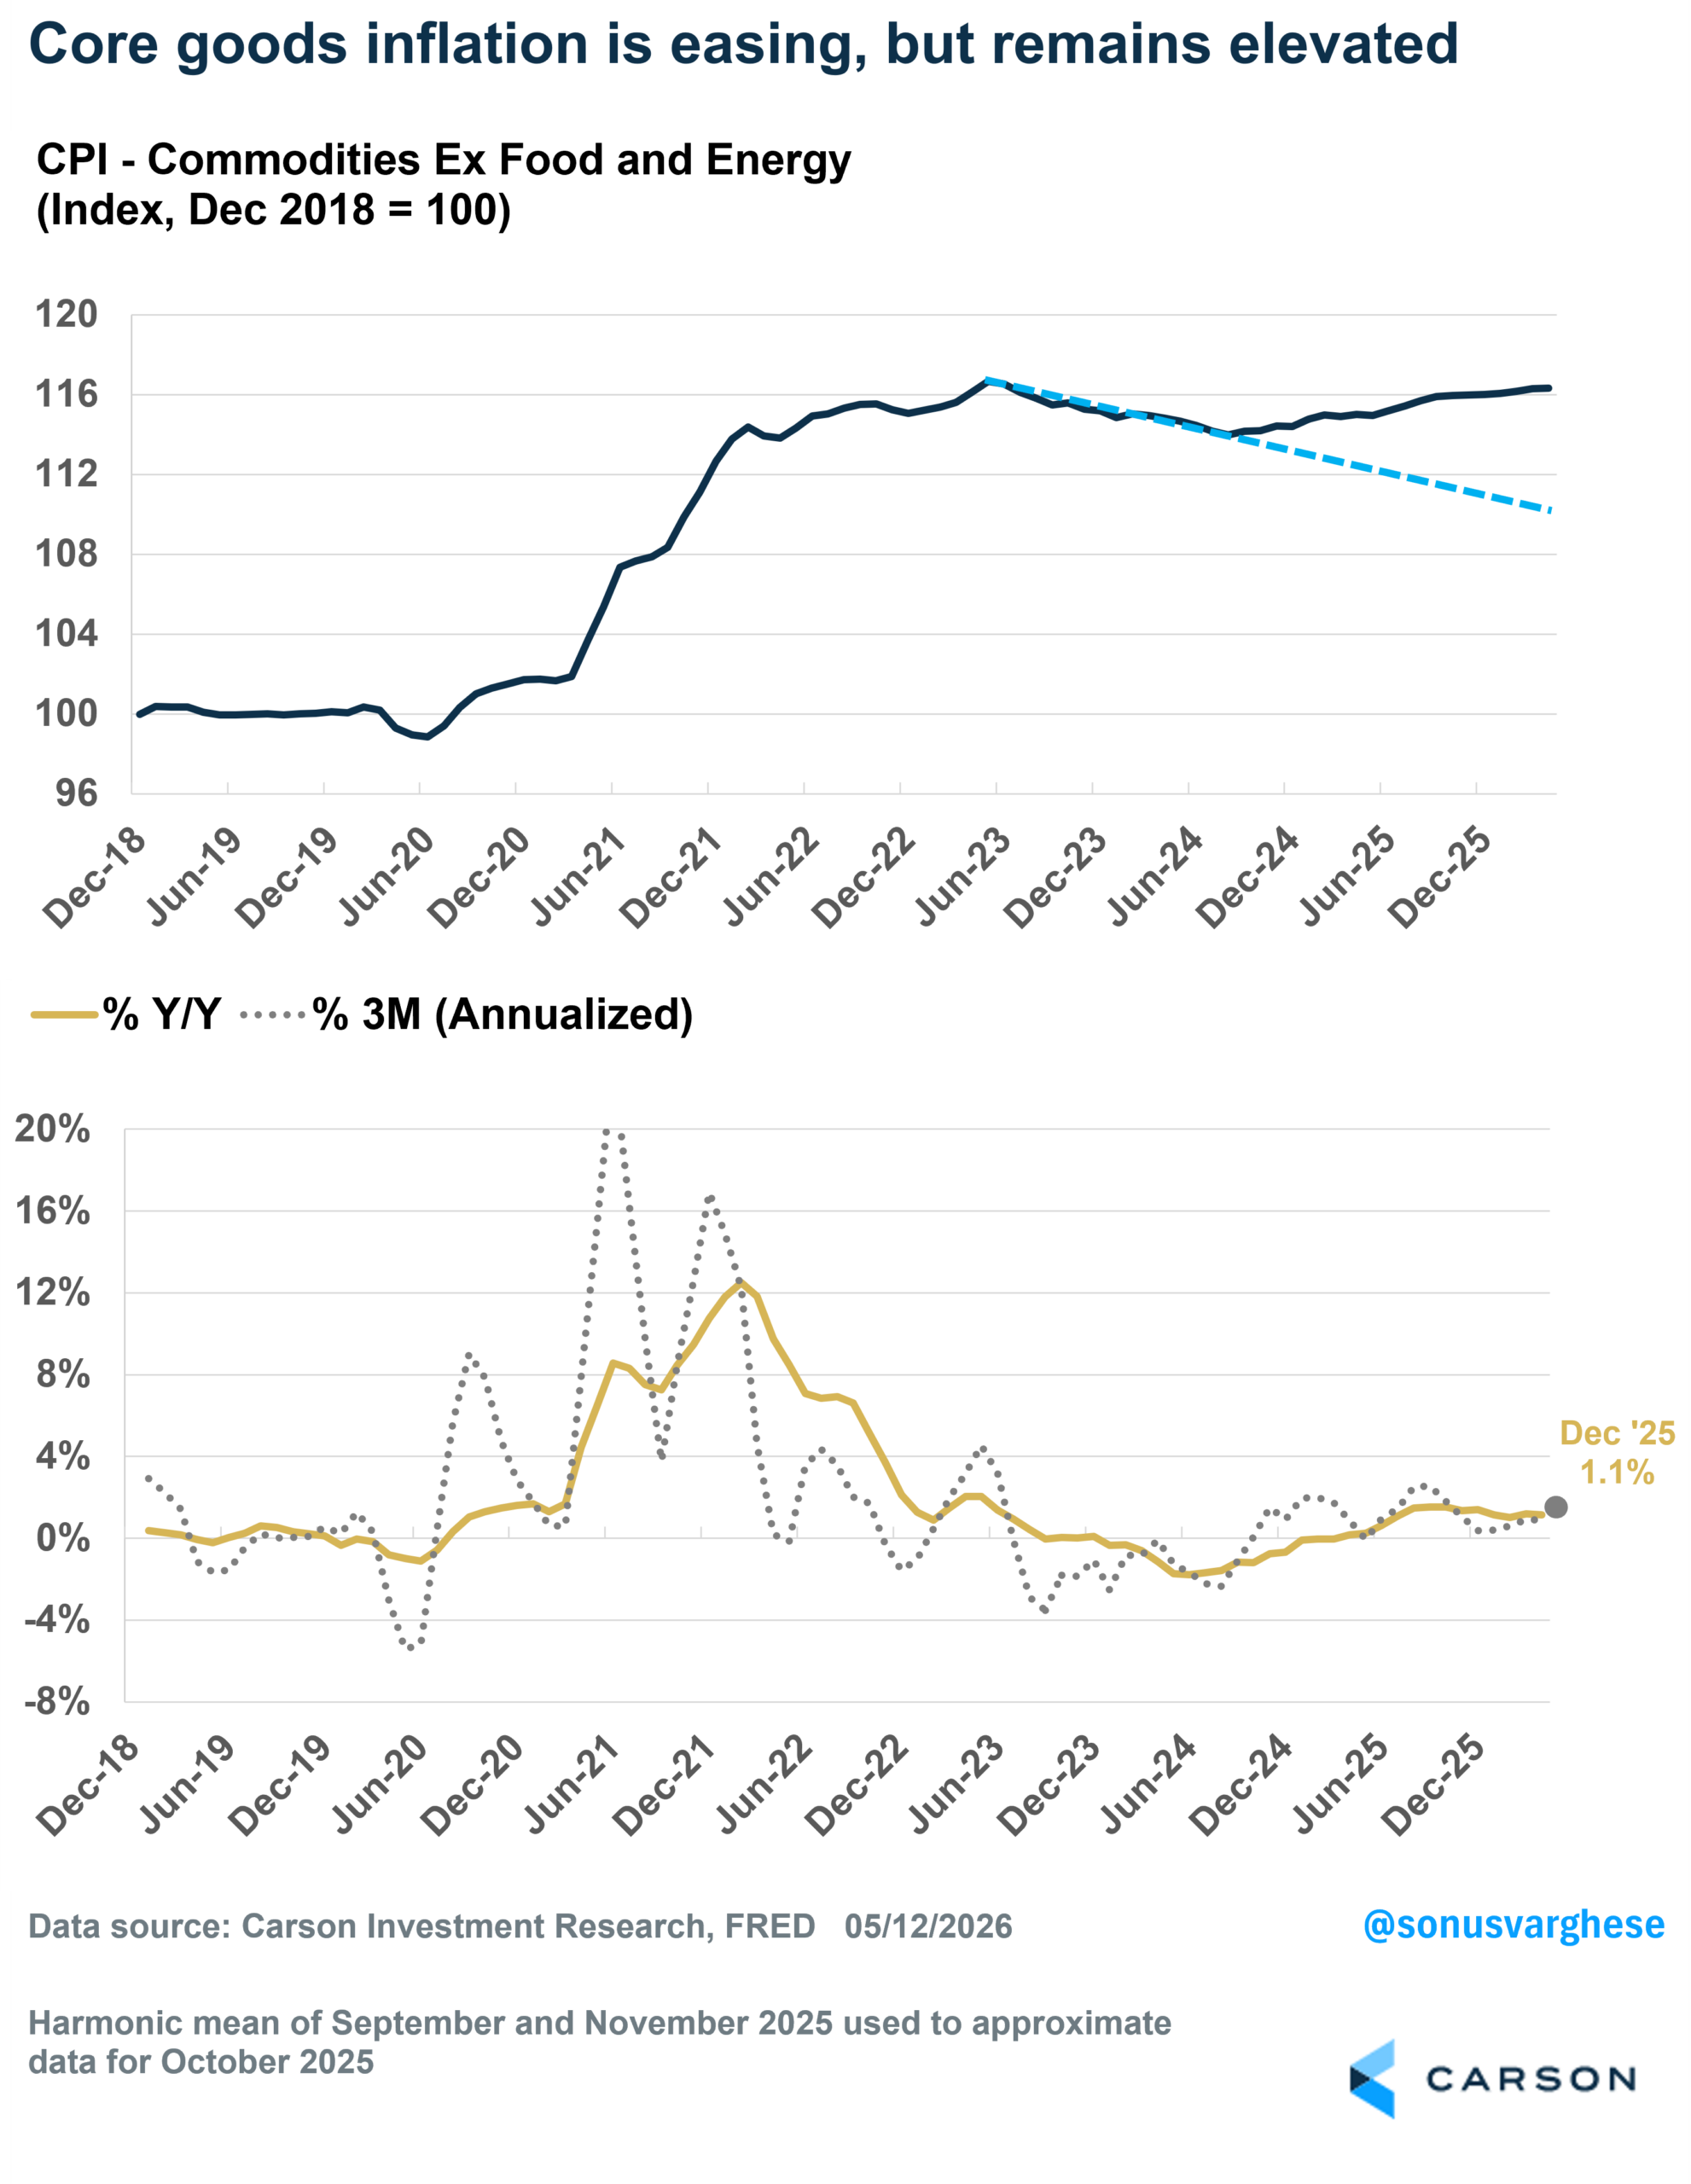
CPI for commodities excluding food and energy was flat in April, amid fading tariff pressures. Still, the three-month pace is running at 0.9% annualized, and prices are up 1.1% from a year ago. That may not seem like much, but it’s hot relative to pre-pandemic (2018-2019), when commodities, except for food and energy, experienced zero inflation.
At the same time, there are items that are still feeling the impact of tariffs, such as apparel. Apparel prices have risen at an annualized pace of 12% over the past three months and are up 4.2% from last year.
Another category experiencing significant inflation is computer software and accessories, which is being impacted by demand for AI. CPI for computer software/accessories is up a whopping 83% annualized over the last three months, which tells you that AI demand is far outrunning supply at this time. This barely impacts core CPI because it’s only 0.04% of the basket, but it makes a difference for the Fed’s preferred PCE inflation metric, in which it accounts for about 1% of the basket.
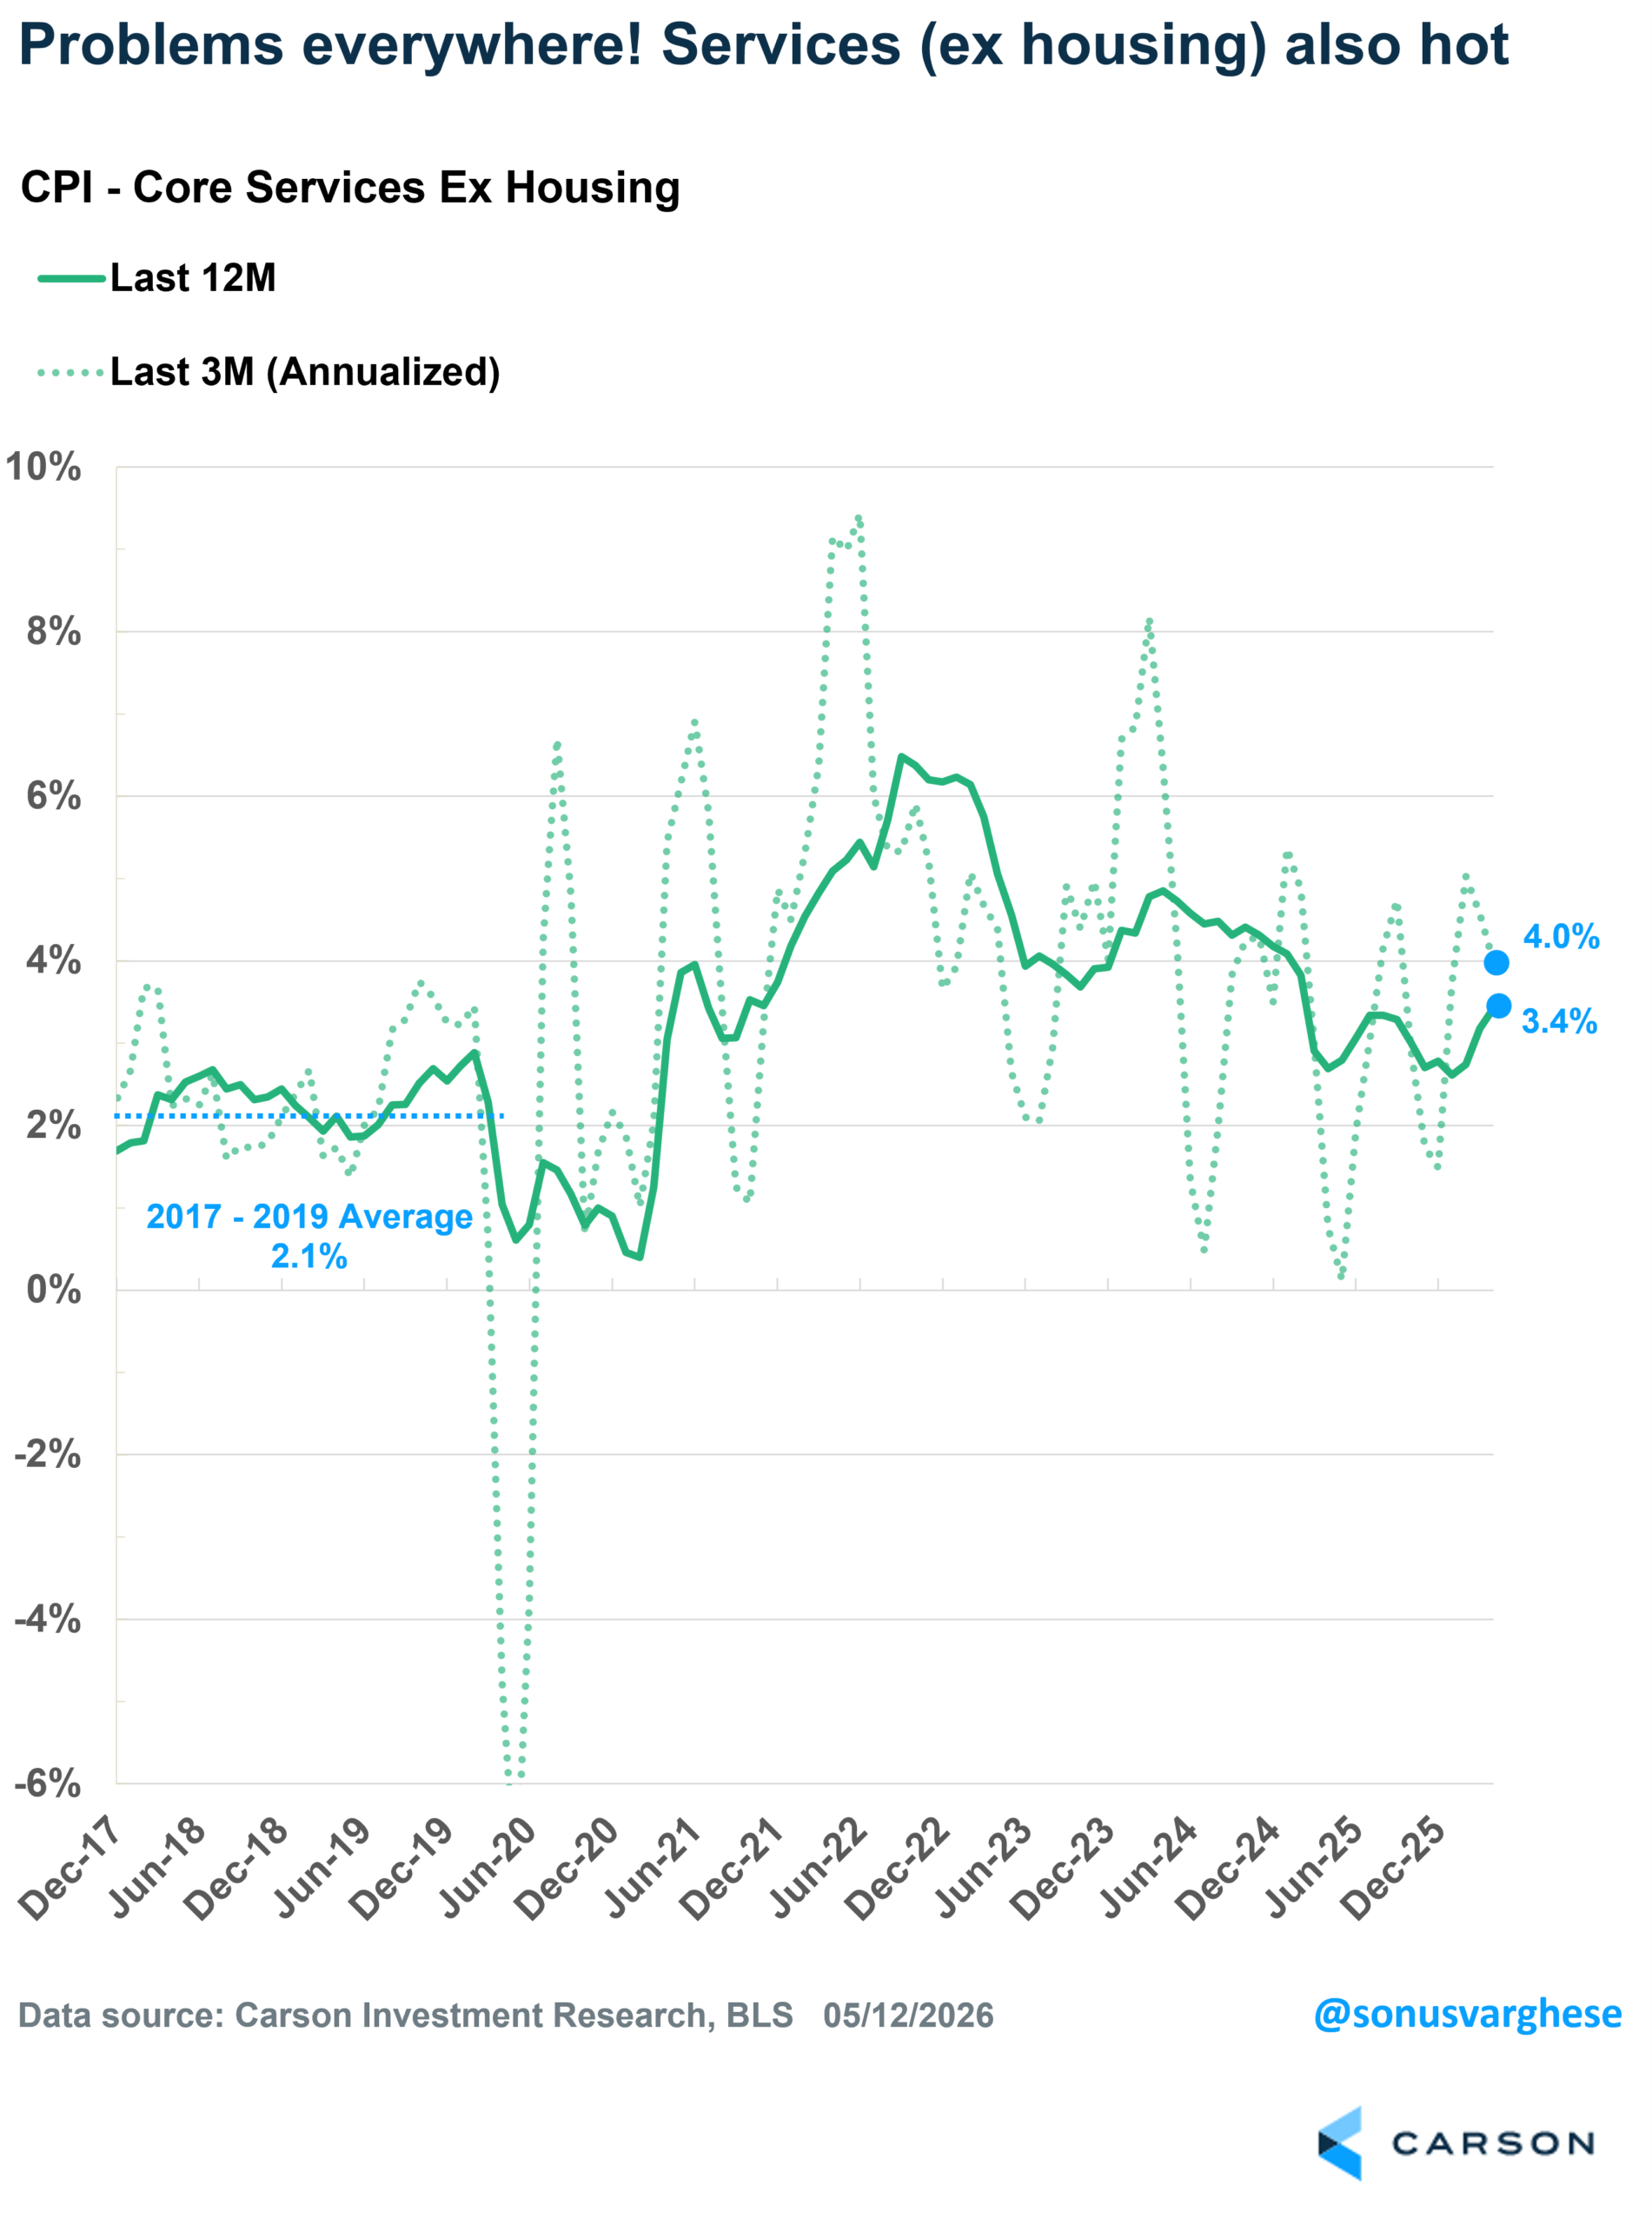
All of that is on the goods side, but inflation is problematic even if you look at core services excluding housing. Prices for this category rose 0.38% in April, equivalent to 4.6% annualized. The three-month annualized pace is 3.2%, and prices are up 2.7% year over year, well above the 2017-2019 trend of 2.1%.
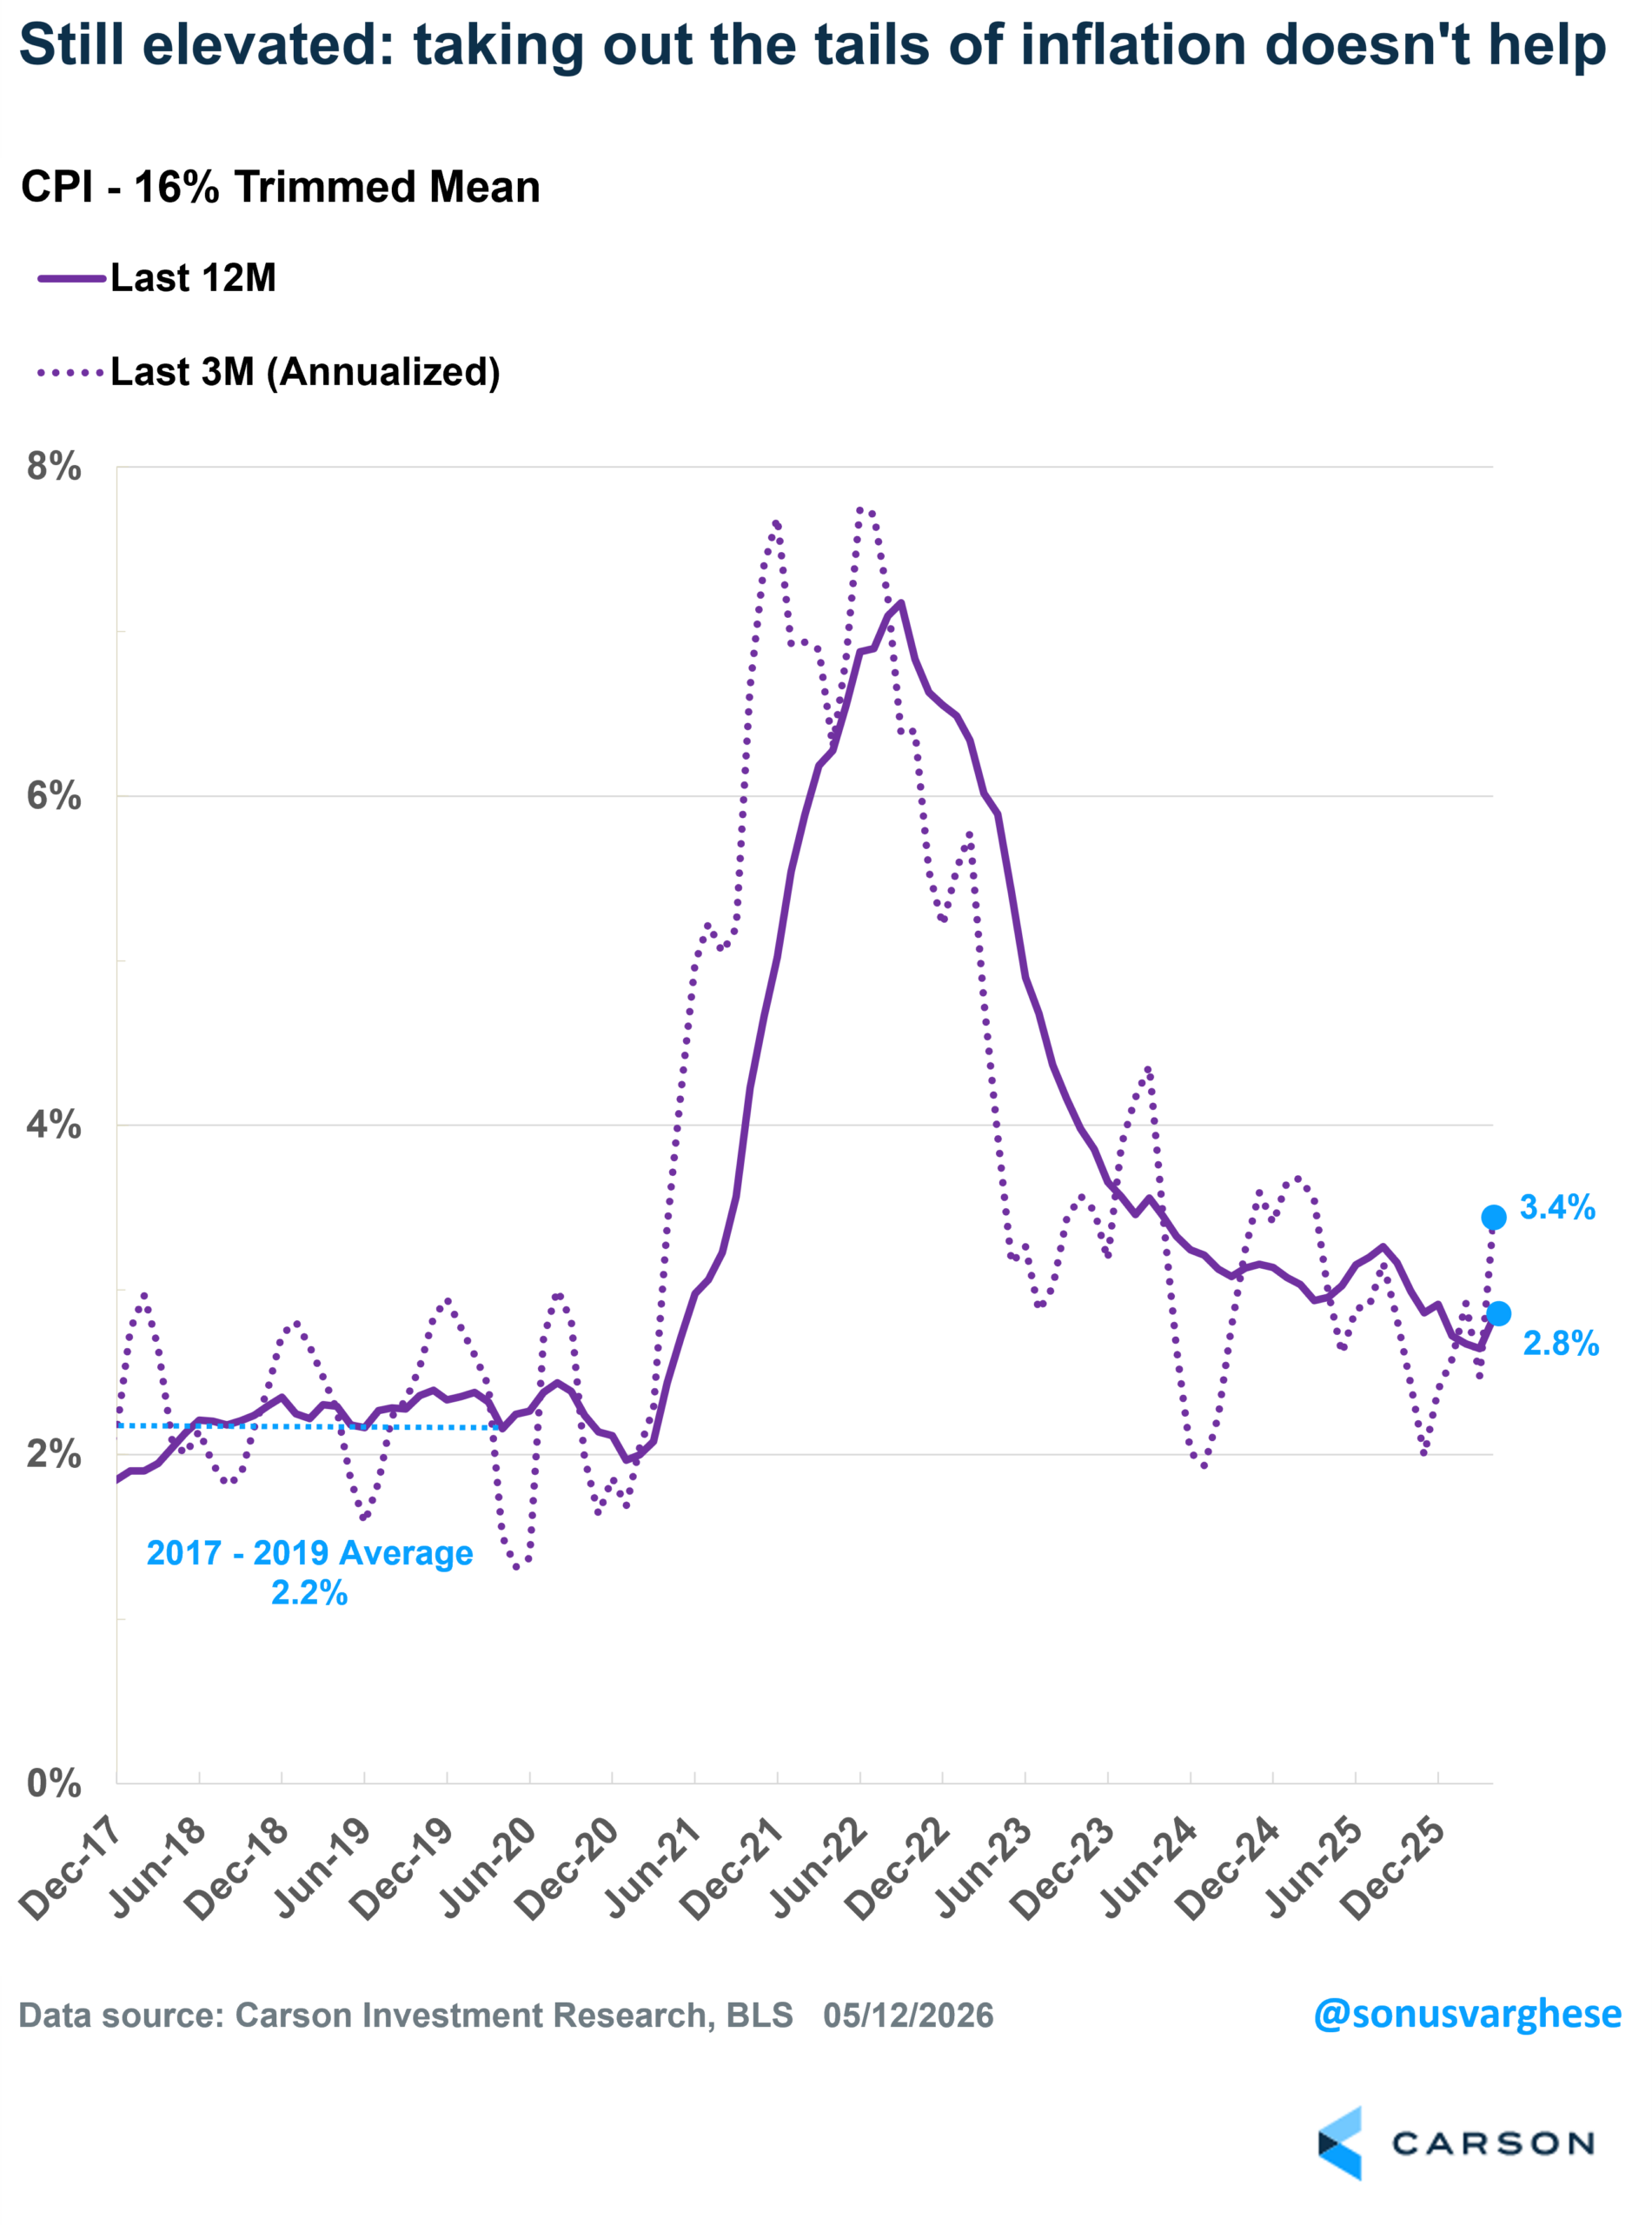
Another statistical angle on inflation is “16% trimmed mean CPI.” This metric excludes 8% of CPI components with the highest and lowest one-month price changes from each tail of the price-change distribution. Incoming Fed Chair Kevin Warsh has expressed his preference for “trimmed mean” inflation measures, which he argues provide a more accurate picture since they remove extremely high and low price changes across all spending categories. The problem is that the 16% trimmed mean rose 0.43% in April (5.2% annualized). The three-month annualized pace is 3.4%, while the metric is up 2.8% year over year. And recent momentum is in the wrong direction. For reference, the 2017-2019 pace was just 2.2%.
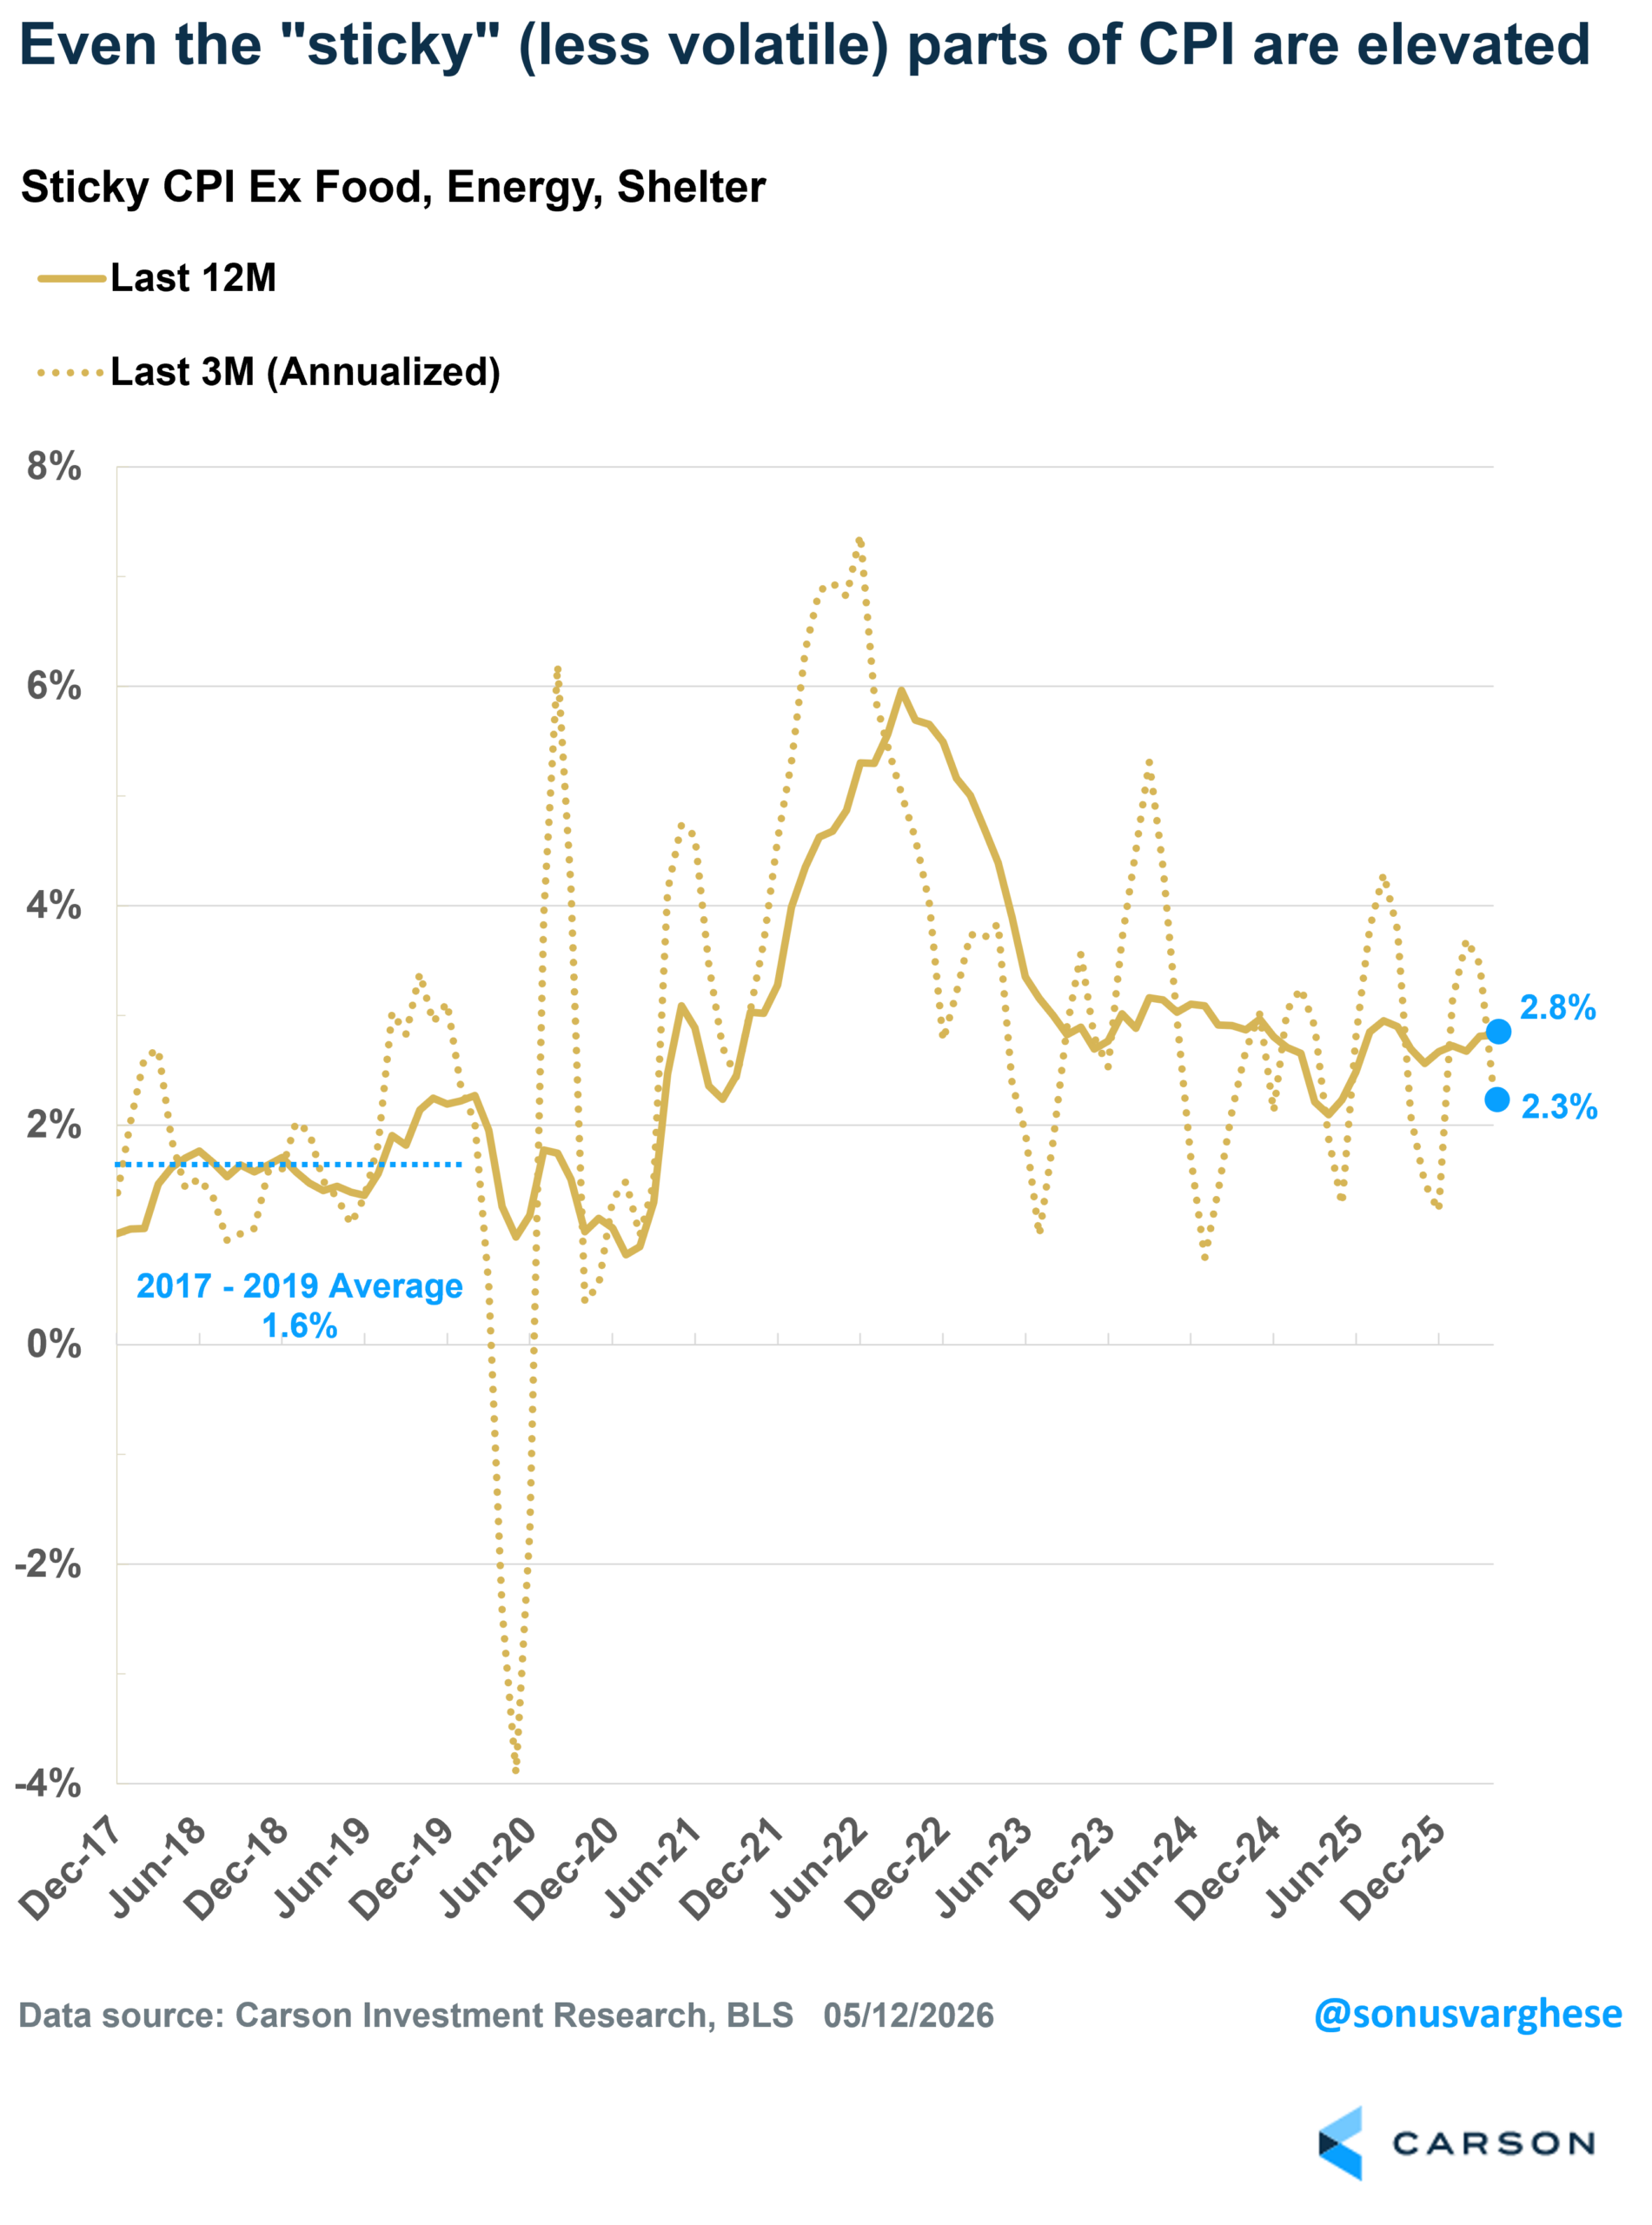
One final slice: the Atlanta Federal Reserve calculates something called Sticky Price CPI, excluding food, energy, and shelter. It measures inflation for items whose prices typically don’t change frequently. This index rose 0.24% in April (3.0% annualized). It’s running at a three-month annualized pace of just 2.3% and is up 2.8% year over year, but these readings are all elevated relative to the 2017-2019 pace of just 1.6%. As you can see below, we really haven’t made any progress on inflation since the end of 2023.
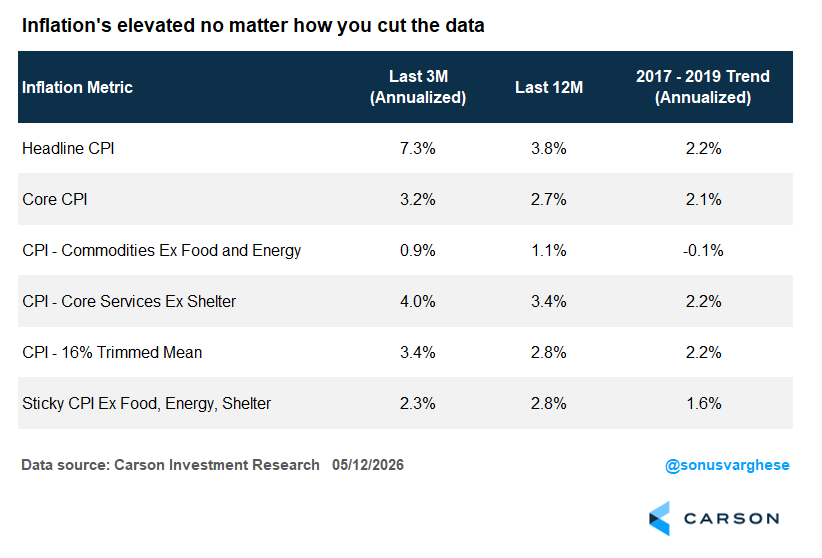
Here’s a summary of all the different slices of inflation I discussed above. It’s clear the problem is broad and not isolated to just energy, or tariffs. The fact that the three-month pace is mostly hotter than the twelve-month pace tells you that momentum is in the wrong direction and all the readings are above the 2017-2019 trend. The long and short of this is that inflation is elevated and going the wrong way, no matter how you slice it.
To anyone who says inflation is actually moderating if you exclude this and that, I’ll just quote tennis player John McEnroe: “You cannot be serious.”
Bonds Don’t Like the Inflation Backdrop, But Stocks Do (For Now)
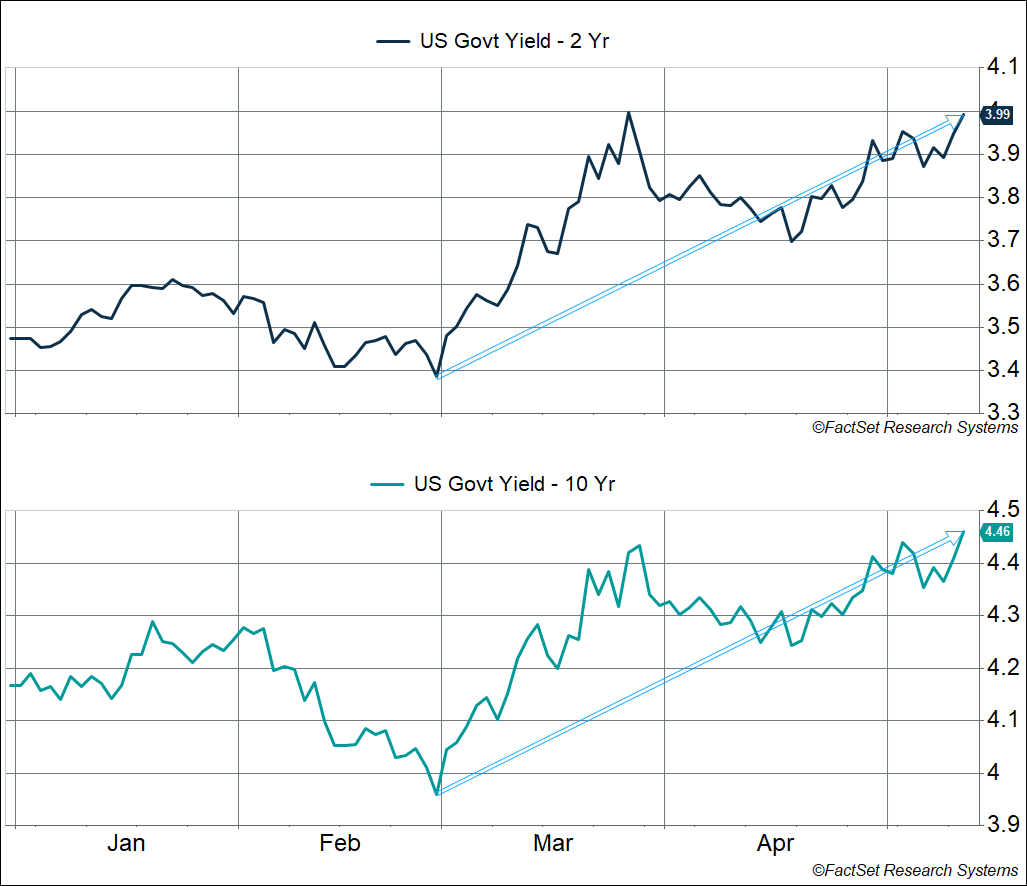
The most direct impact of the inflation backdrop is on the bond market. Short and long-term yields are at the highest levels we’ve seen this year and reflect the real cost of the Middle East crisis and underlying inflationary heat. US Treasury 2-year and 10-year yields have risen to their highest levels this year, even with the equity market reaching all-time highs:
- The 2-year Treasury yield has risen from 3.37% on the eve of the war to 3.99%.
- The 10-year Treasury yield has risen from 3.94% to 4.46%.
Keep in mind that bond prices fall when yields rise.
As we discussed in our 2026 Outlook, we expected to be in an inflationary growth environment this year, and that’s where we are. But it’s not great for bond yields and general borrowing costs. As I wrote in my prior blog, the labor market is also holding up, and normally, we’d be talking about rate hikes. However, the Federal Reserve under incoming Chair Kevin Warsh is expected to hold rates steady for the rest of the year, rather than raise them. That’s a potential tailwind for stocks, on top of the fact that a lot of the profit growth you’re seeing is the other side of the inflation coin. After all, one company’s margin expansion (and profit growth) is another person’s inflation.
For more content by Sonu Varghese, Chief Macro Strategist, click here.
8926740.1. – 13MAY26A