
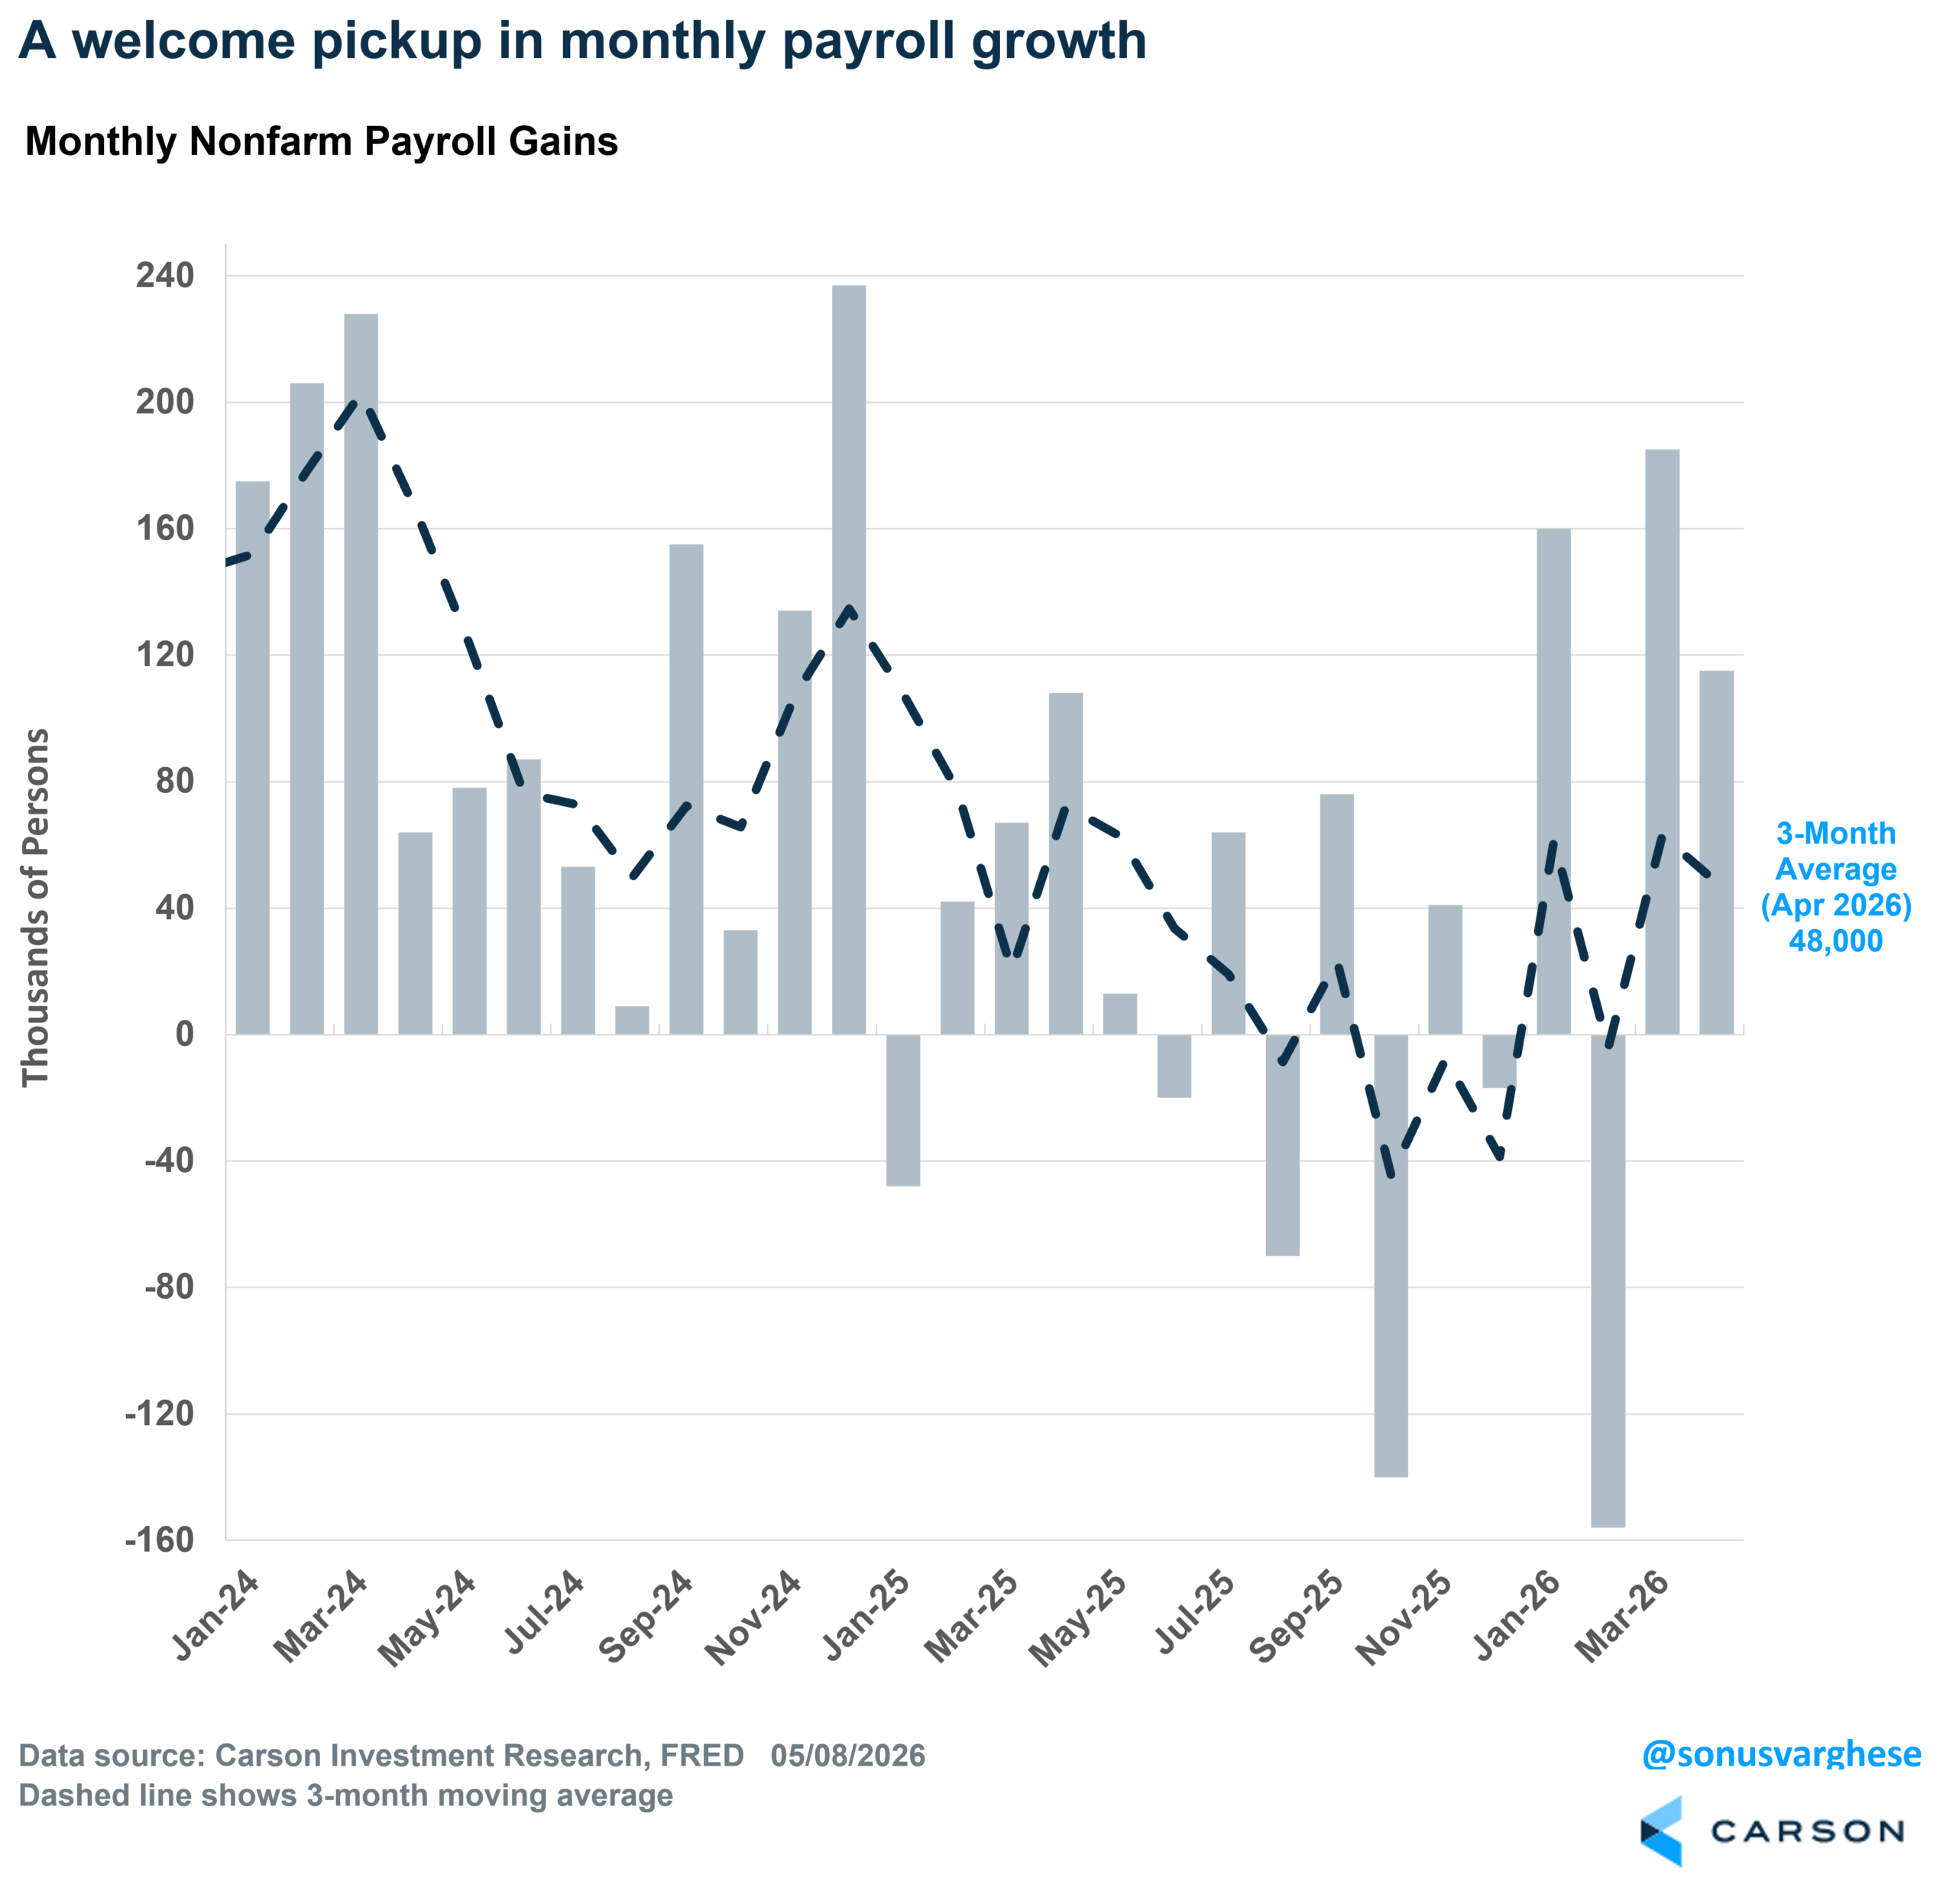
Take the labor market off your checklist for potential downside risks. We’ve been in the camp for a few months now that the labor market is healthier than noisy headline payrolls suggest. The April payroll data bears that out, pointing to a labor market that is no longer the downside risk it was. For the first time in almost a year, the US economy created jobs in back-to-back months, with 115,000 jobs created in April, following a 178,000 gain in March. Of course, these are all subject to revisions, as was evidenced by February payrolls’ downward adjustment of 23,000 to -156,000. This is why it’s useful to take a 3-month average, and right now that’s running at 48,000. For perspective, the 3-month average was -39,000 at the end of 2025, and across all last year, payroll growth averaged a measly 10,000 per month (116,000 jobs created over the full year). The recent pickup is welcome, and perhaps a sign of re-acceleration.
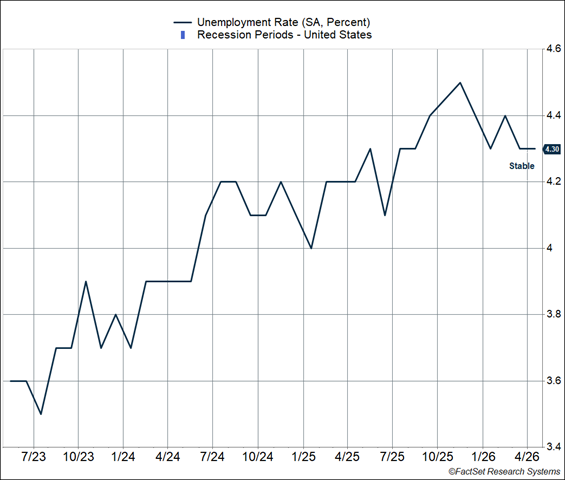
Normally, we’d say average payroll growth clocking in under 50,000 is no great shakes, but with population growth running low amidst the immigration collapse, the economy doesn’t need to create a lot of jobs to keep the unemployment rate steady. And the unemployment rate has, in fact, stayed steady at a historically low level of 4.3%. The labor market had clearly weakened over the first nine months of 2025, especially in the summer, but the situation has stabilized since then.
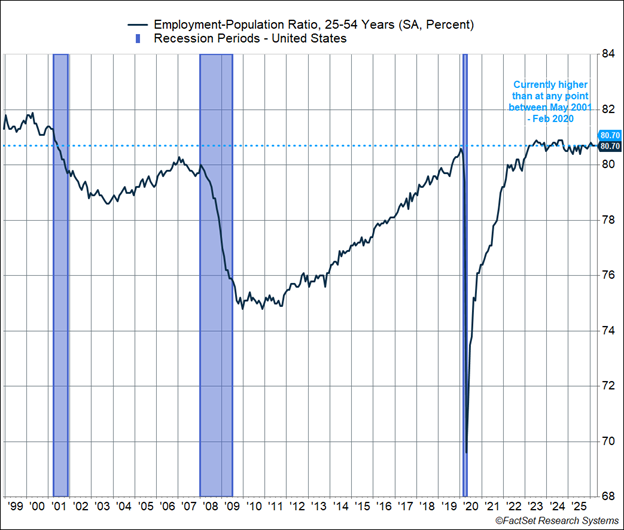
Better yet, the prime age (25-54) employment-population ratio is sitting at 80.7%, higher than at any point between May 2001 and March 2023. In other words, more people in their prime working age years are employed today than at any point during the last two expansion cycles (relative to the age group’s population).
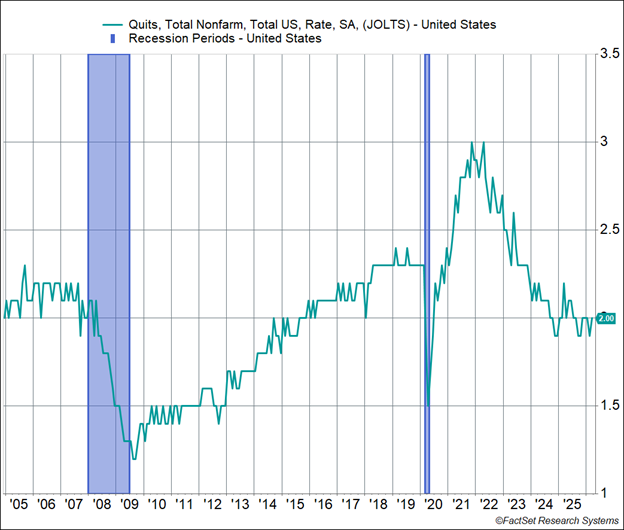
Another underrated labor market indicator is the quits rate. The good news is that quits remain steady, with the quit rate (quits as a percent of the workforce) around 2%. This is right in the middle of the range we saw over the prior year and a half. A relatively strong quit rate is a sign of labor market strength, and vice versa. Workers quit at higher rates only if it’s easy to find a job. The quit rate usually plunges only during recessions, and from mid-2023 onwards, we’ve seen a big drop in the quits rate. However, things stabilized in 2024 and across most of 2025, albeit at a level lower than what we’d associate with a very strong labor market, whether in 2018-2019 or 2021-2023. The steady quit rate is perhaps the best signal that the labor market is OK.
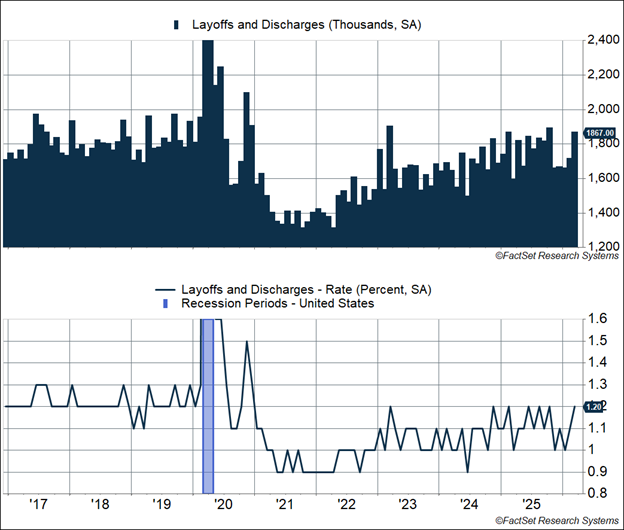
While people are leaving their jobs at a pace consistent with a healthy labor market, employers are reluctant to let people go. Despite all the anecdotal reports of job layoffs at some large firms (especially in the tech industry), the overall layoff rate (layoffs as a percent of the workforce) remains at a historically low level of 1.2%. Something useful to keep in mind when you see news headlines about 10,000-30,000 planned layoffs across a few companies—the US economy sees about 1.8-1.9 million layoffs PER MONTH. That’s in line with what we saw in 2018-2019 amidst a strong labor market, but back then, the labor force was smaller, and so the layoff rate hovered around 1.2-1.3%.
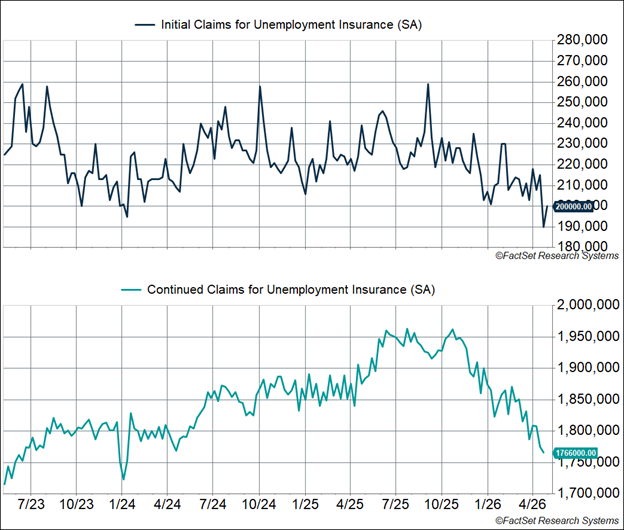
A timelier labor market indicator is initial claims for unemployment benefits. If more people are being let go, we should see this metric climb. Instead, it’s at historically low levels, close to 200,000 per week. Continuing claims for benefits tells us how many people are continuing to receive benefits because they’re having a hard time finding a job—that’s been declining over the last six months to a relatively low level of 1.7-1.8 million.
Wage Growth Is Also Running Quite Strong
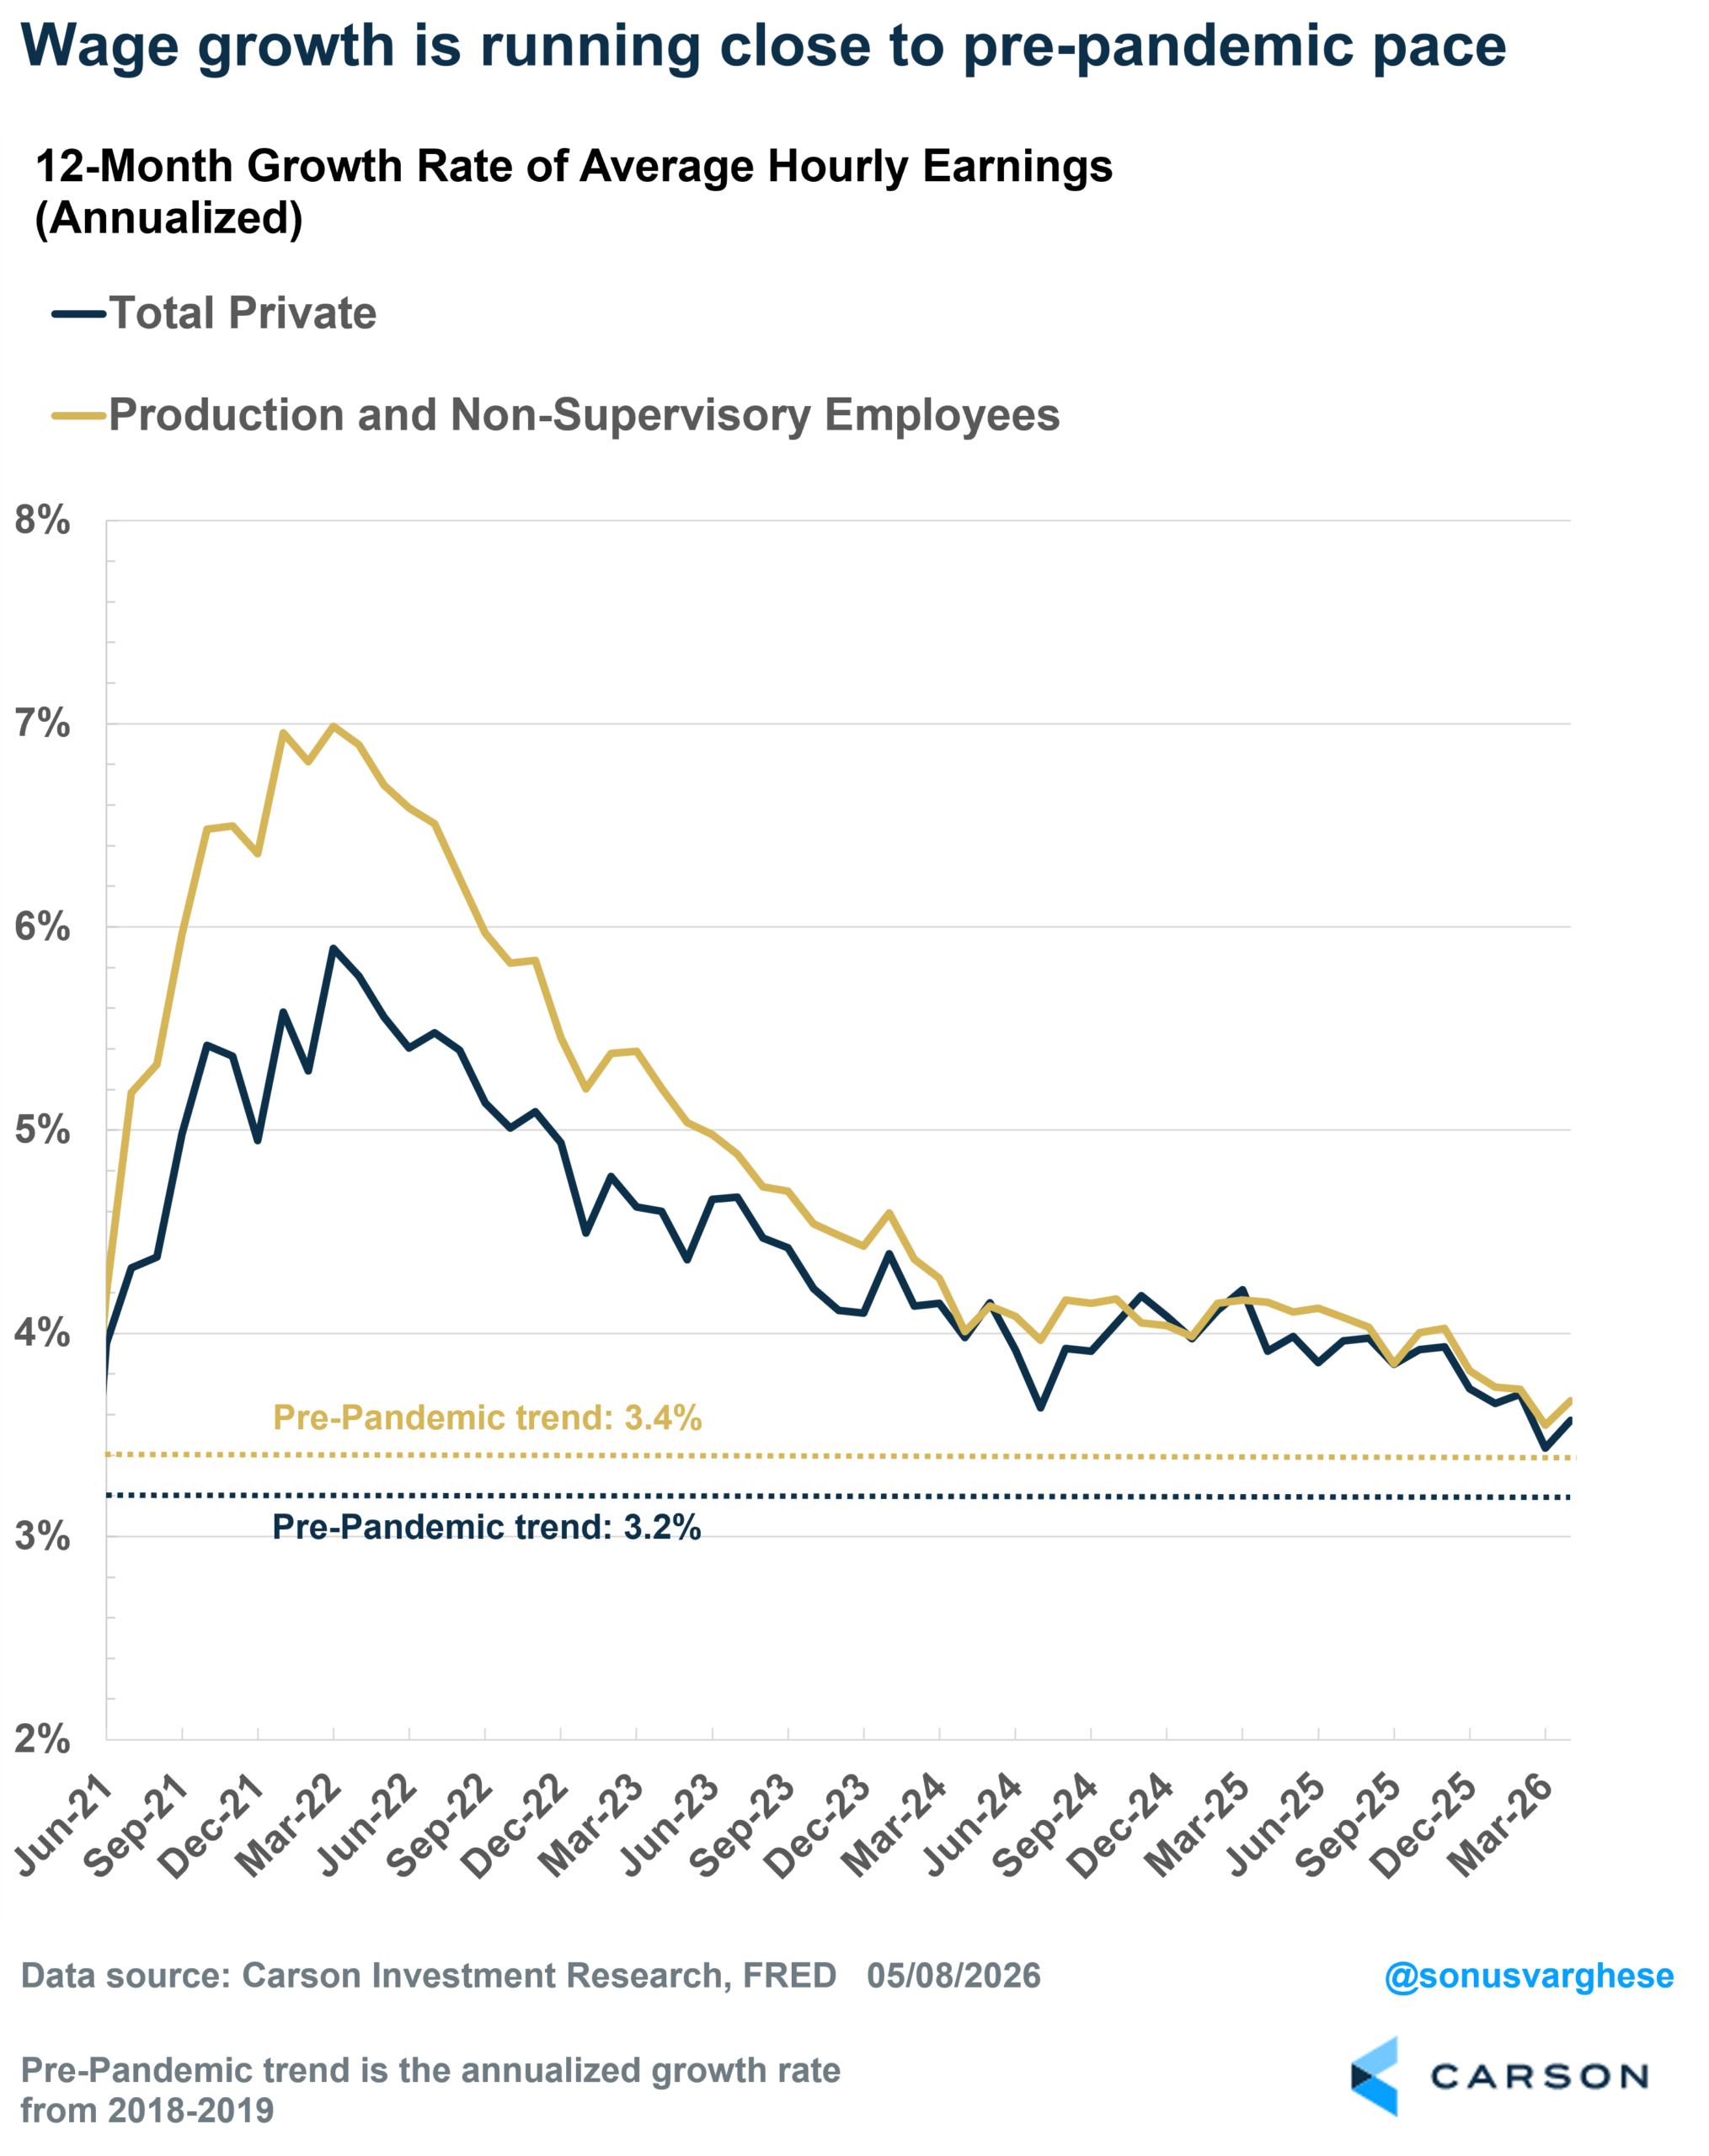
All of the data above should tell you that the labor market is in a healthy place. This is also reflected in average hourly earnings growth for private sector workers, which is up 3.6% over the last 12 months. That’s cooled over the last few years, but it’s still slightly ahead of what we saw pre-pandemic during a strong labor market. In fact, for non-managers (“production and non-supervisory workers”), wage growth is up 3.7% year over year, ahead of the pre-pandemic trend of 3.4%.
The Fed Is Still “Looking Through” Elevated Inflation
The problem right now is that inflation is squeezing incomes, as I wrote in my prior blog. The Fed’s preferred inflation metric, the Personal Consumption Expenditures Index (PCE), is up 3.5% over the past year and 5.6% annualized over the first quarter (Q1), which means wages aren’t growing in real (inflation-adjusted) terms. Only part of this is due to the energy shock from the Middle East crisis. Core inflation, which strips out energy and food prices, is up 3.2% over the past year and a really elevated 4.4% annualized pace in Q1.
All said and done, we were a long way away from normal on the inflation front, even if you ignore the energy shock (which you shouldn’t because that’s going to feed into core inflation via things like airfares and restaurant prices). Normally, a backdrop of a relatively healthy labor market and elevated (and rising) inflation would have the Fed thinking about rate hikes. Instead, it looks like the Fed, especially under incoming Chair Kevin Warsh, is going to look past elevated inflation.
Stay on Top of Market Trends
The Carson Investment Research newsletter offers up-to-date market news, analysis and insights. Subscribe today!
"*" indicates required fields
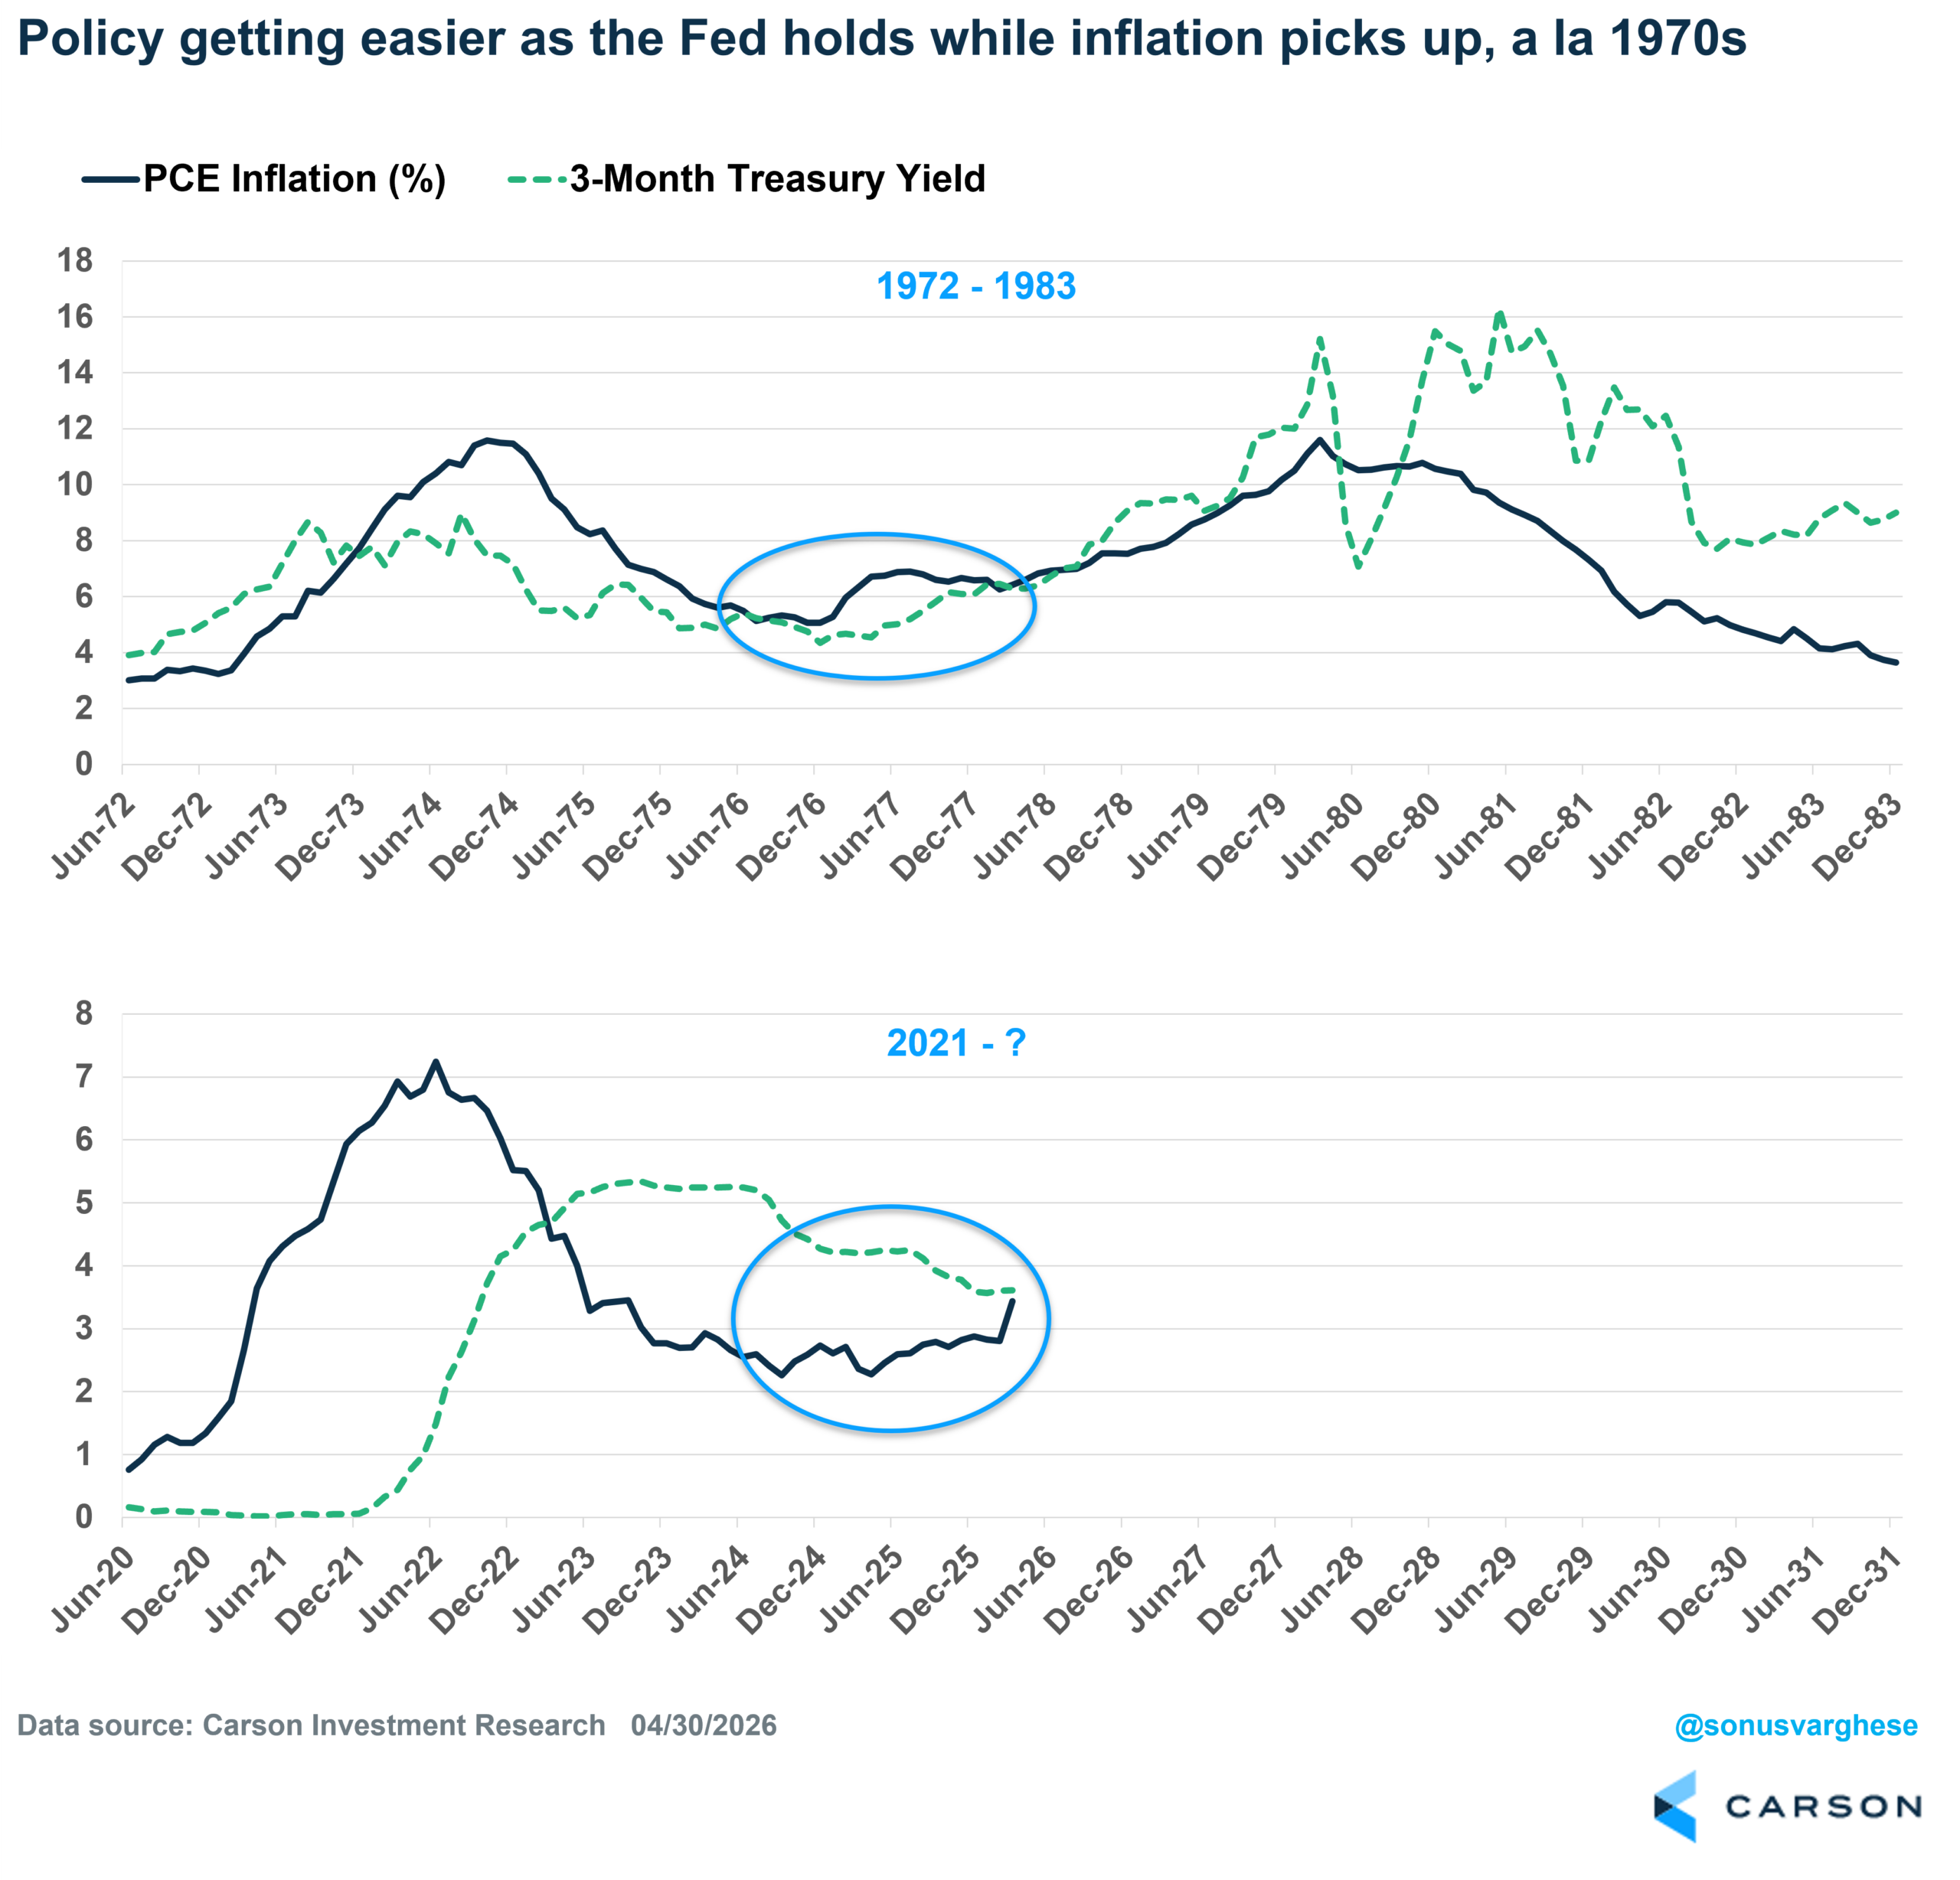
The problem here is quite obvious. At some point, whether it’s a year from now or 2-3 years from now, the Fed will realize that inflation has run too high for too long and will have to be even more aggressive to get inflation back to target. The current episode could end up being similar to what we saw in the 1970s and into the early 1980s. A relatively easy Fed looked past elevated inflation, but then Fed Chair Paul Volcker came in and raised rates to over 15% to ultimately crush inflation, in the process sending the economy into a big recession. That doesn’t imply we’ll see interest rates rise to 10% or more, like in the 1980s, but even raising rates to 5-6% from this point will be quite painful.
I’ve shown the 1970s and 2020s inflation episodes in the chart below (using headline PCE inflation), along with the three-month Treasury yield (using this as a proxy for policy rates). As you can see in the bottom panel, the gap between rates (green dashed line) and inflation (dark blue line) is shrinking, even as inflation remains elevated. In other words, the fact that the Fed is easing rates even as inflation remains elevated means policy is getting more dovish even if rates stay where they are.
Of course, easier monetary policy is good for stocks. Here’s a version of the above chart showing inflation and short-term rates in the late 1970s to early 1980s, along with the S&P 500. The S&P 500 rallied 48% between 1978 and late 1980—the Fed was raising rates during this time, but not enough to send inflation lower. It was only when Volcker raised rates well above inflation levels that we saw an equity bear market (November 1980 – July 1982). Equities finally rallied once the Volcker Fed realized inflation had fallen enough and lowered rates.
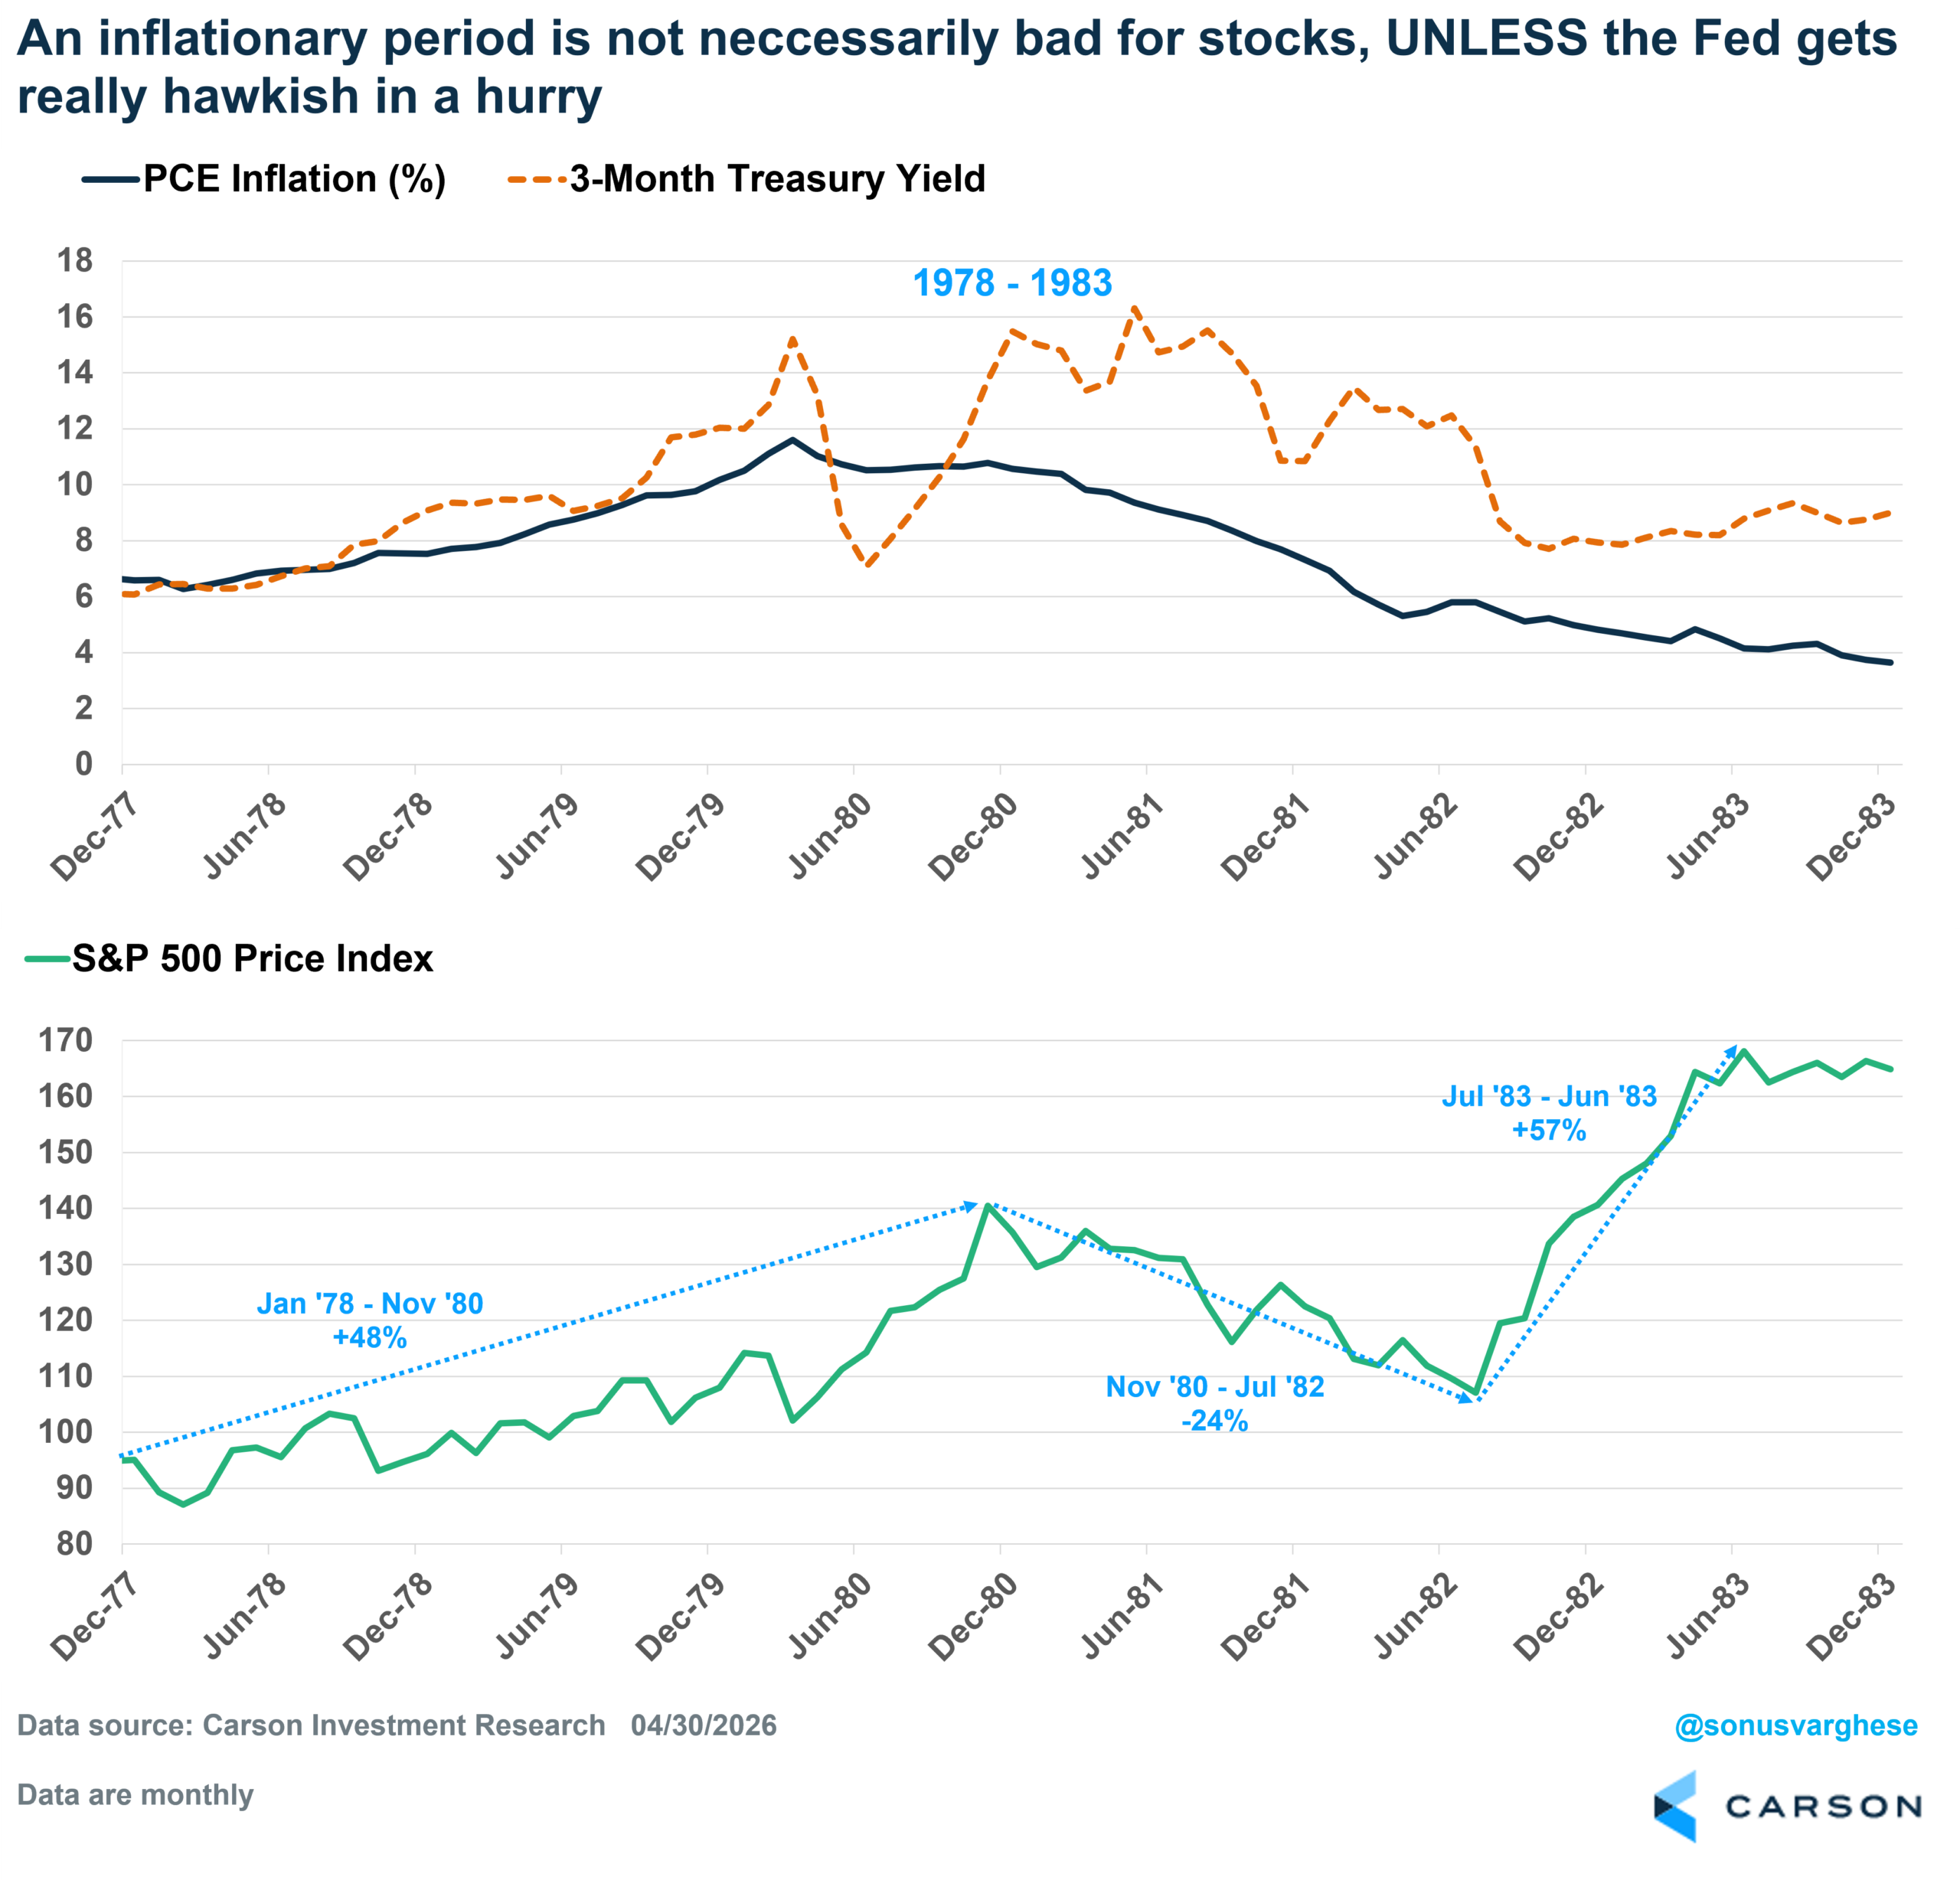
Over the entire five-and-a-half-year period (January 1978 – June 1983), the S&P 500 gained 77% (136% including dividends), a reminder that, despite elevated inflation and huge swings in monetary policy, equities did quite well. Albeit with a lot of volatility. This is one reason why we remain overweight equities, but diversify our diversifiers with exposure to bonds, cash, gold, and managed futures (which includes commodities like oil).
For more content by Sonu Varghese, Chief Macro Strategist, click here.
8920221.1. – 8MAY26A
