
Initial public offerings (“IPOs”) are considered a key indicator of investor risk appetite. Encouragingly, IPO activity across major U.S. exchanged has largely rebounded to long-term average levels. The consistency of recent IPO execution even looks similar to the late 2010’s, when global equity markets sustained years of gains. Notably, post-IPO returns reveal a meaningful divergence between technology and non-technology companies, mirroring the recent equity bull markets in tech-related stocks.
IPO activity over the past five quarters is largely in-line with pre-Covid averages. As shown below, quarterly IPO execution – measured by cumulative IPO proceeds – is similar to levels seen during the 2015-2019 period. In the first quarter of 2025, a total of $5.8 billion was raised from all “large IPOs” (defined as those raising more than $500 million in proceeds). This figure aligns closely with the late 2010s average of $5.65 bill per quarter.
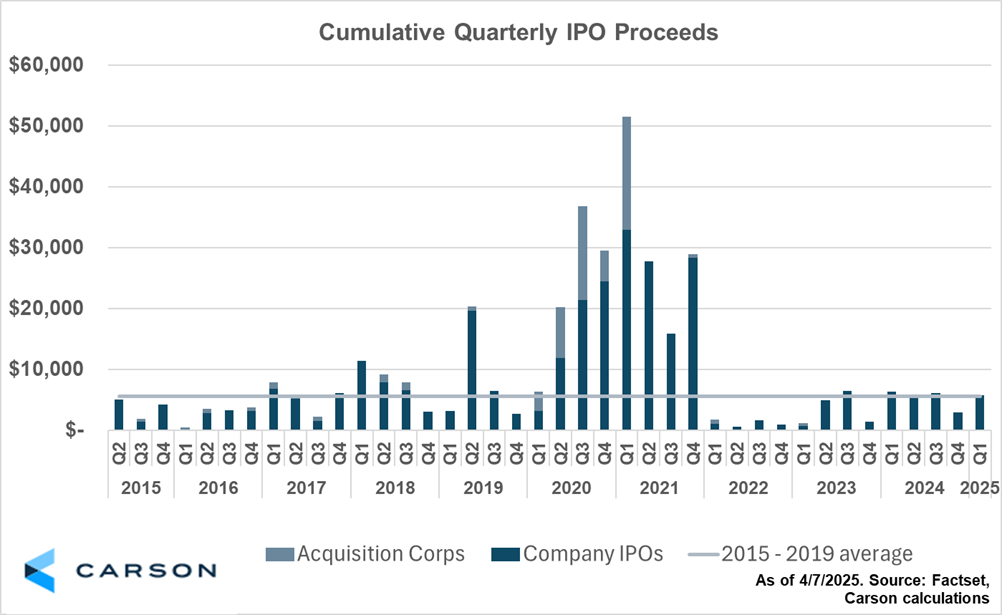
What stands out most is the consistency in recent IPO issuance. From Q1 2024 through Q1 2025, four of five quarters saw total IPO issuance exceed $5B. There were only two such stretches in the 2015 – 2019 period (Q1 2017 – Q1 2018, and Q4 2017 – Q4 2018, granted there are overlapping periods in there) that saw the same level of consistency. It may only be investor perception about headlines of IPOs being delayed that is driving negative sentiment in the space. Both the amount and flow of IPO deals has returned to normal.
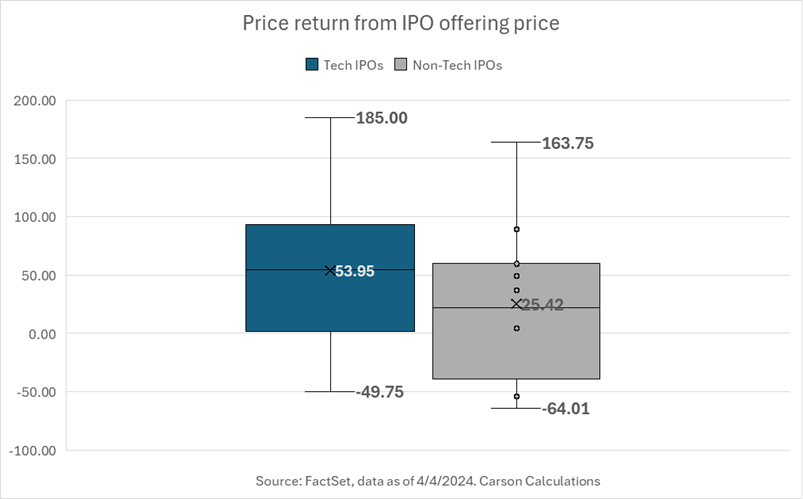
Recent technology IPOs have significantly outperformed their non-technology counterparts. Among the 21 large IPOs in the last five quarters, the nine technology-focused companies have performed notably better than the 12 non-tech focused IPOs. On average, the tech IPOs have returned a little under 54% when comparing current stock prices to their offering price. The top-performing tech IPO posted a 185% gain, while the weakest saw a -49.8% return. In contrast, non-tech IPOs have returned an average of 25.4%, with returns ranging from a 164% gain to a -64% return.
Importantly, this strong performance from recent IPOs does not appear to be driven by smaller deal sizes that could artificially limit supply in an effort to boost returns. The median deal size for IPOs raising over $500 million in the past five quarters was $796 million—comparable to the median proceeds of $754 million in 2019 and $799 million in 2018. While inflation and company scale may merit adjustment, these nominal figures suggest deal sizes have remained relatively stable over time.
Stay on Top of Market Trends
The Carson Investment Research newsletter offers up-to-date market news, analysis and insights. Subscribe today!
"*" indicates required fields
In summary, a number of different measures suggest that the IPO market has largely recovered to average levels. IPO volume and frequency, as well as the strength of recent post-IPO returns, indicate renewed investor confidence following 2022’s downturn. While technology IPOs have performed better than their non-technology peers, it may simply be a sign that companies on the leading side of innovation continue to be rewarded by investors.
For more content by Blake Anderson, CFA®, Associate Portfolio Manager click here.
7827290.1-0425-A
