Thursday, June 12, has been a tragic and exhausting day. It started with the terrible crash of an Air India flight in India, killing over 250 people—the worst aviation disaster in India since 1996. Then the day ended with Israel striking Iran, targeting their nuclear program and killing several top Iranian military officials (including the head of Iran’s powerful Islamic Revolutionary Guards Corps).
This is coming on the heels of the Liberation Day tariff situation, which was subsequently reversed after the market went through a near bear market. The S&P 500 had just about been approaching its prior new high. And now this. However, as tragic as these events are, let’s keep some perspective, at least from a market standpoint.
It sounds like a lot and it is, but as my colleague Ryan Detrick says, chaos is normal. Here’s a chart he created that sums it all up nicely. Amid some of the worst events in history, stocks have continued to eventually move higher, suggesting all those scary times and lower prices were really good opportunities. They sure didn’t feel like it at the time, but they were.
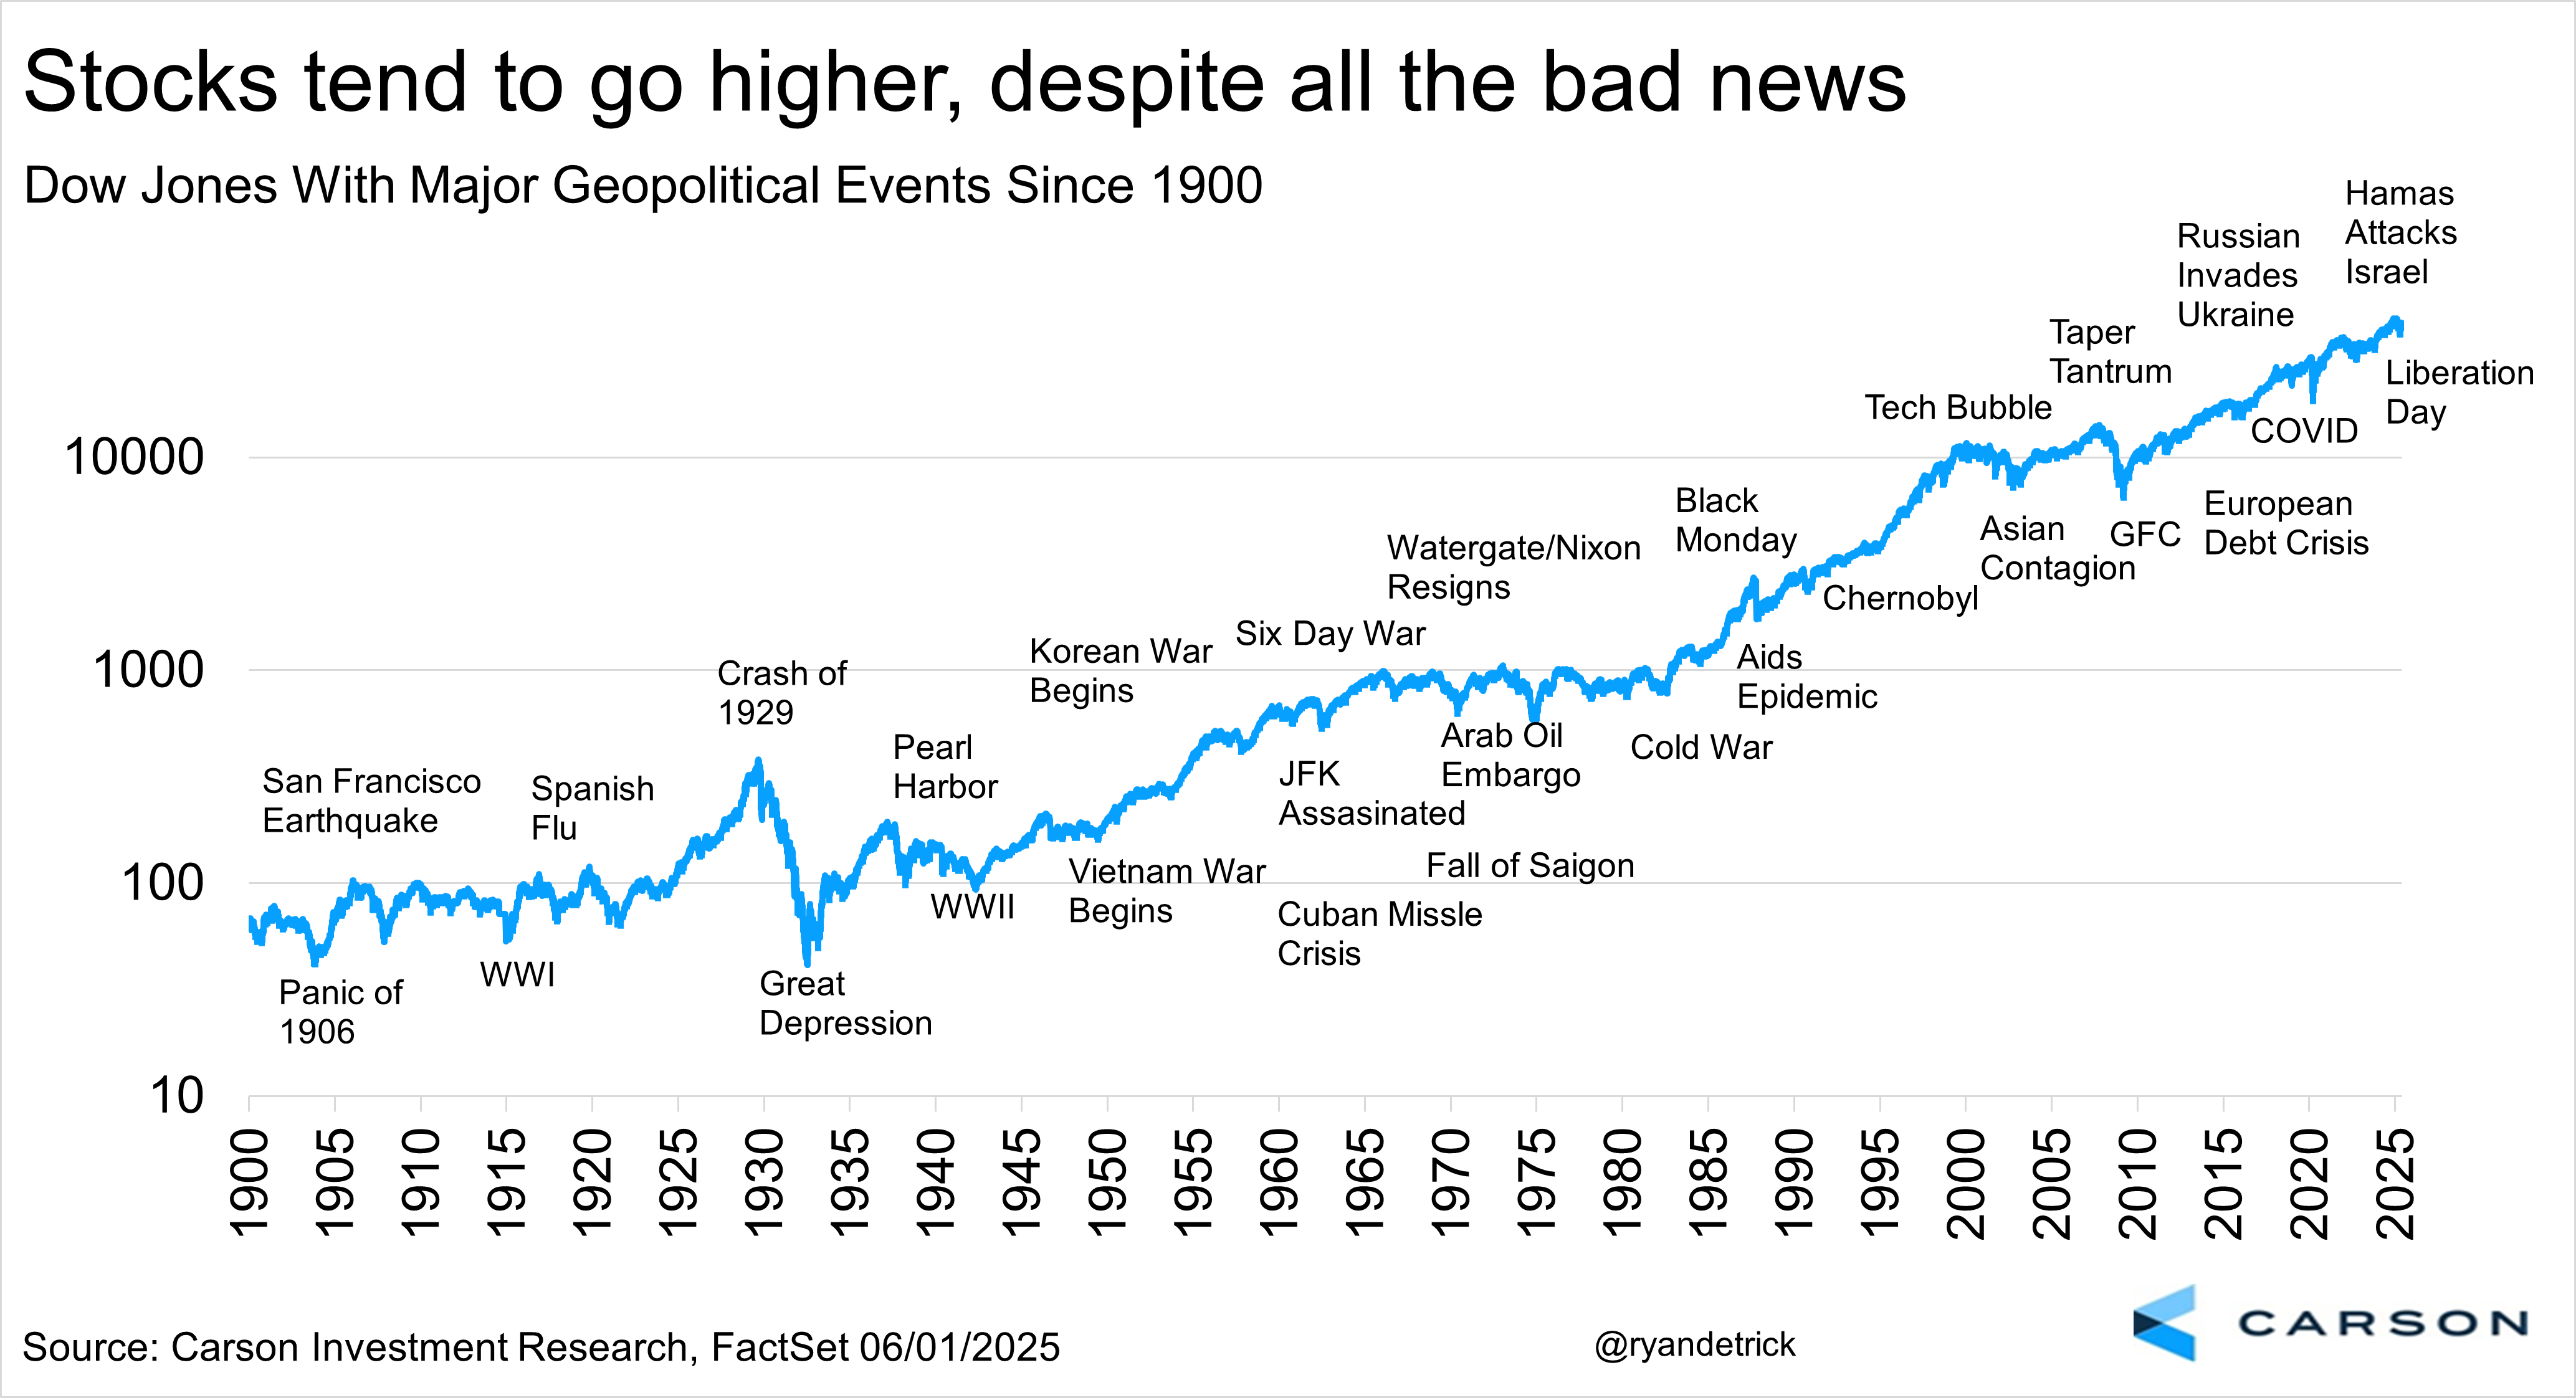
That doesn’t mean you should ignore these events, as they can cause a lot of volatility in markets, and even the economy. Russia’s invasion of Ukraine tipped inflation over the edge, and we got the higher inflation in 40 years back in 2022—ultimately resulting in a bear market for stocks, with bonds failing to provide diversification. 9/11 was another tragic event that pushed the economy over the edge into a recession, and pulling the dot-com crash into its third year. But the reality is bad news eventually will give way to good news. What that chart above doesn’t show is all the good things that have happened throughout history and it is safe to say they dwarf the negatives. If anything, the fact that the line in the chart has moved up and to the right over time tells you about the dynamism of the US economy, and US companies in particular, as they navigate all sorts of crises.
Volatility Is Normal
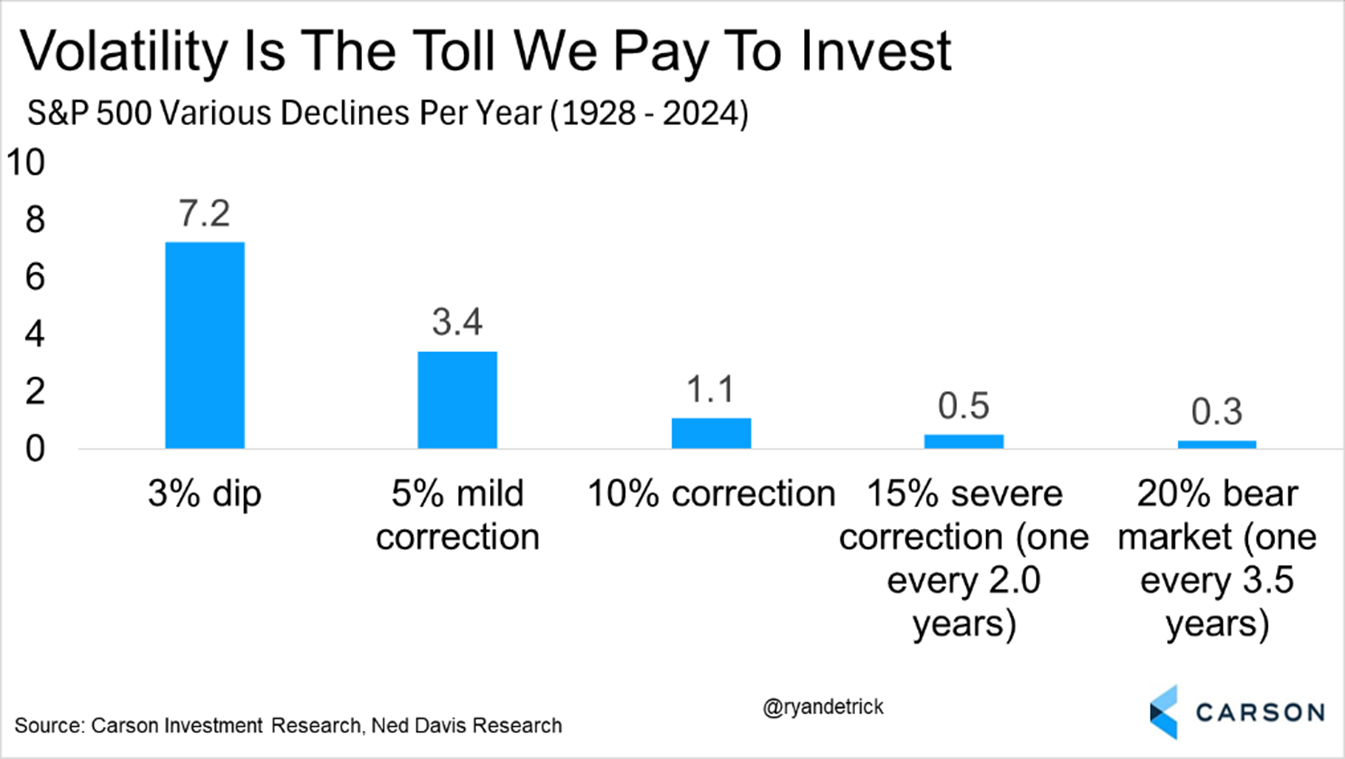
Of course, investing in stocks doesn’t come easy, and the return premium you get for investing in stocks over bonds (and pretty much most other asset classes over time) in part reflects the fact that they are volatile. We just went through a near bear market in April, with the market dropping just about 19%. I have no idea what happens over the next few days, or even weeks, but I do know that another bout of volatility would not be surprising. A market correction of 10% happens most years, and sometimes more than once. They are more normal than you might think.
The table below shows geopolitical events that have occurred over the last 80+ years (note that they vary a lot in terms of scale), along with median performance of the S&P 500 over the following year. The median return is a bit lower than the historical average return overall. The average return is also weaker than the median return for these events, signaling some asymmetrical downside risk. But context here is very important.
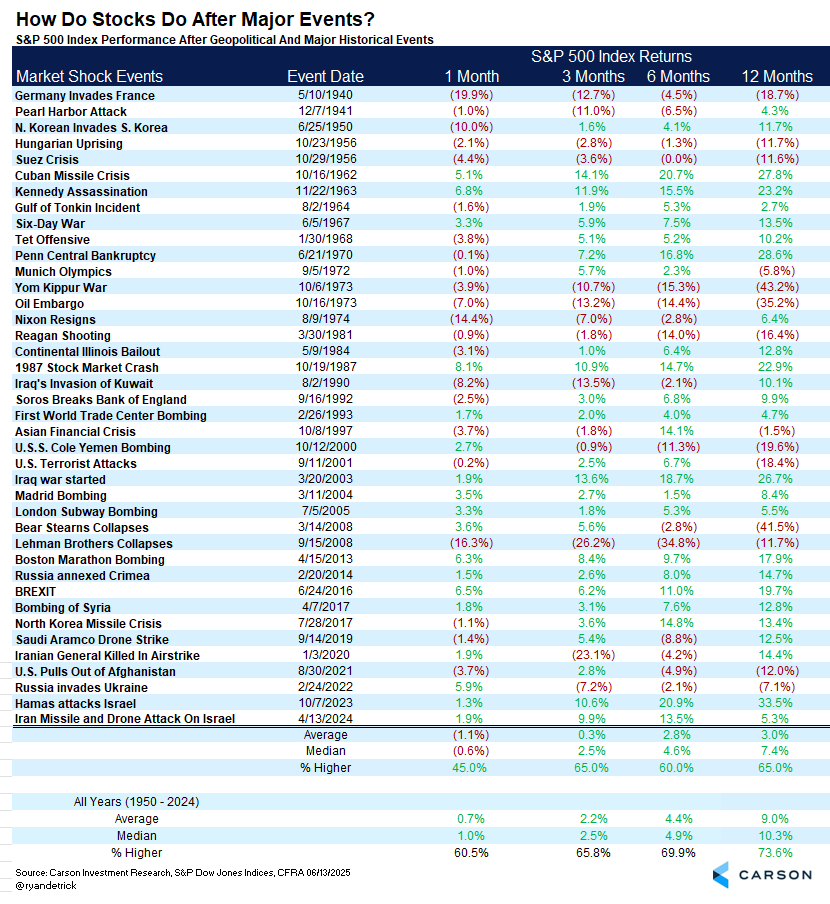
As my colleague Barry Gilbert wrote after Hamas attacked Israel in October 2023, much of the negative market behavior after these geopolitical events is often not driven by the event itself. For example, the U.S.S. Cole bombing was coincident with the tech bubble bursting in 2000. What stands out from the chart is not so much the downside risk of geopolitical events, but the coincidence of drawdowns and recessions independent of geopolitical risks. If you look at the major drawdowns, most take place during or near a recession, including 1956, 1973, and 2000-2001.
But there are cases where geopolitical risk played some role in the decline. For example, Russia’s invasion of Ukraine worsened already building inflationary pressures, eventually contributing to an aggressive Federal Reserve and weighing on equity markets. But that has been the exception rather than the rule. Markets saw strong gains despite the start of the Iraq invasion in 2003 and Israel’s Six-Day War in 1967. And, of course, the bigger picture beyond the more tactical 12-month time frame is that the markets have always recovered (going back to the first chart).
Stay on Top of Market Trends
The Carson Investment Research newsletter offers up-to-date market news, analysis and insights. Subscribe today!
"*" indicates required fields
Despite several Middle Eastern conflicts that did not lead to market drawdowns, the Yom Kippur War in 1973 played at least some role in the ensuing market sell-off. In October 1973, an Arab coalition led by Egypt and Syria launched a surprise attack against Israel on Judaism’s holiest day, Yom Kippur. After detecting Soviet resupply to Syria and Egypt, the U.S. began a massive resupply of Israel. The oil cartel OPEC responded by declaring an oil embargo against the U.S. and other countries. In 1973, the U.S. had grown increasingly dependent on foreign oil. As a result of the embargo, oil prices tripled and the added strain on the economy was one of the causes of the recession.
Could oil prices surge again? Perhaps, but OPEC has plenty of capacity to ramp up production (and will be under immense pressure from the Trump administration to do so). US shale will also be bolstered by oil prices rising above $70/barrel, and that is another major potential source of supply. Of course, the scale of disruption matters here, as we saw after Russia’s invasion of Ukraine.
Diversification Helps, Even More So Now
Diversification has not been a portfolio allocator’s friend over the last decade, but it’s proven its mettle this year after the Liberation Day tariffs. Uncertainty related to policy has been high this year, and as we’ve noted across several blogs this year, “when in doubt, diversify it out” (credit to my colleague Grant Engelbart for coining this). We do remain overweight equities, but are underweight small and mid-cap stocks, which helps reduce overall portfolio volatility. Also, since the beginning of the year (even prior to Liberation Day) we moved to a more neutral weight across US and international stocks.
One striking thing that’s happened post-Liberation Day is that even as stocks (and bonds) have more or less retraced their moves, the dollar has continued to weaken. During the early moments of the latest Middle East tensions, it was noteworthy that the dollar didn’t strengthen as much as it has during previous risk-off situations like these. S&P 500 futures plunged over 1.5% after the news came out, but even bond yields didn’t drop as much as you’d normally expect given the situation. Within a few hours of the strikes, the US dollar index was up less than 0.3% and the 10-year yield was down just 0.02%-points. It was clear that the typical “safe haven” bid for the US dollar and US Treasuries was missing. It’s hard to say whether there’s a structural shift—there’s enormous uncertainty around that. But if the dollar continues to weaken, that’s going to help international stocks relative to US stocks.
Even beyond stocks, one thing we have been discussing for a couple of years now is the need to diversify our diversifiers and go beyond bonds to diversify portfolio risk. Bonds may work well in a deflationary recession type environment, but not in one where we see more inflation volatility. And that’s certainly a possibility given potential supply shocks across the world (including tariffs, but also geopolitical tensions). This is why we are overweight low volatility stocks and include other non-correlated asset classes like gold and managed futures (which often includes commodities exposure) within our diversifier bucket. At the same time, we still have longer-term bonds as part of the mix.
Here’s a table Barry’s shared for some time now, showing which diversifiers worked (or didn’t) in major drawdowns since 1998’s 19.2% S&P 500 decline. What’s worked best has depended on the market environment. Most generally, bonds have fared well and commodities have fared poorly in downturns, but sometimes it’s been dramatically different, like in 2022 when inflation (and oil prices) spiked. Outside of 2022, it makes sense that commodities have underperformed—stock downturns often happen during periods of economic weakness, when lower demand weighs on commodity prices. But gold is not primarily an industrial commodity, so its pattern has been different.
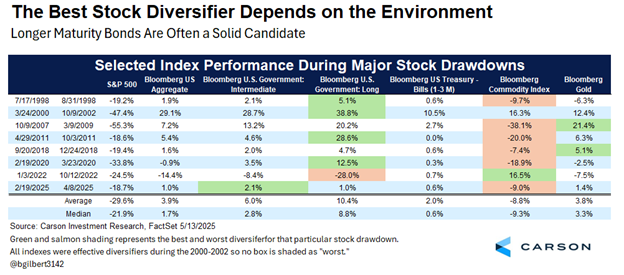
From a portfolio perspective, the takeaways are that diversification is important, but it’s not enough to rely on a single source of diversification in a portfolio all the time. It’s important to understand what environment you’re in. And if the environment is uncertain, as we think the current one is, having exposure to different kinds of diversifiers can be beneficial.
The Carson Investment Research team has not changed its overall market outlook in response to the conflict, although we continue to monitor the situation closely. The economy is not as strong as it was a year ago, or even two years ago. The labor market is looking more shaky amid weak hiring, and elevated rates and tariff uncertainty has led to struggles within the housing and manufacturing sectors. As I wrote last week, our own proprietary leading economic index tells us that risks are higher than they were at the end of last year, and that’s something to be aware of. This is a big reason why we’re cautiously overweight equities, rather than pedal to the metal (as we were over the last two years). And why our portfolios are more diversified than they have been in the past.
8071521.1-06.13.25
For more content by Sonu Varghese, VP, Global Macro Strategist click here