
The May payroll report showed that labor markets remain OK, at least on the surface. As I wrote in my payroll blog, there’s weakness under the hood, but surface resiliency means the Federal Reserve (Fed) is likely to stay on pause for a lot longer—unless the unemployment rate really picks up, and then we have bigger problems because once it has upward momentum, it’s hard to reverse. In short, policy is tight right now and it’s going to remain tight until the Fed sees more data. And that’s going to drag even more on cyclical areas of the economy, notably housing.
We actually have a big problem in housing and some of that is because of what happened soon after Covid.
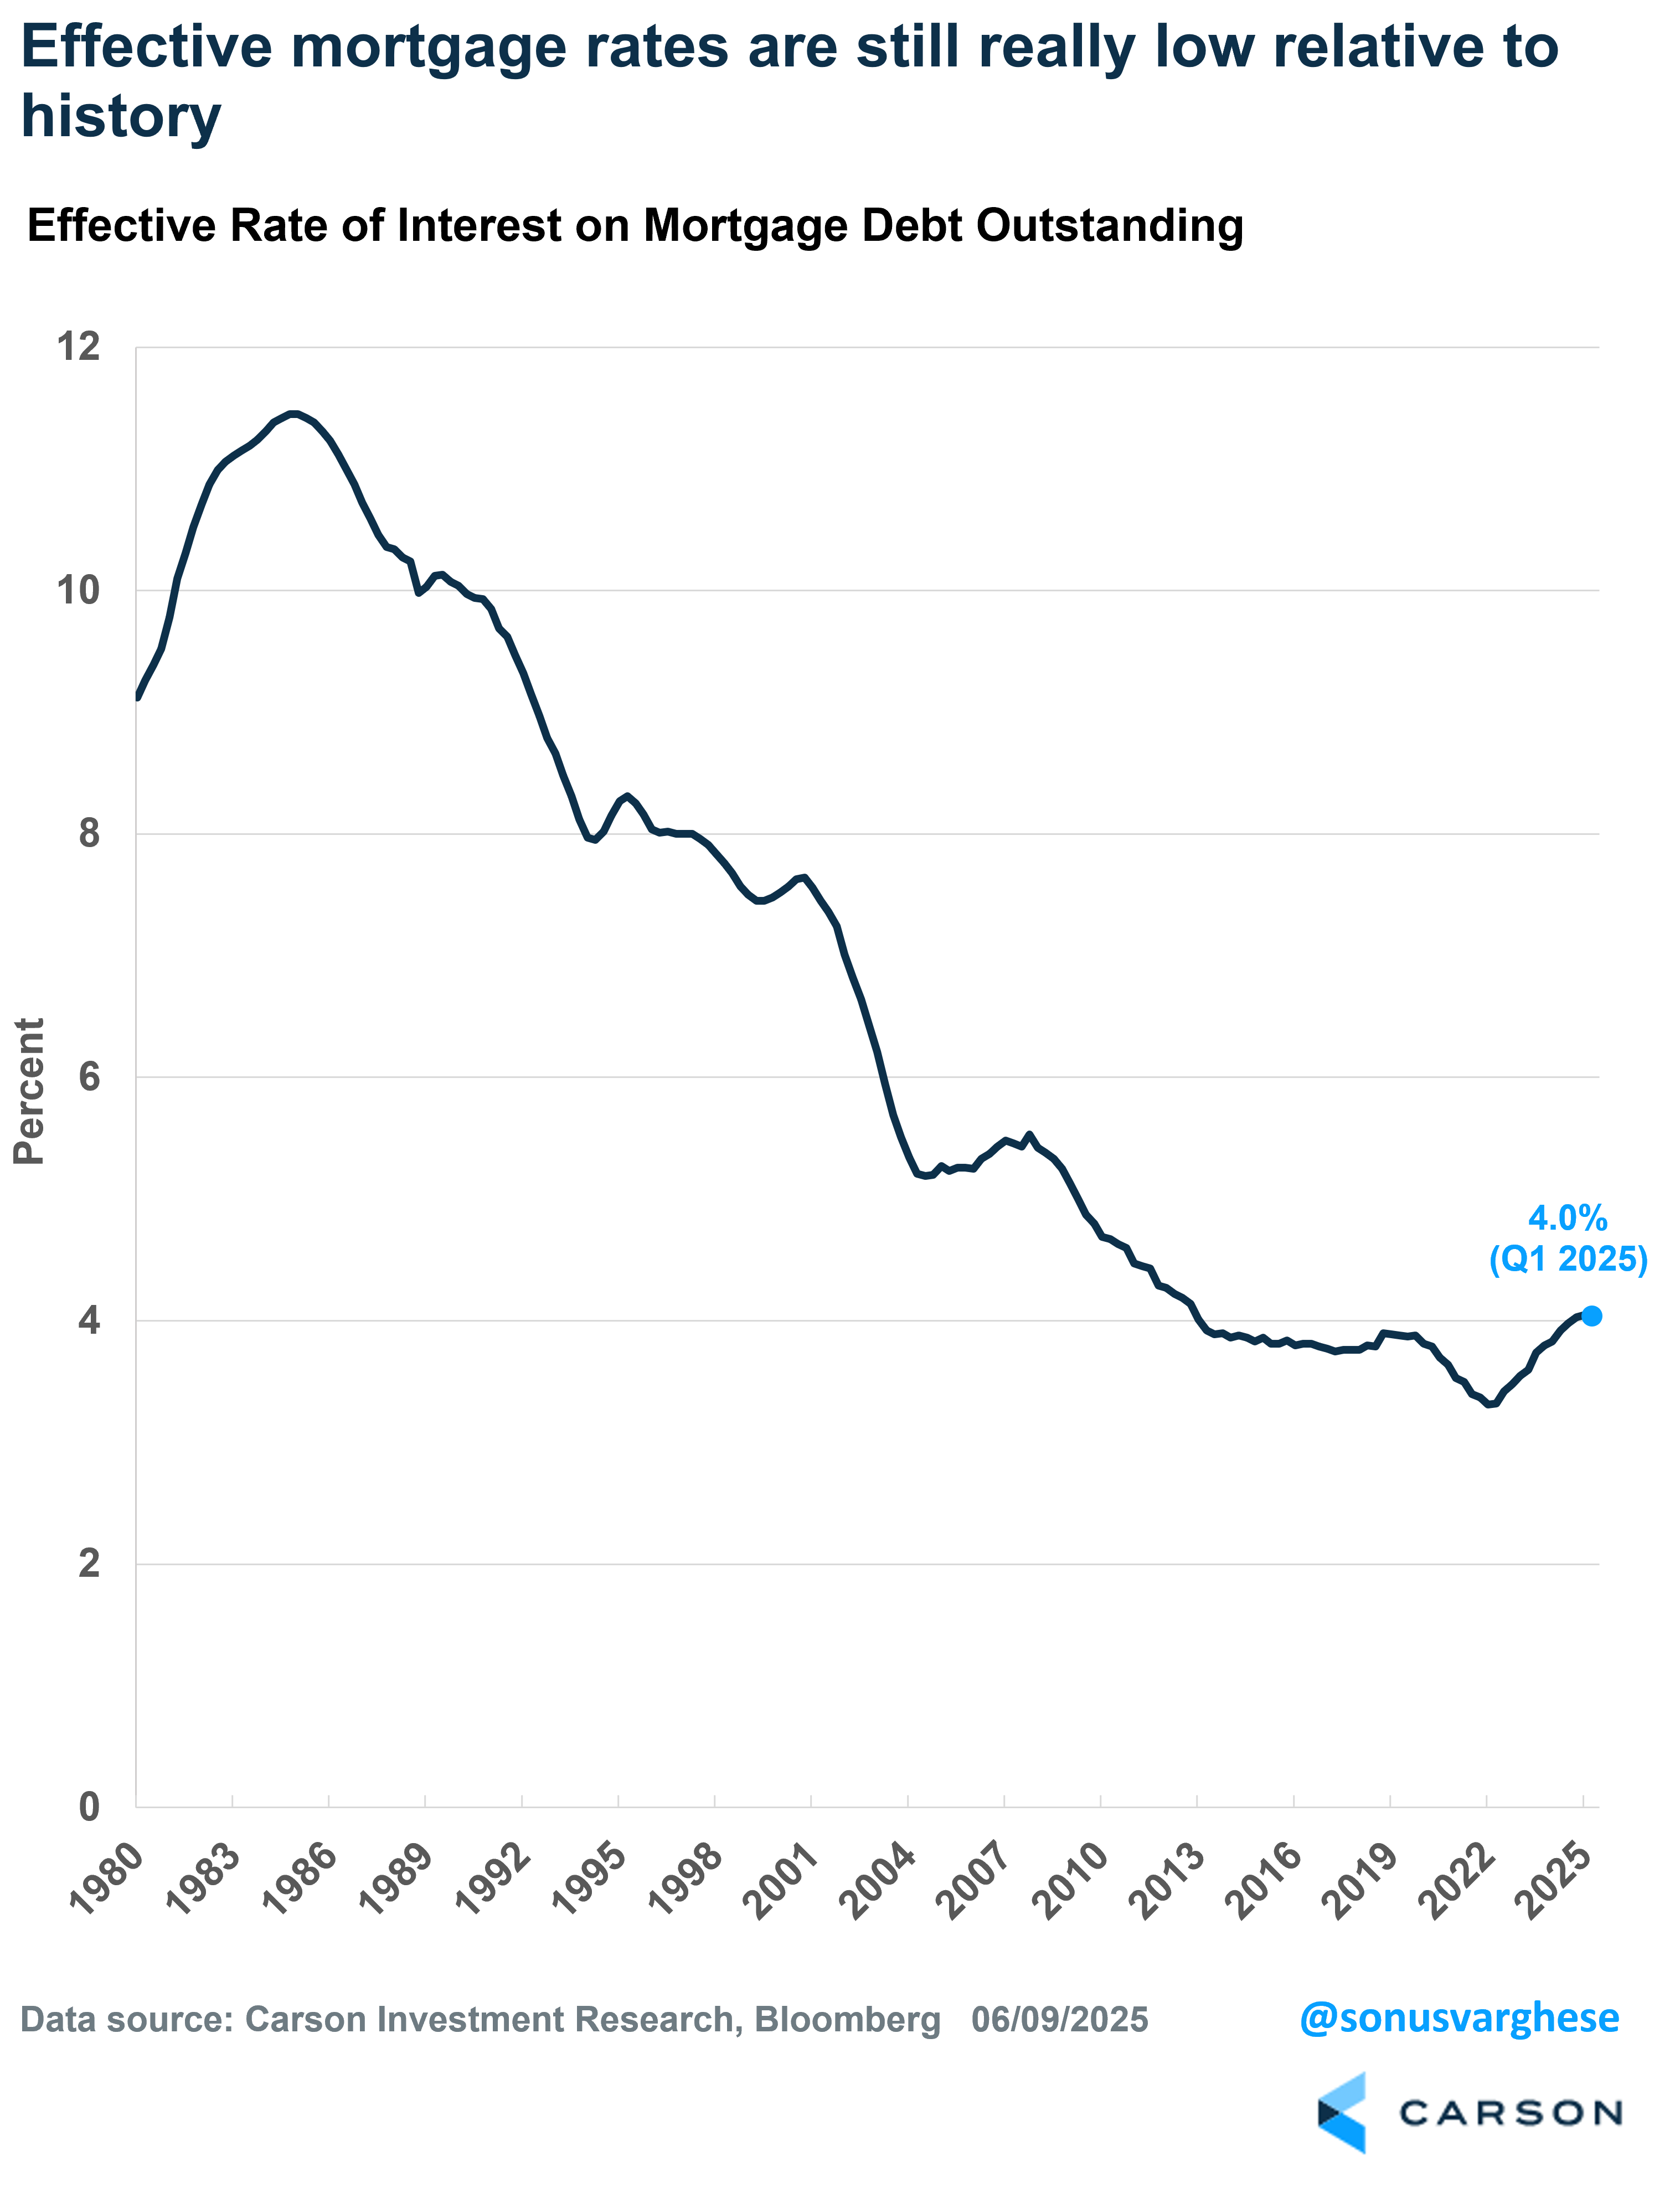
Most homeowners were able to buy or refinance at mortgage rates close to 3% in 2020 – 2021, and that meant more money in household pockets. The average effective mortgage rate (on outstanding mortgage debt) collapsed to 3.3% by early 2022. It’s risen since then, but remains close to 4%, well below historical levels. This is important because existing homeowners who have low mortgages wouldn’t want to part with them unless they had to.
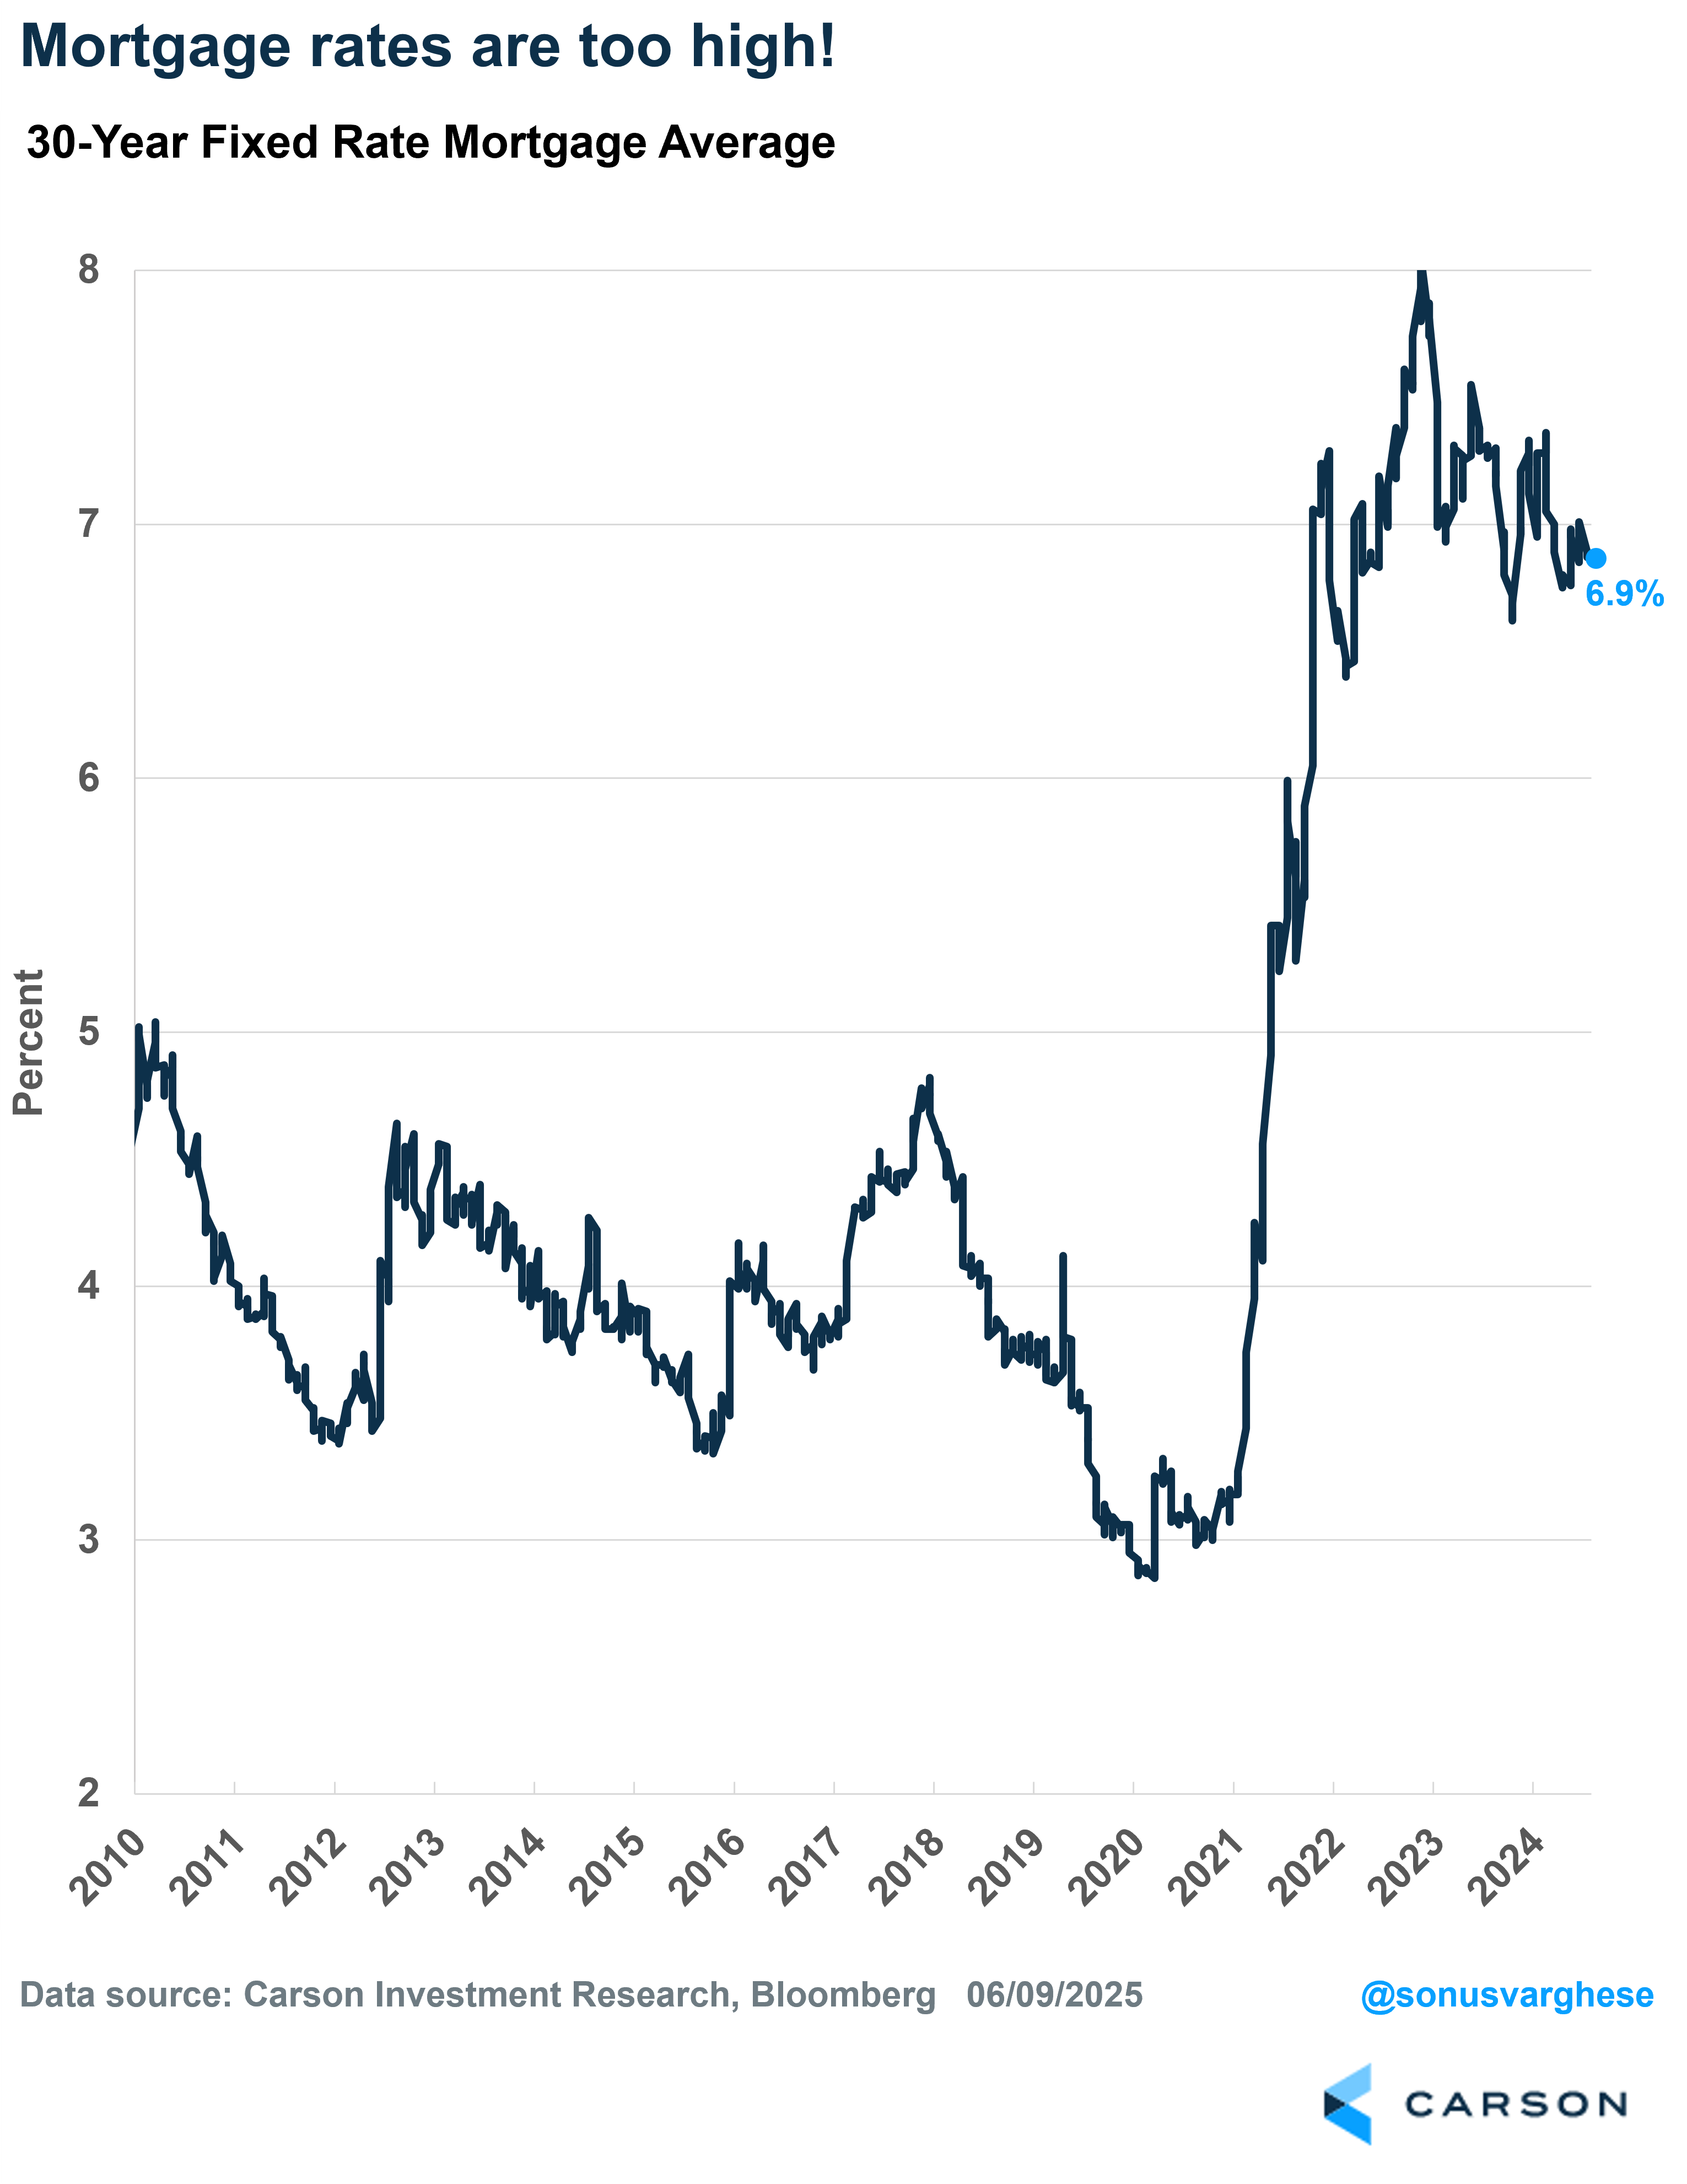
Once rates surged in 2022, new homebuyers were locked out of the market as affordability collapsed. Mortgage rates surged as the Fed raised rates and have now averaged 6.5 – 7% for two and a half years.
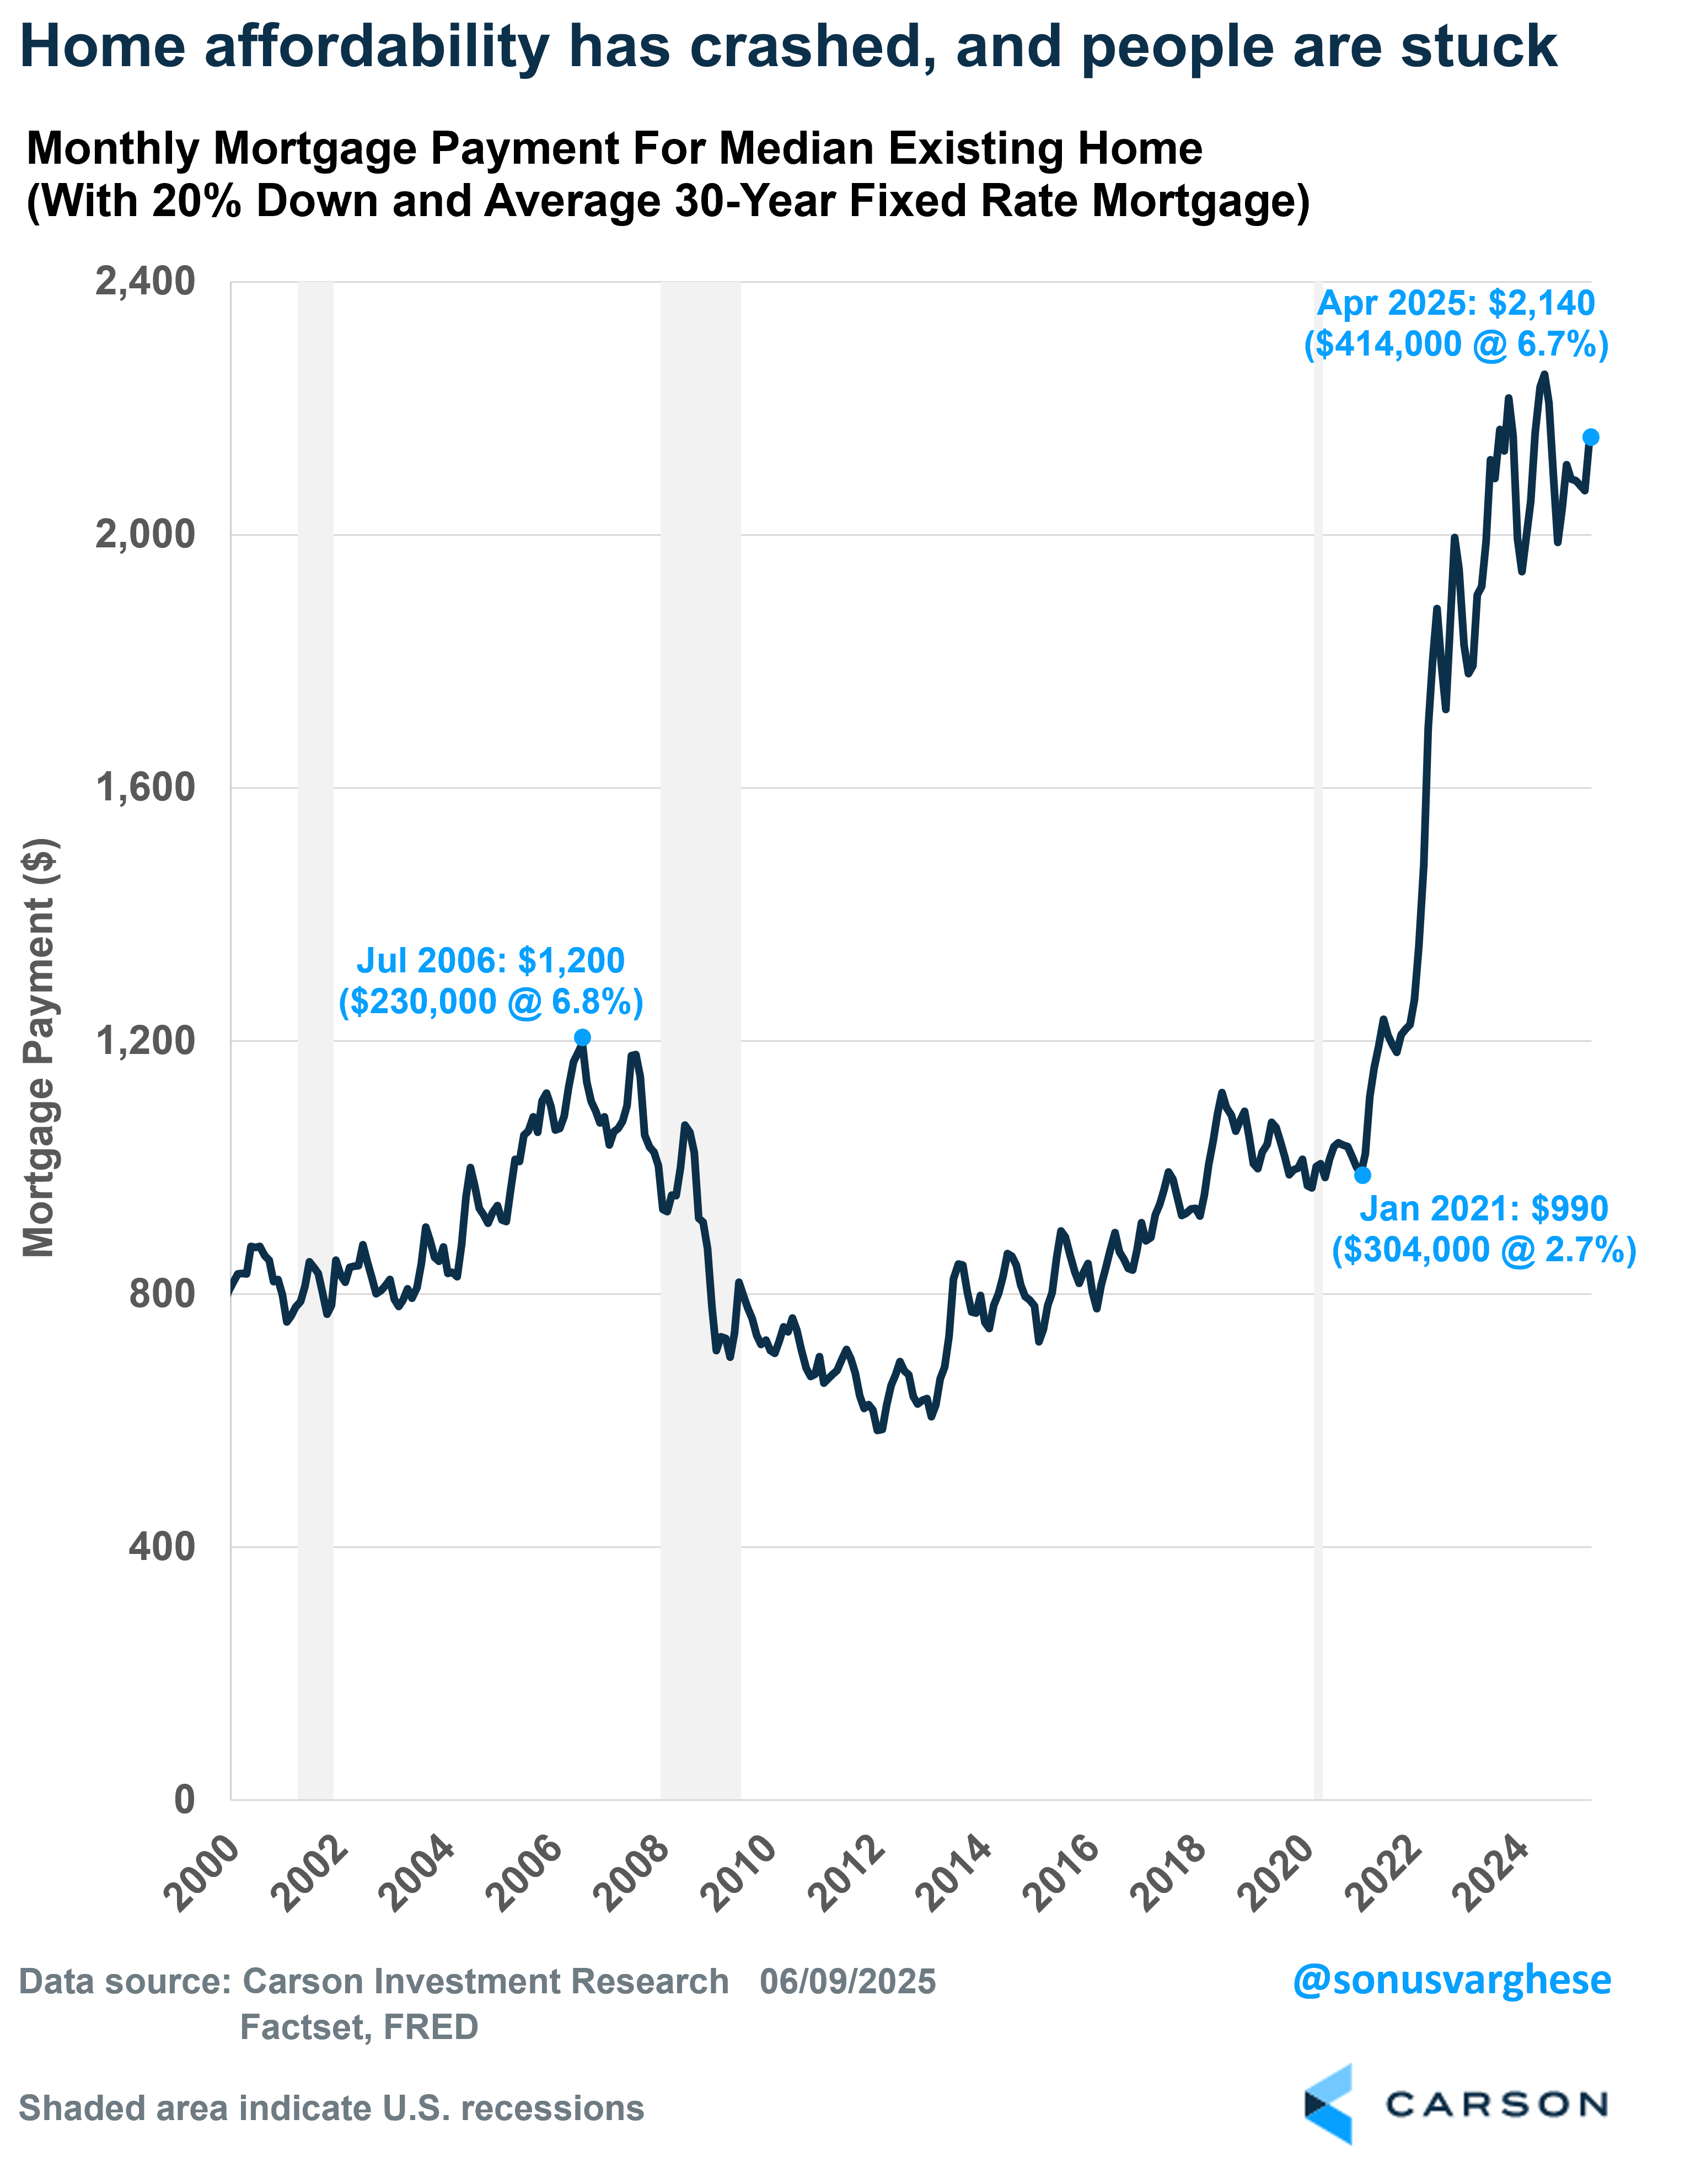
On top of higher mortgage rates, housing inventory was low and so home prices moved higher, as existing homeowners were reluctant to put their house on the market. High mortgage rates and high home prices have been a double whammy for affordability. Here’s a comparison of monthly mortgage payments at different times, assuming 20% down, prevailing mortgage rates, and median home prices:
- Jan 2021: $990
- Jun 2022: $1,880
- Jun 2024: $2,250
- Apr 2025: $2,140
Affordability has hardly improved over the last two years. Keep in mind that in 2021 – 2022, wage growth was running around 5 – 6%, but that’s pulled back to below 4% now (using the Employment Cost Index). Meanwhile, mortgage rates have gone in the other direction.
Inventory Rising and Home Prices Easing
Higher home prices are good for homeowners unless you want to move to another home (because that home is also more expensive) with a higher mortgage rate. Of course, this can go on for only so long. If you have to move, you have to move, and this year we’re starting to see supply increase.
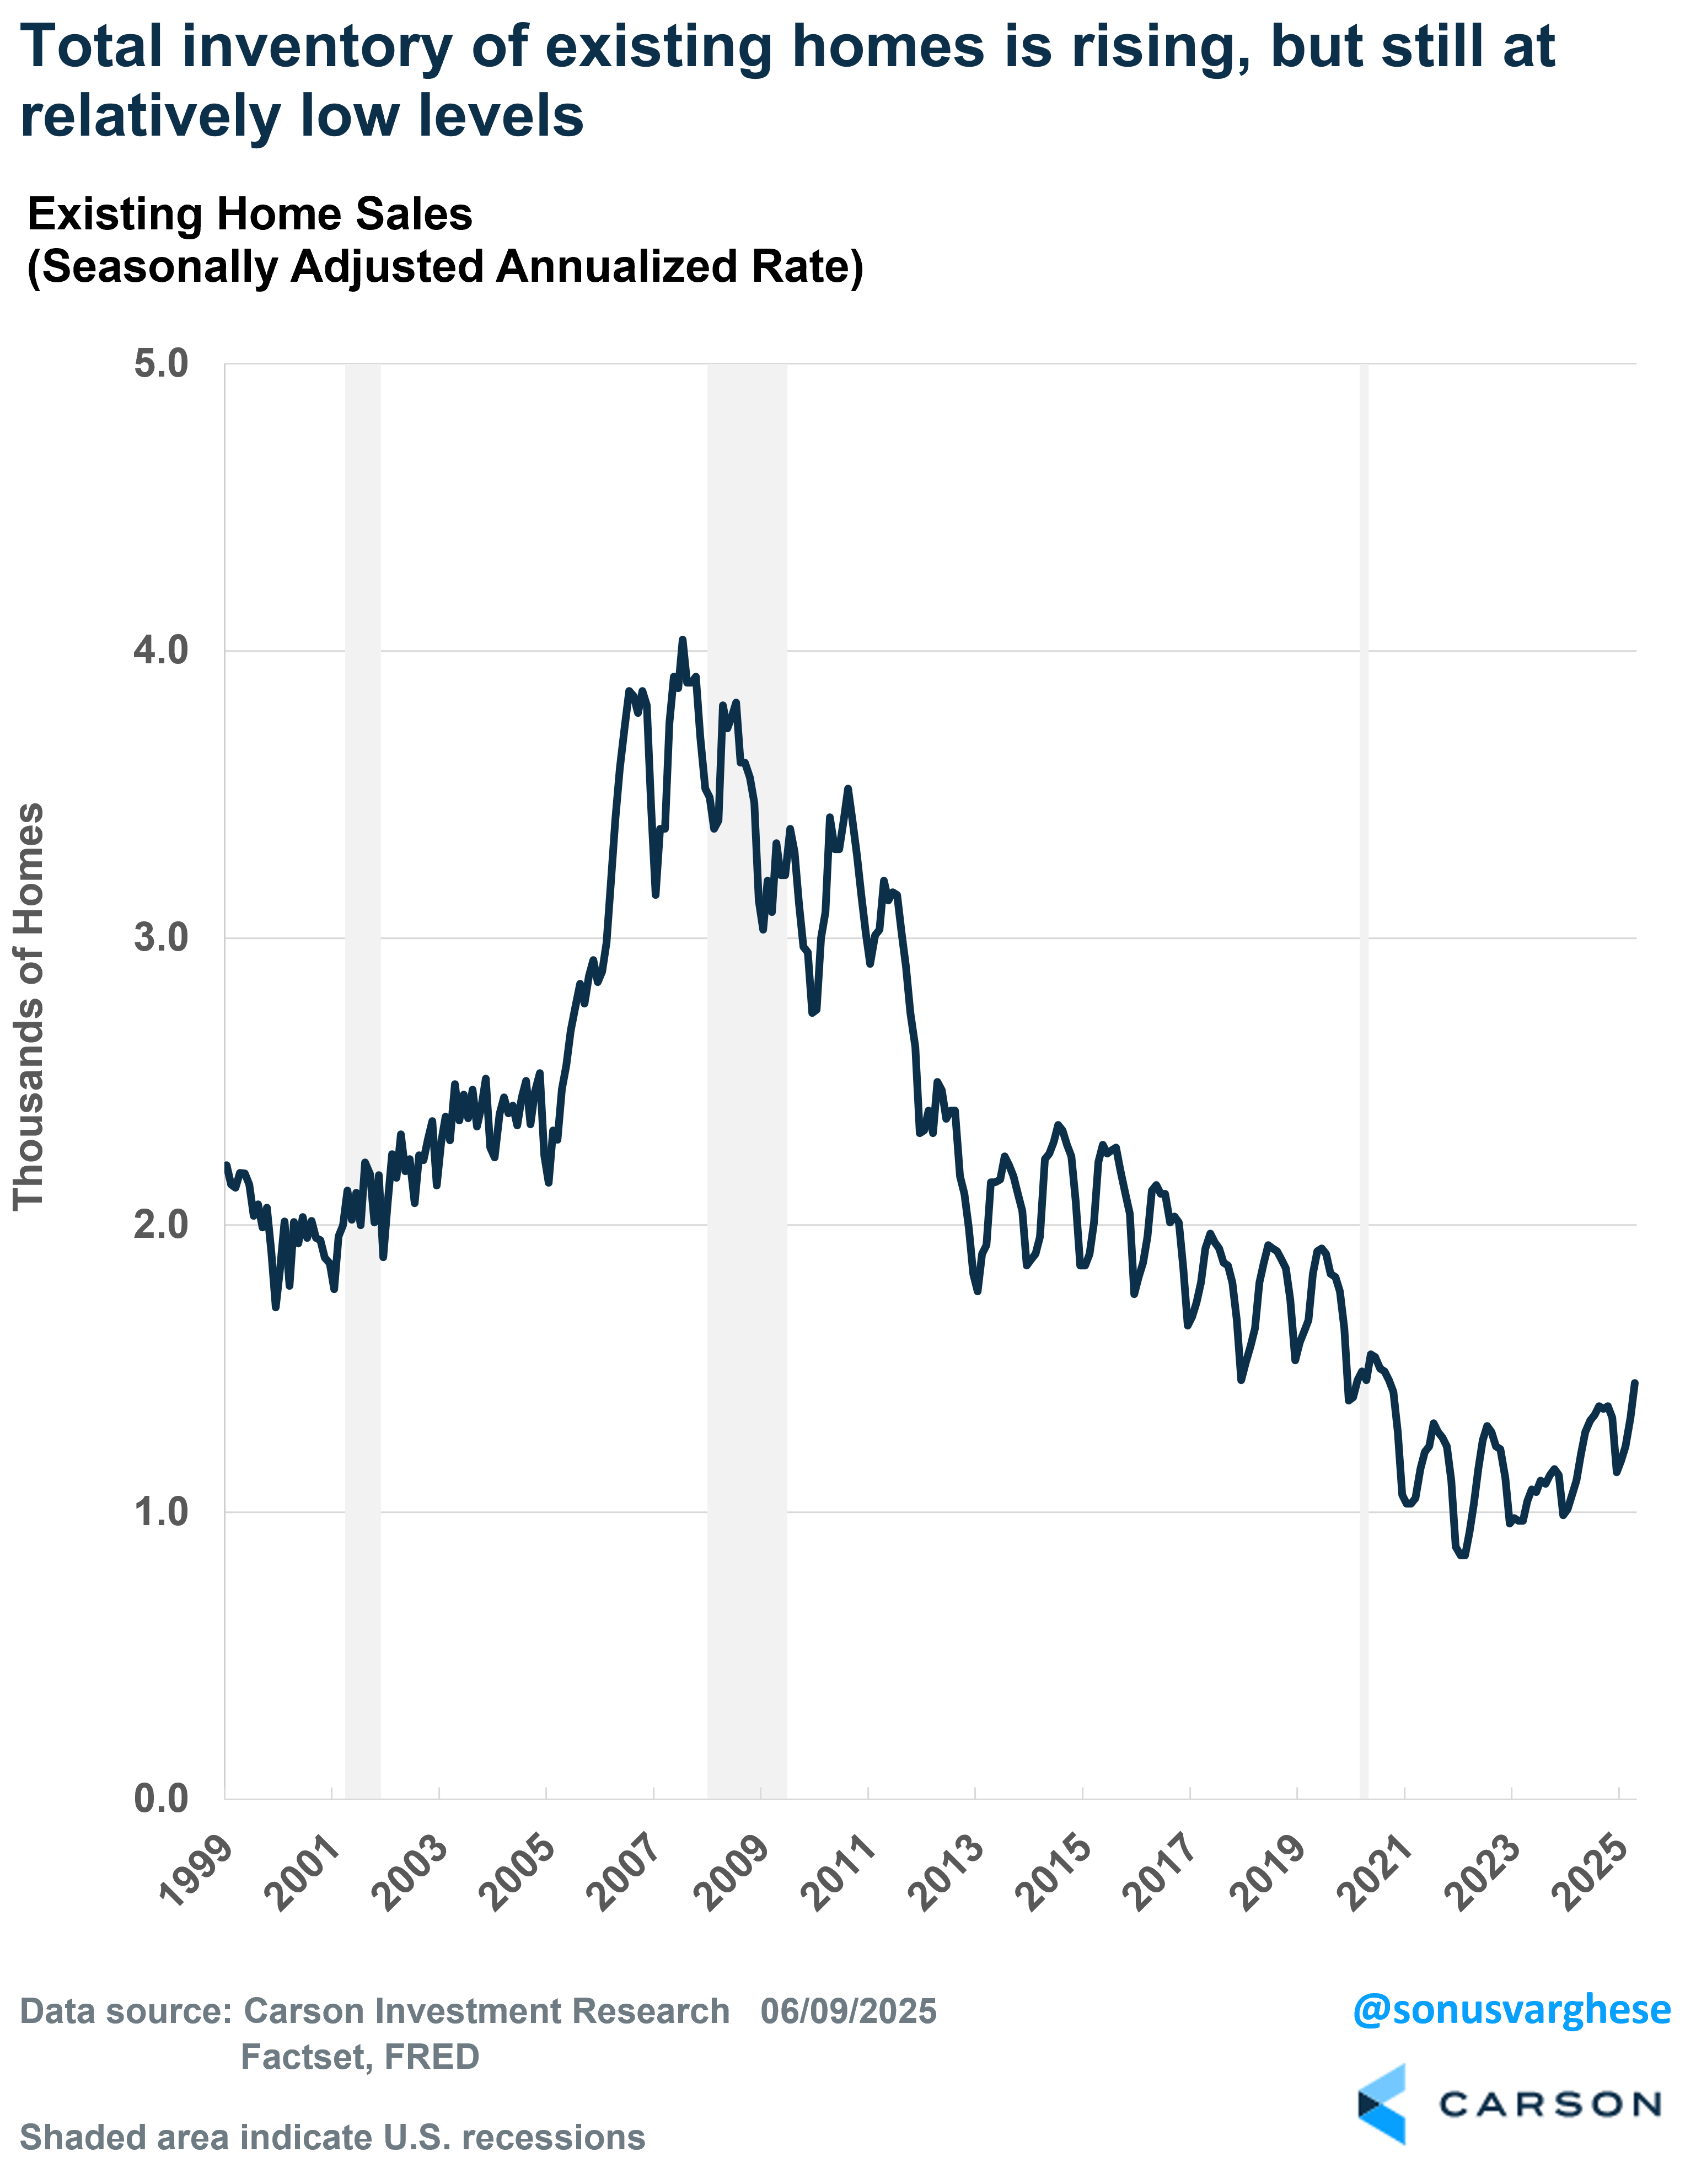
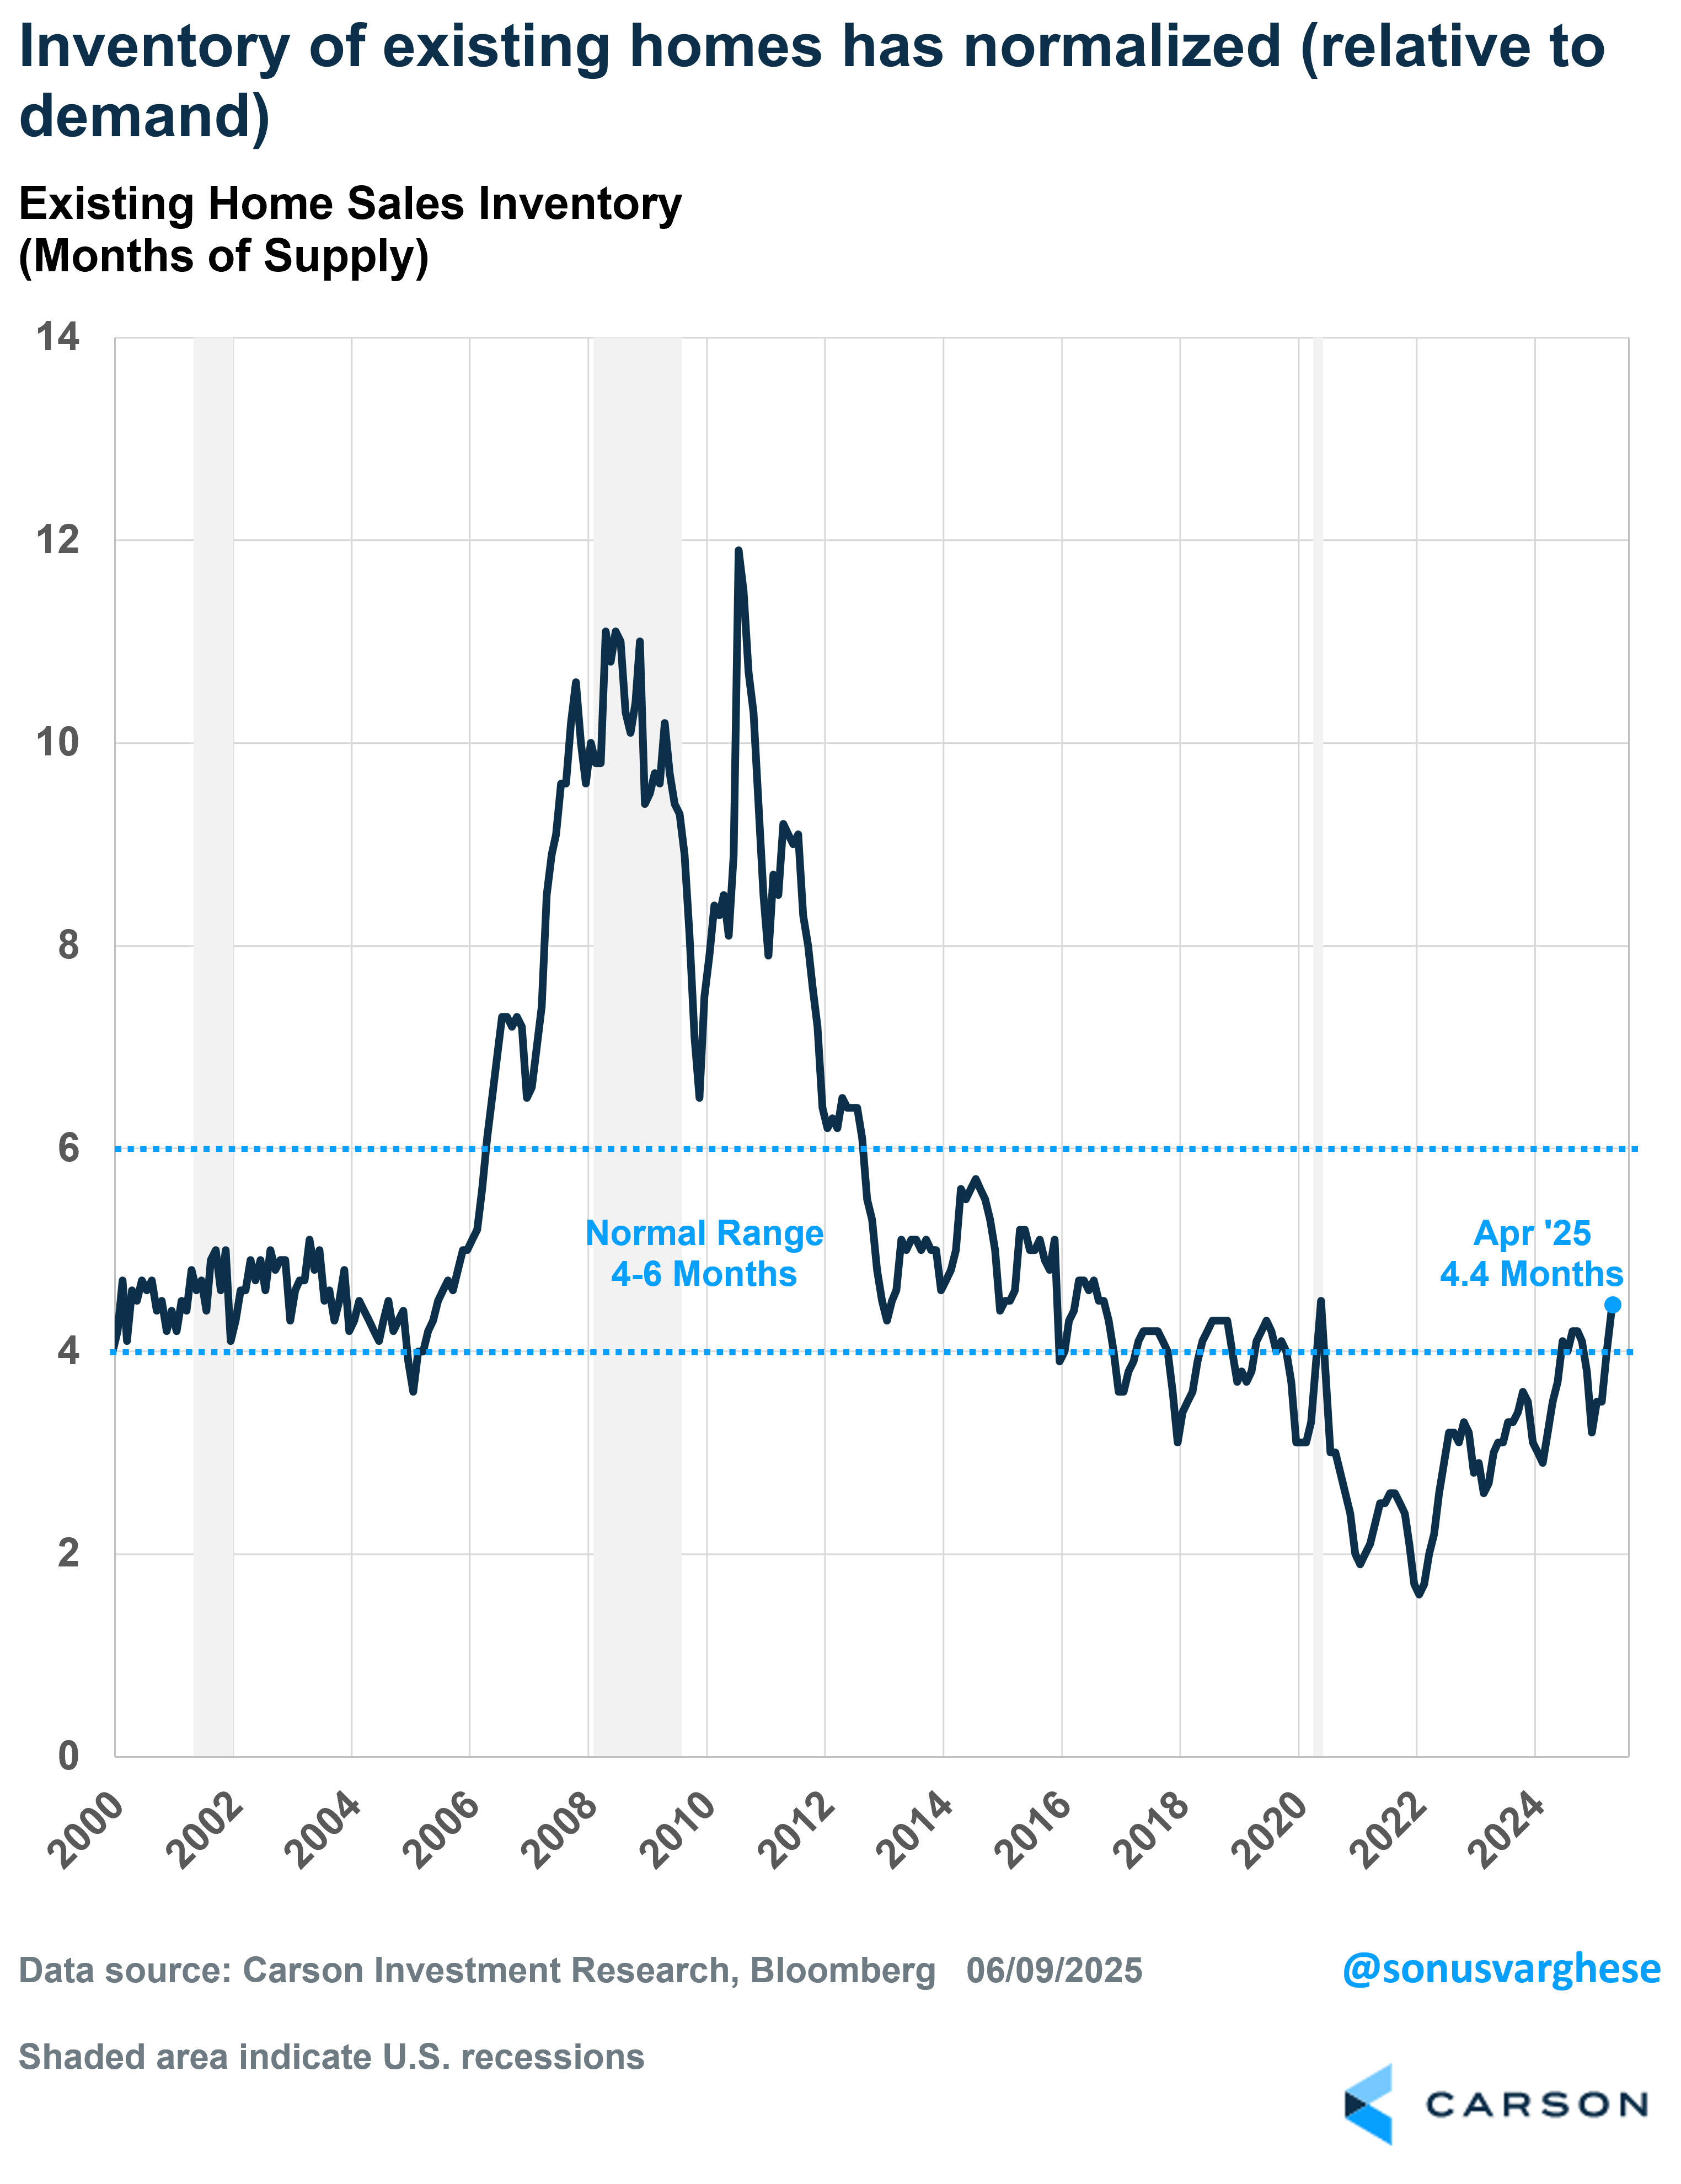
The inventory of existing homes (which widely outnumber new homes) is at 1.5 million as of April 2025, up 21% from a year ago. Of course, as you can see below, inventory is still low relative to history—it’s down 17% from average 2019 levels. For perspective, inventory averaged 3.1 million in 2005 – 2006. Now, that was a bubble, with a lot of overbuilding, but the population is much larger now. In fact, the millennial cohort (currently in their prime home-buying years) is the largest in generations, but as I noted above, affordability has crashed.
With lower demand and poor sales (due to poor affordability) inventories do look more typical versus history if you normalize inventory by sales. The current months-of-supply is now at 4.4, which is in the normal range of 4 – 6 months of supply. This matters for home prices.
Home prices have historically been inversely correlated with inventory levels. Over the last 25 years, we’ve seen that as inventory pulls back, home prices generally rise, and as inventory rises, home prices ease. The only anomalous period was really in late 2022, when activity plunged amid rapidly rising rates, and that put downward pressure on home prices.
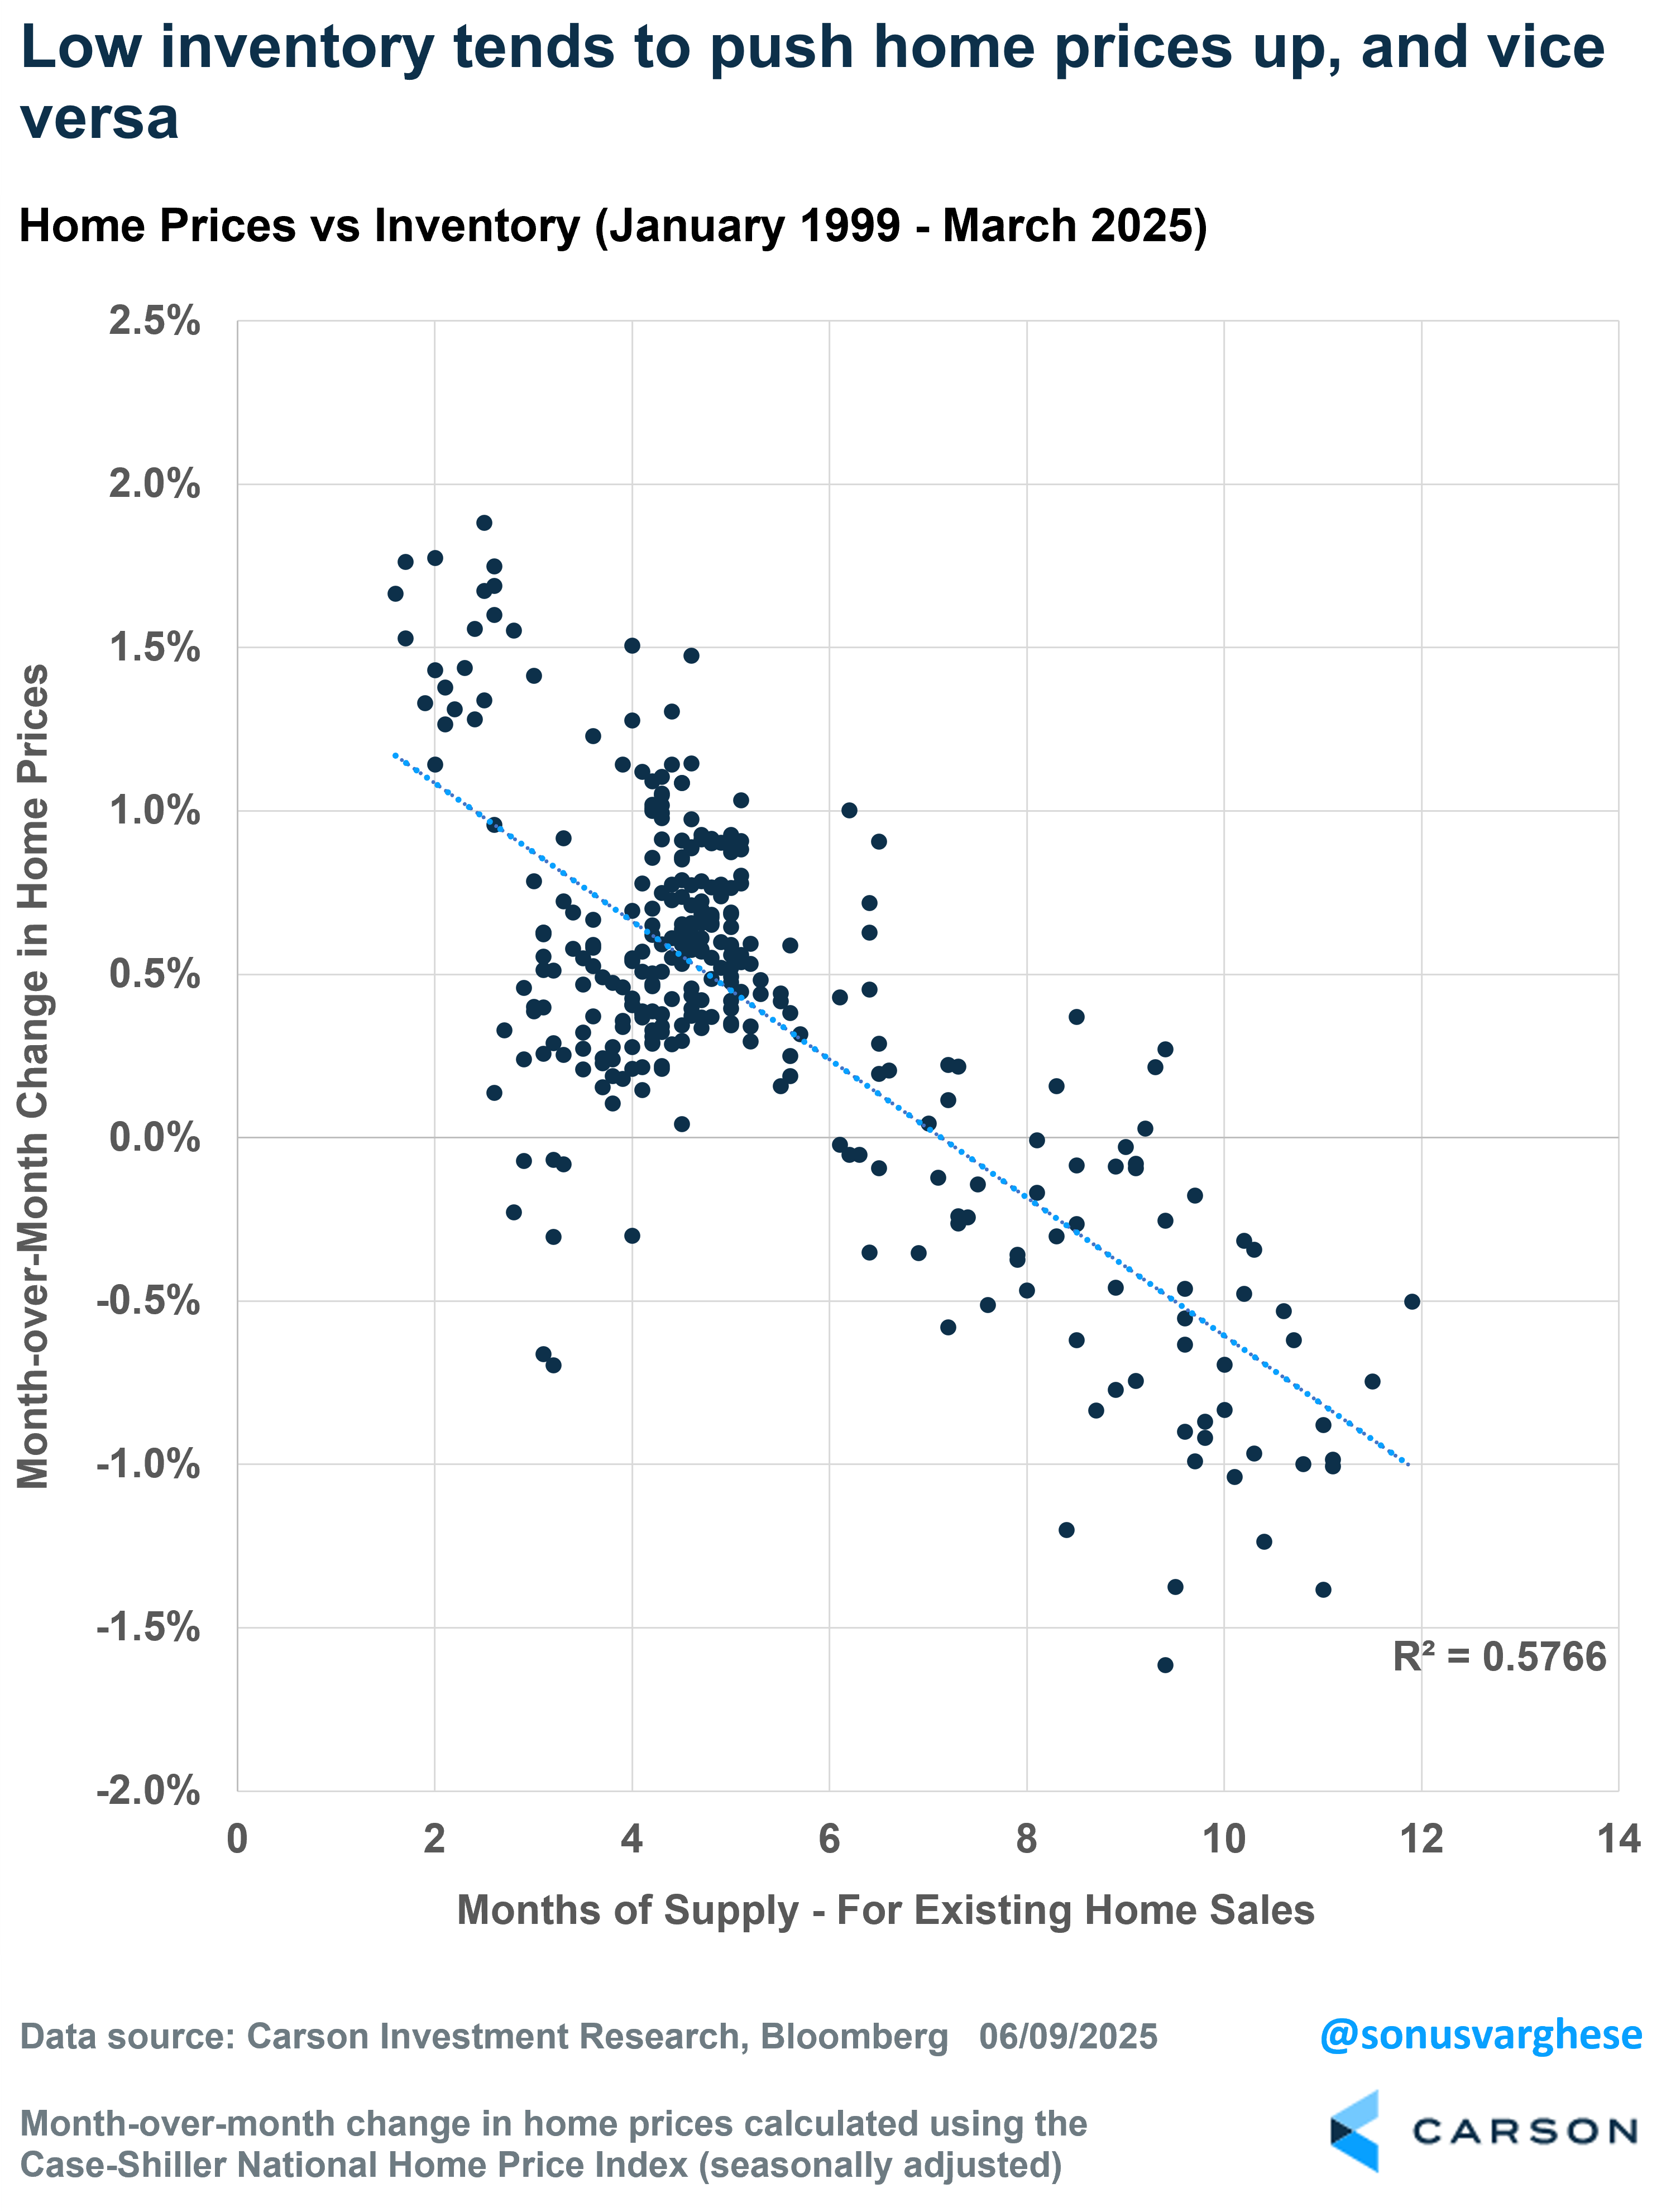
Over the last two years, low inventory helped move prices higher, despite higher mortgage rates and less activity in the market. But now that’s reversing, as inventory picks up.
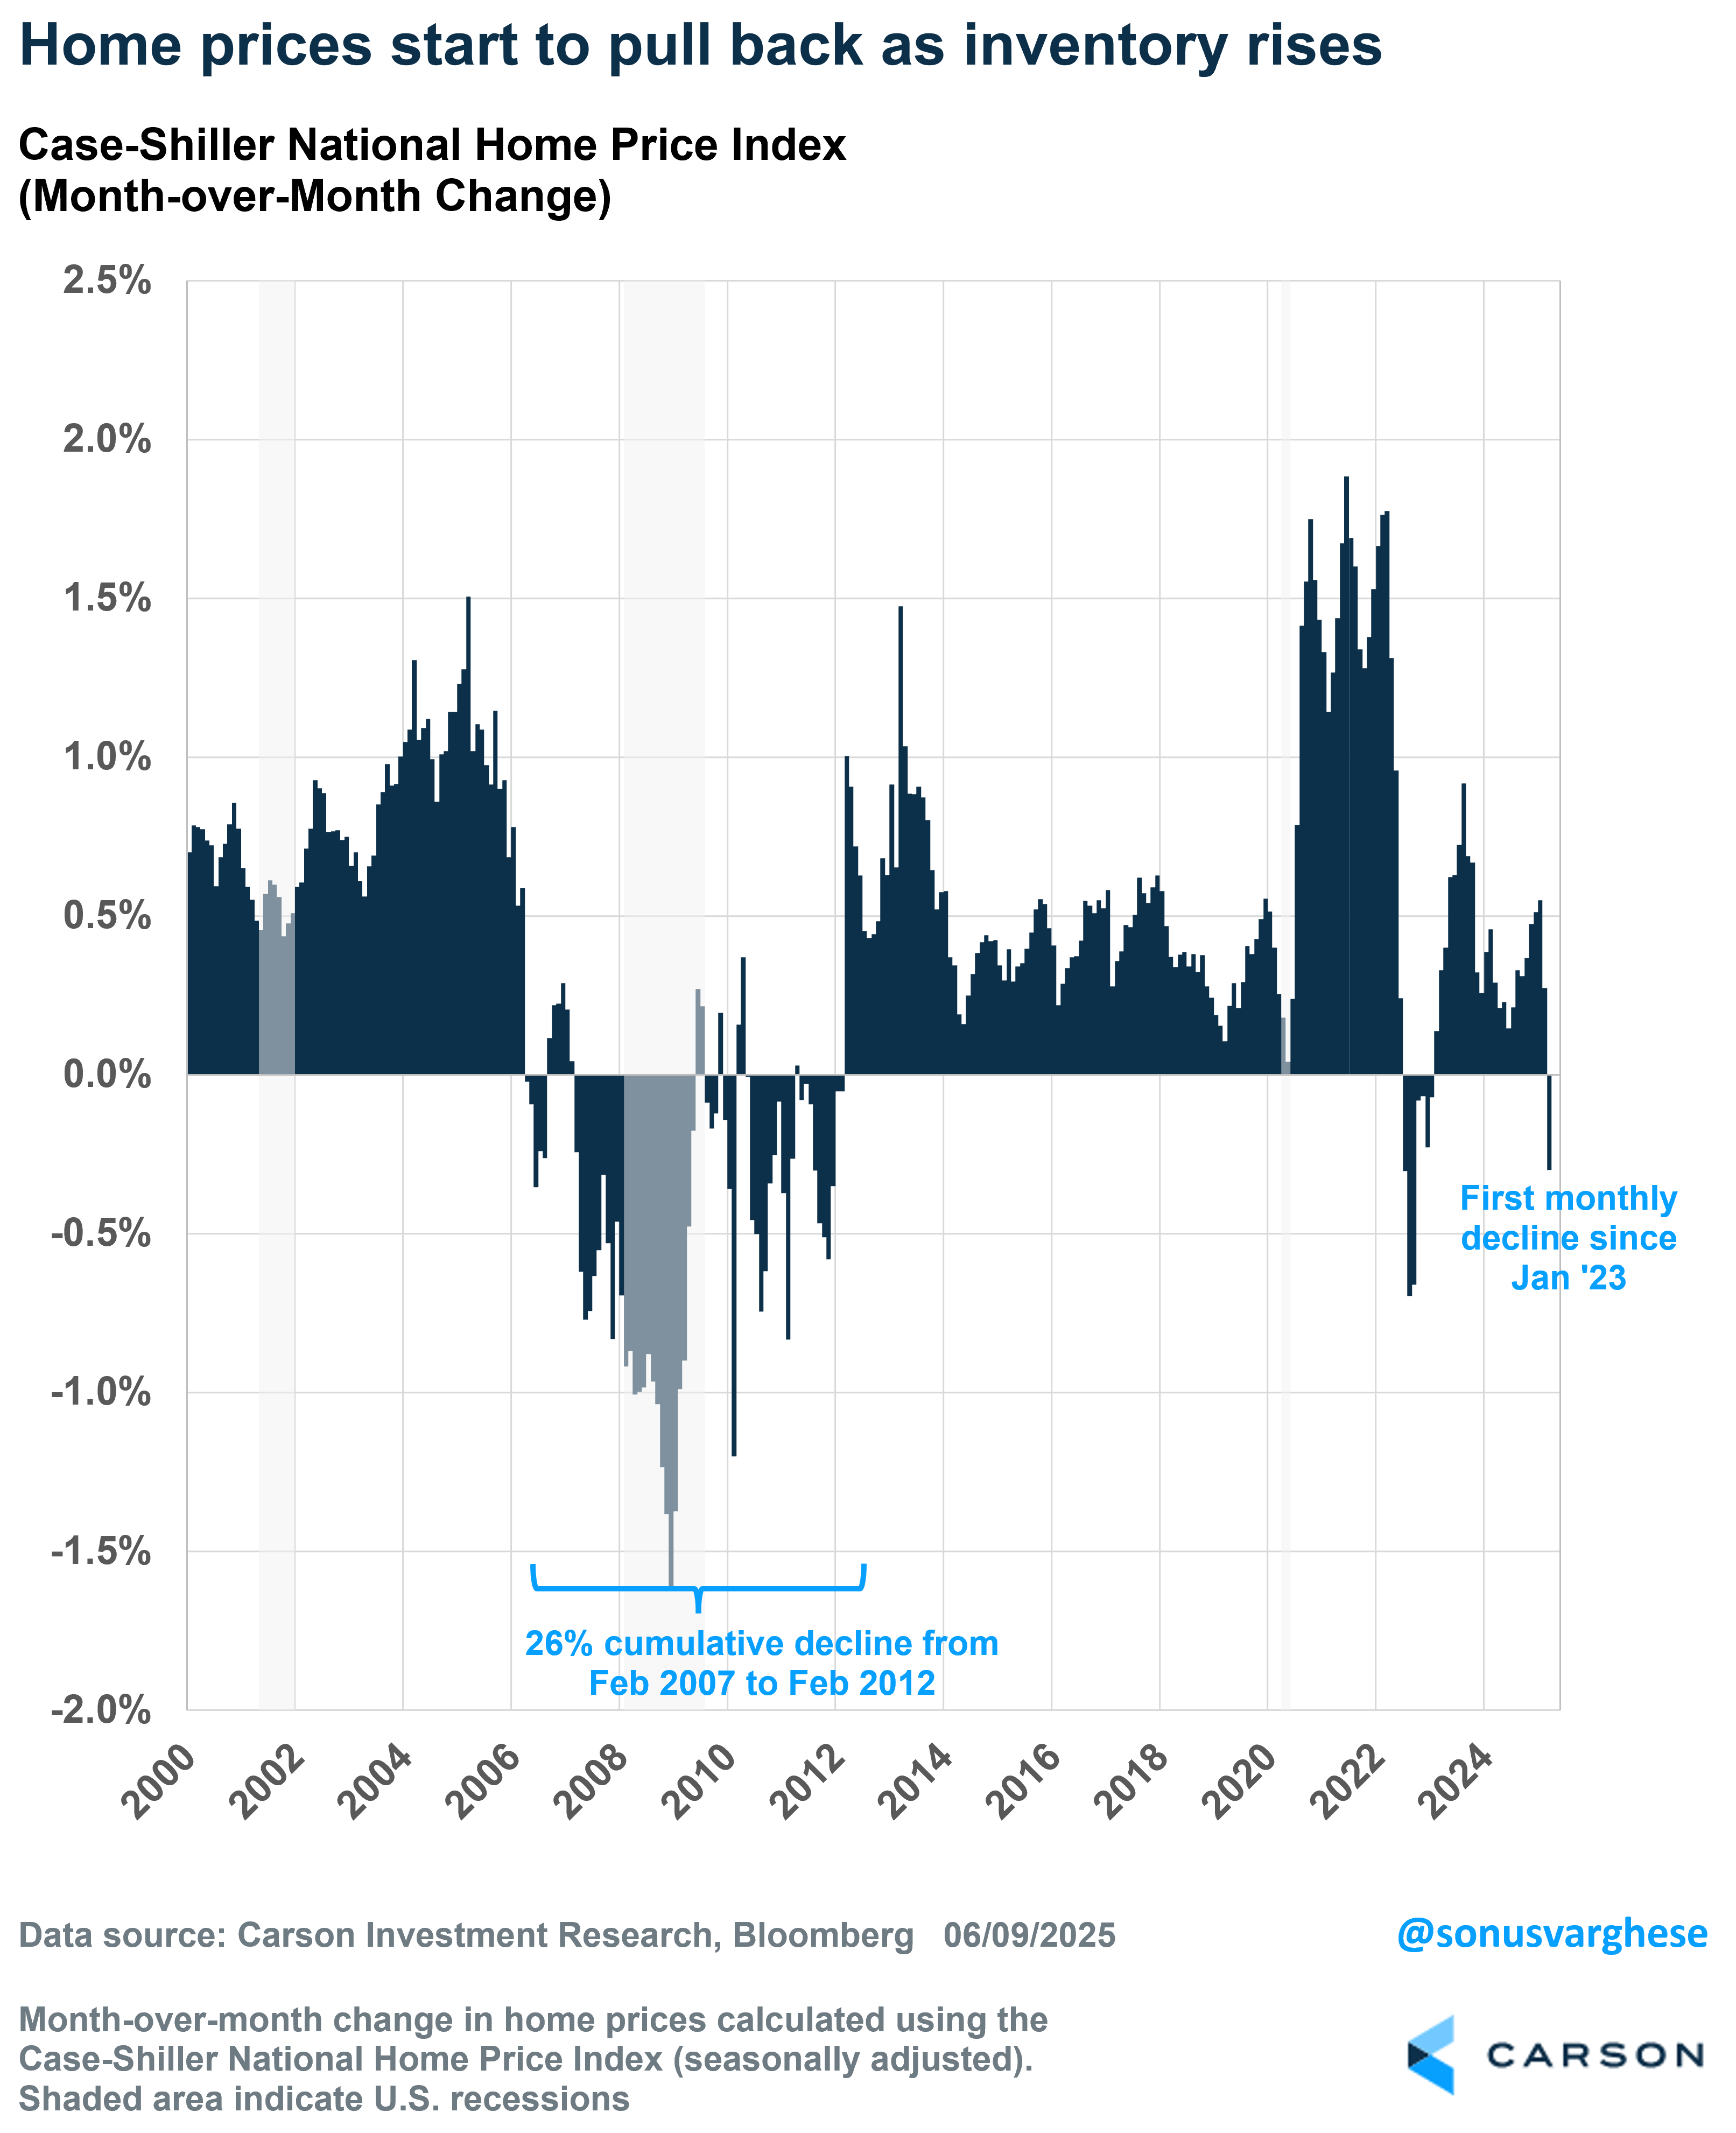
The Case-Shiller National Home Price Index fell 0.3% in March. (Note that the March index price is a 3-month average of January, February, and March closing prices.) The index is still up 3.4% year over year, but a year ago (March 2024), it was up 6.6%. so the pace of home price appreciation has decelerated sharply, and the latest monthly data suggests it’s gone into reverse.
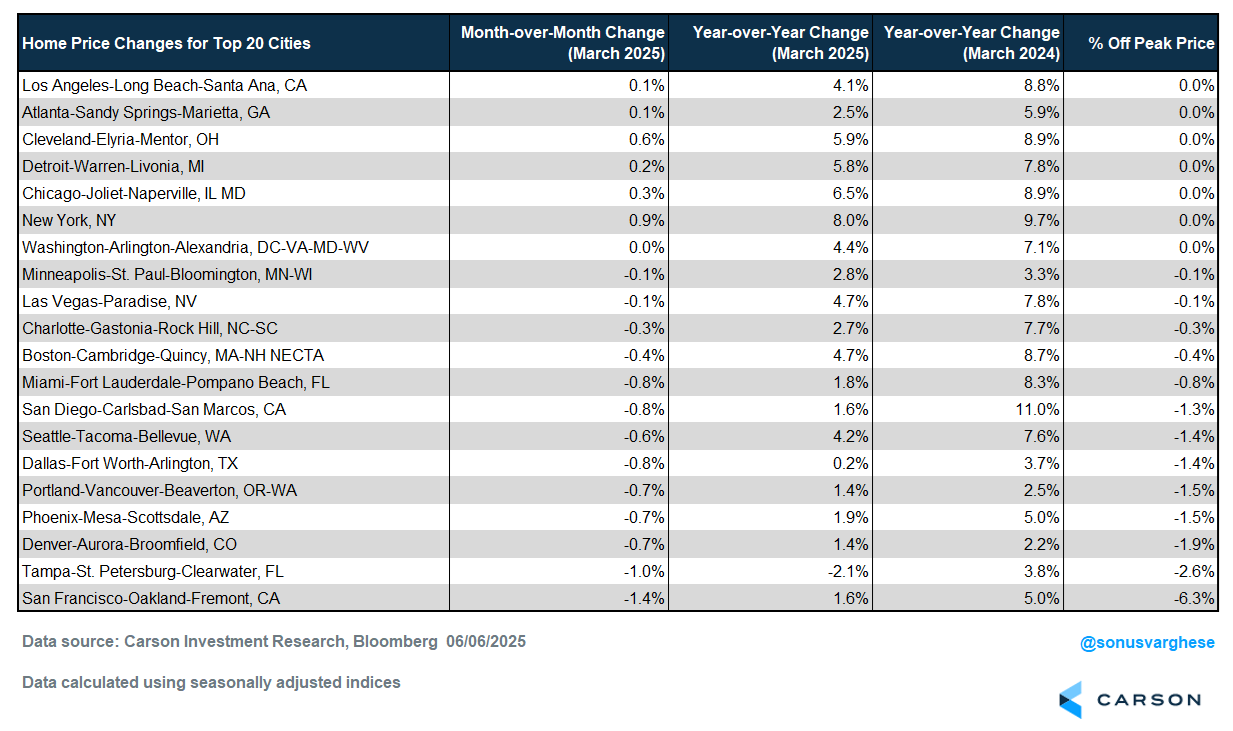
Looking at the top 20 cities, prices rose in just 6 of them. Only Tampa is seeing a negative year-over-year price drop (-2.1%), but you can see a sharp deceleration in year-over-year price appreciation across the board, with New York, Chicago, Cleveland, and Detroit notable exceptions. Prices are over 1% off their recent peak levels in 8 out of 20 cities, with the worst drop being Tampa (2.6% off peak) and San Francisco (6.3% off peak).
Of course, it’s early days yet so don’t be surprised to see this trend continue given inventory dynamics.
The drop in home prices is something we didn’t see in 2023 – 2024, but if the recent pullback continues, that’s going to start crimping consumer confidence even more.
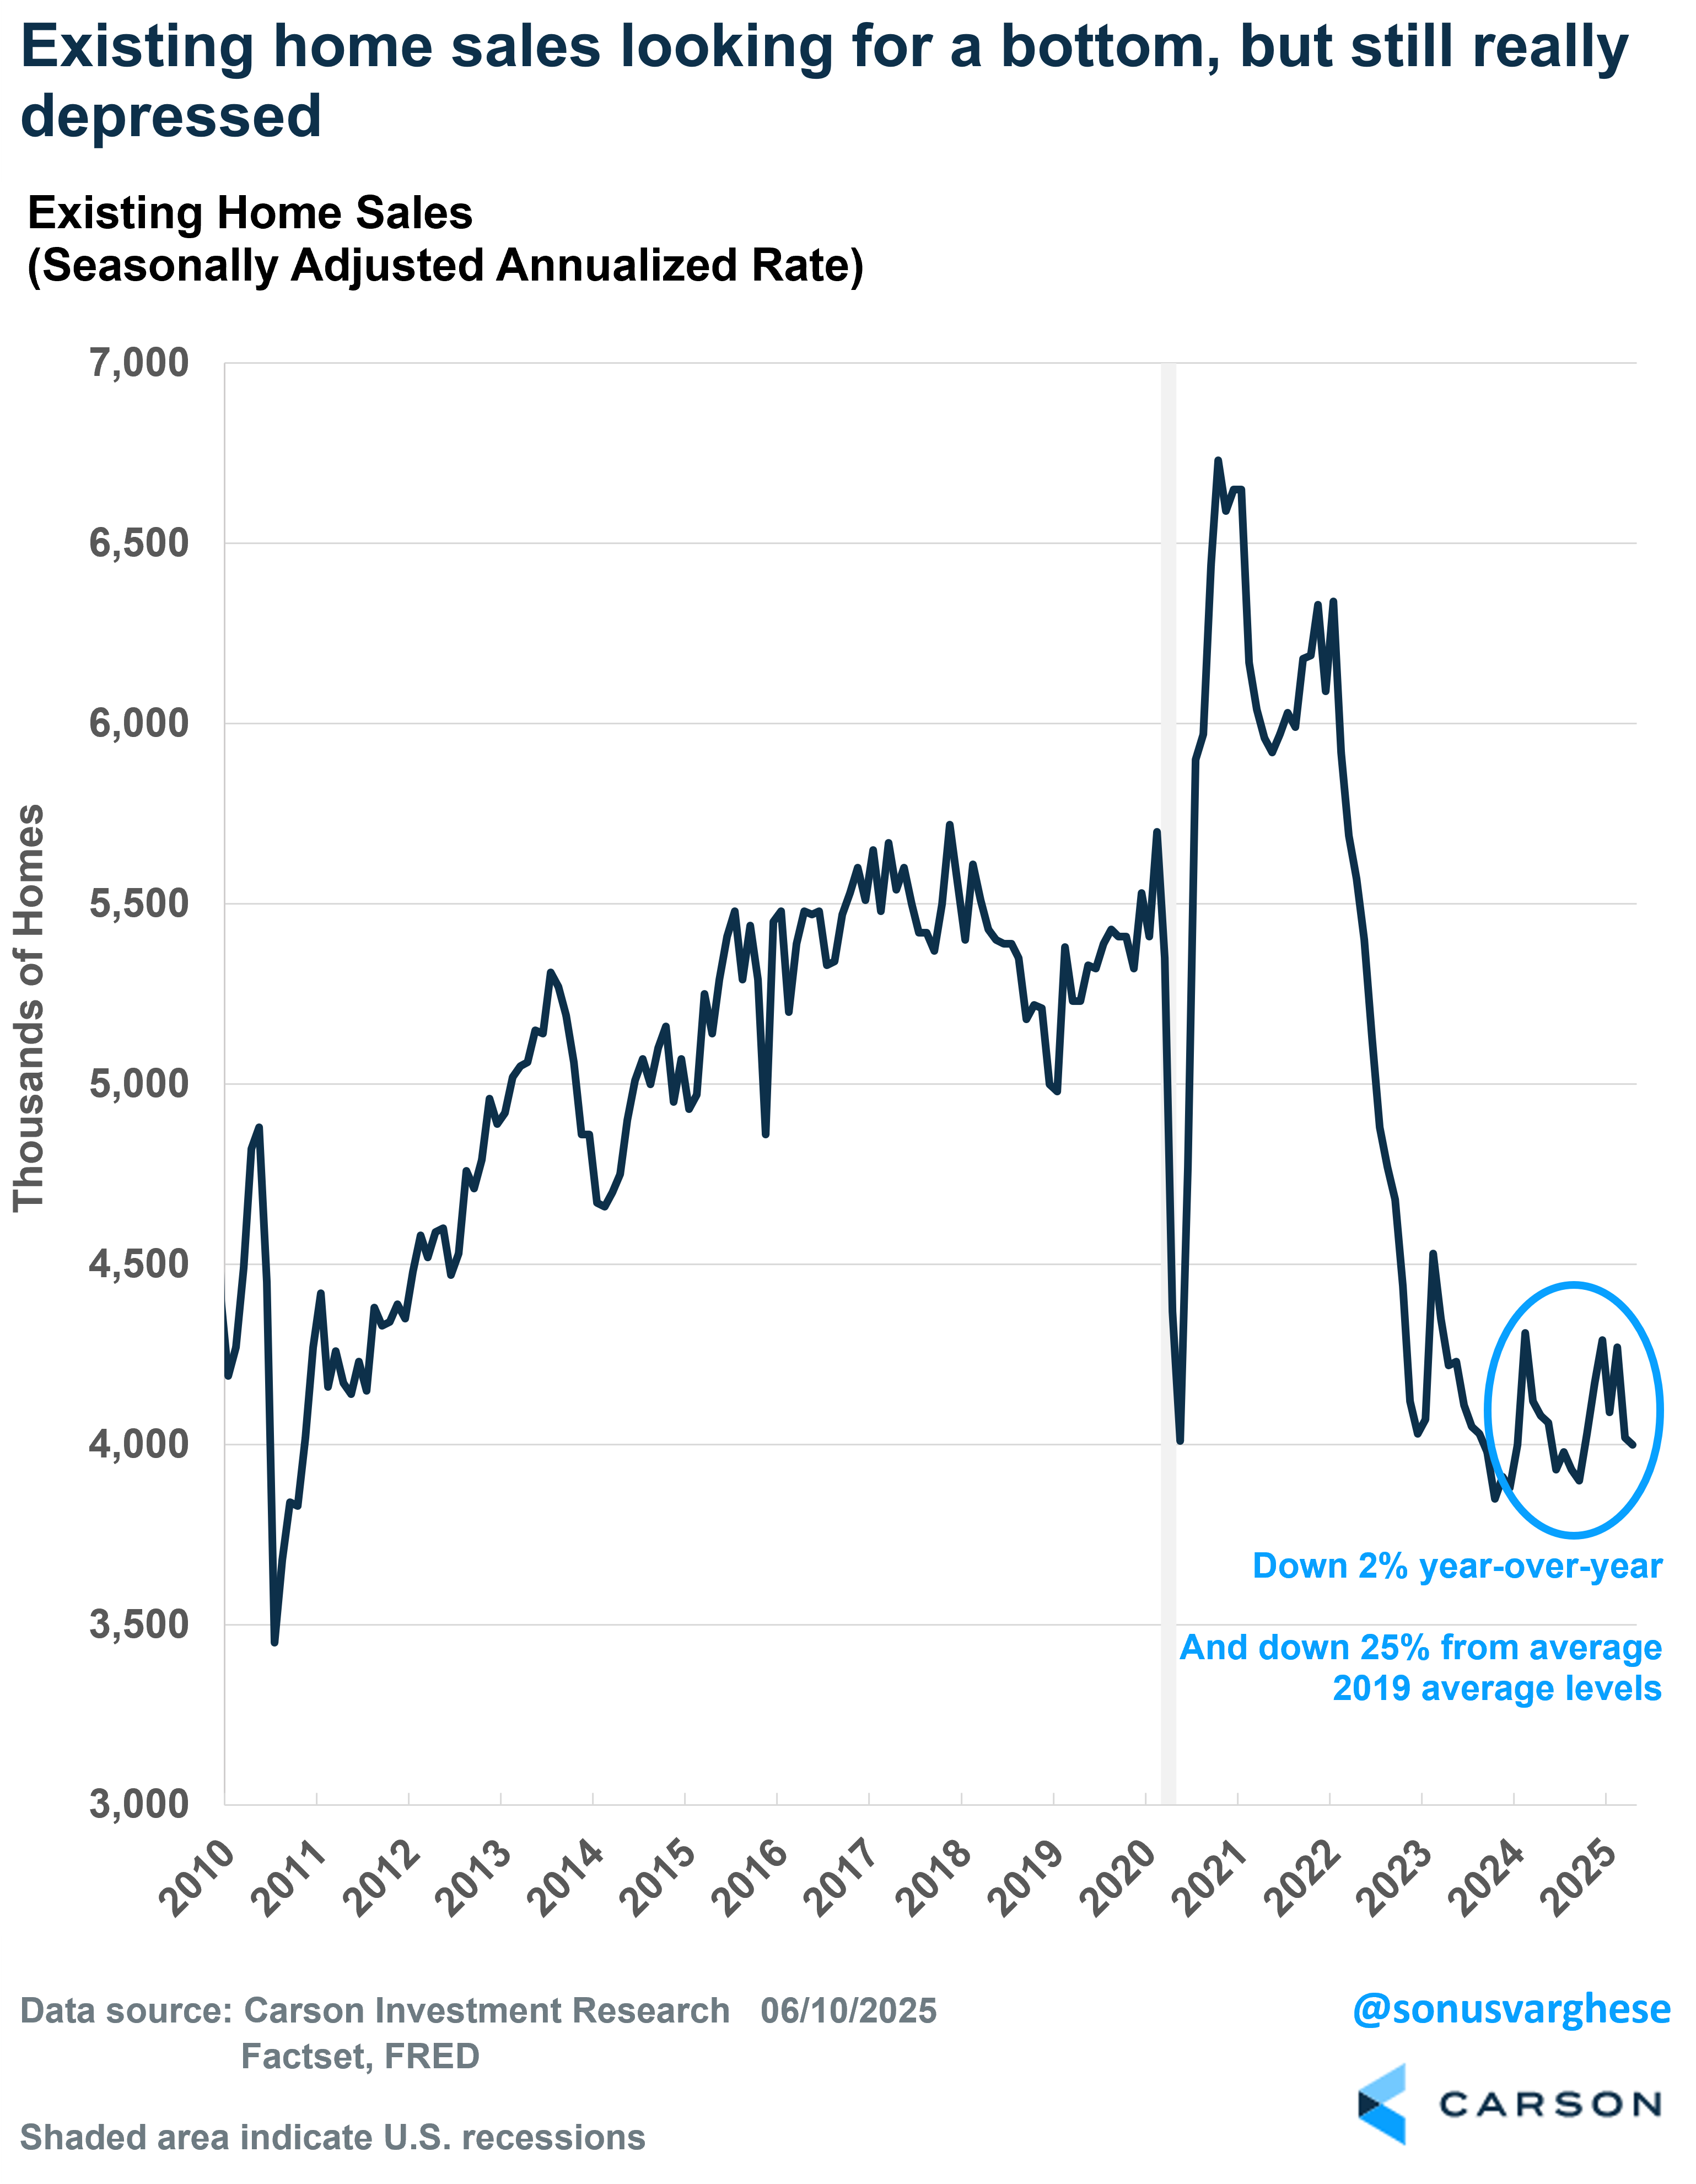
At the same time, even as supply is increasing, elevated mortgage rates near 7% are creating a demand problem. Existing home sales are down 2% year over year as of April, and 25% below average 2019 levels. As I mentioned above, the population is larger now, especially the cohort that is in their prime home-buying years (mostly millennials).
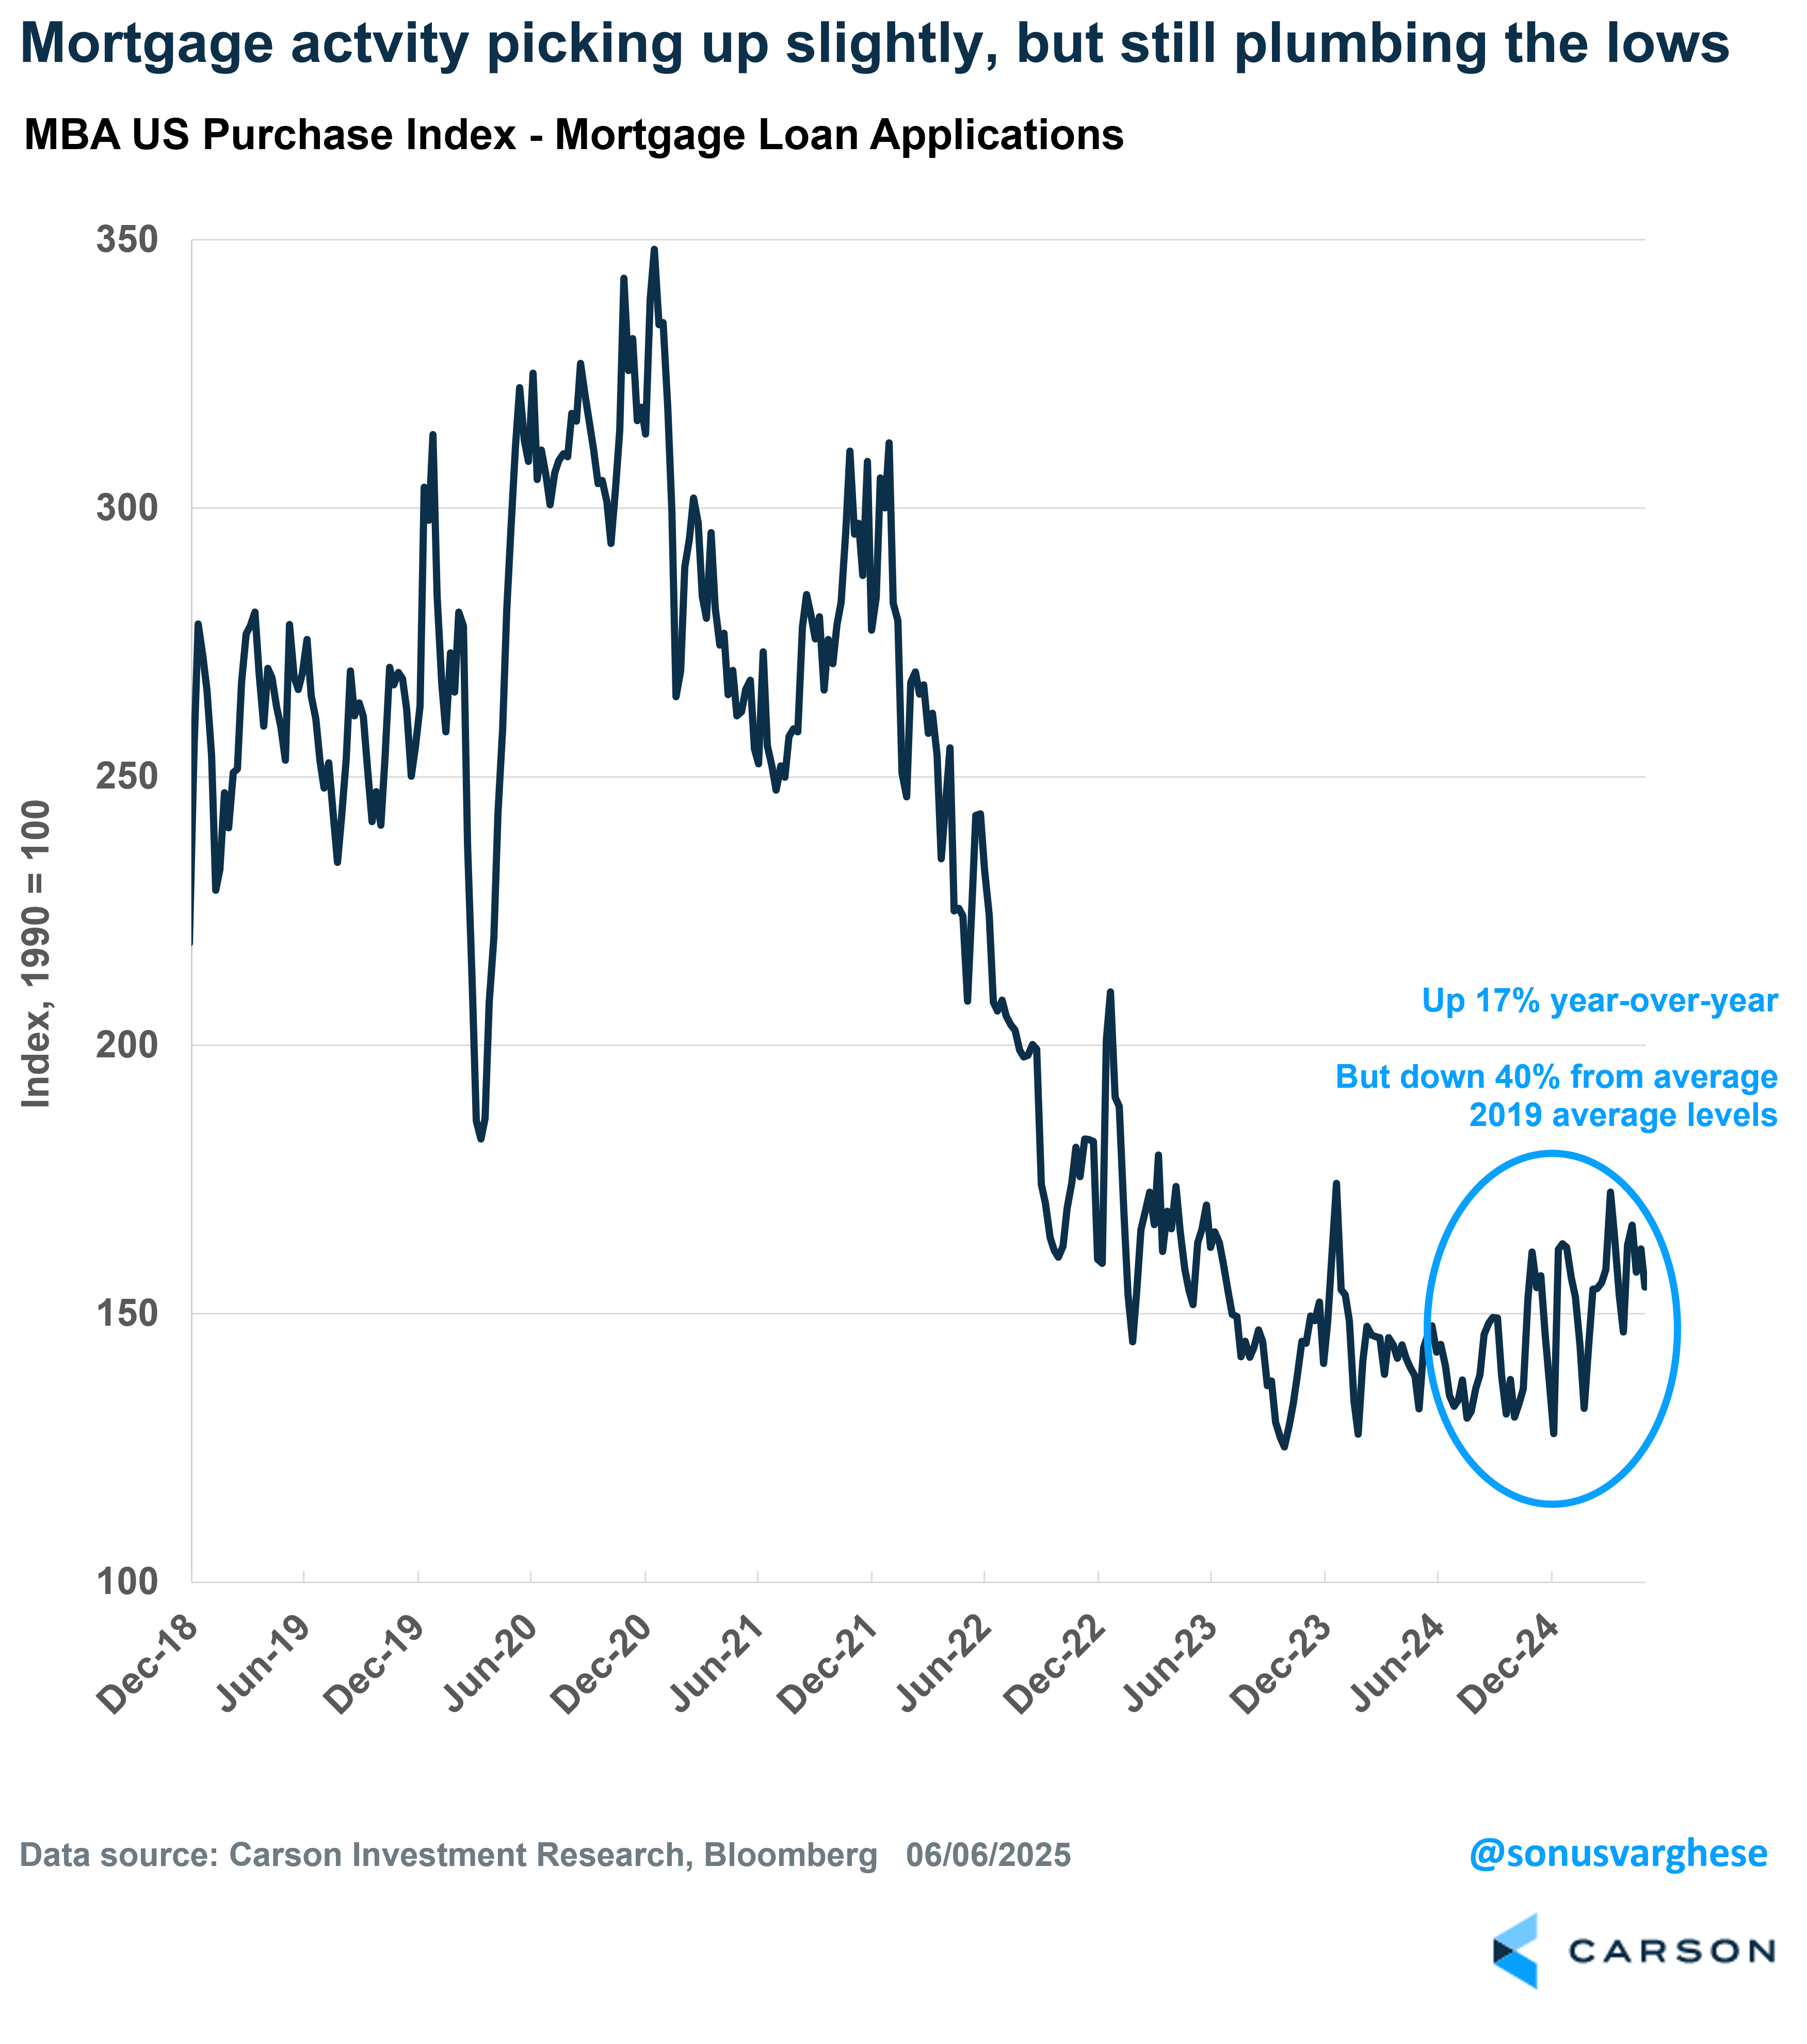
Mortgage application data are timelier, and as of last week, they are up 17% since last year. But that hides the fact that applications are still a whopping 40% below average 2019 levels.
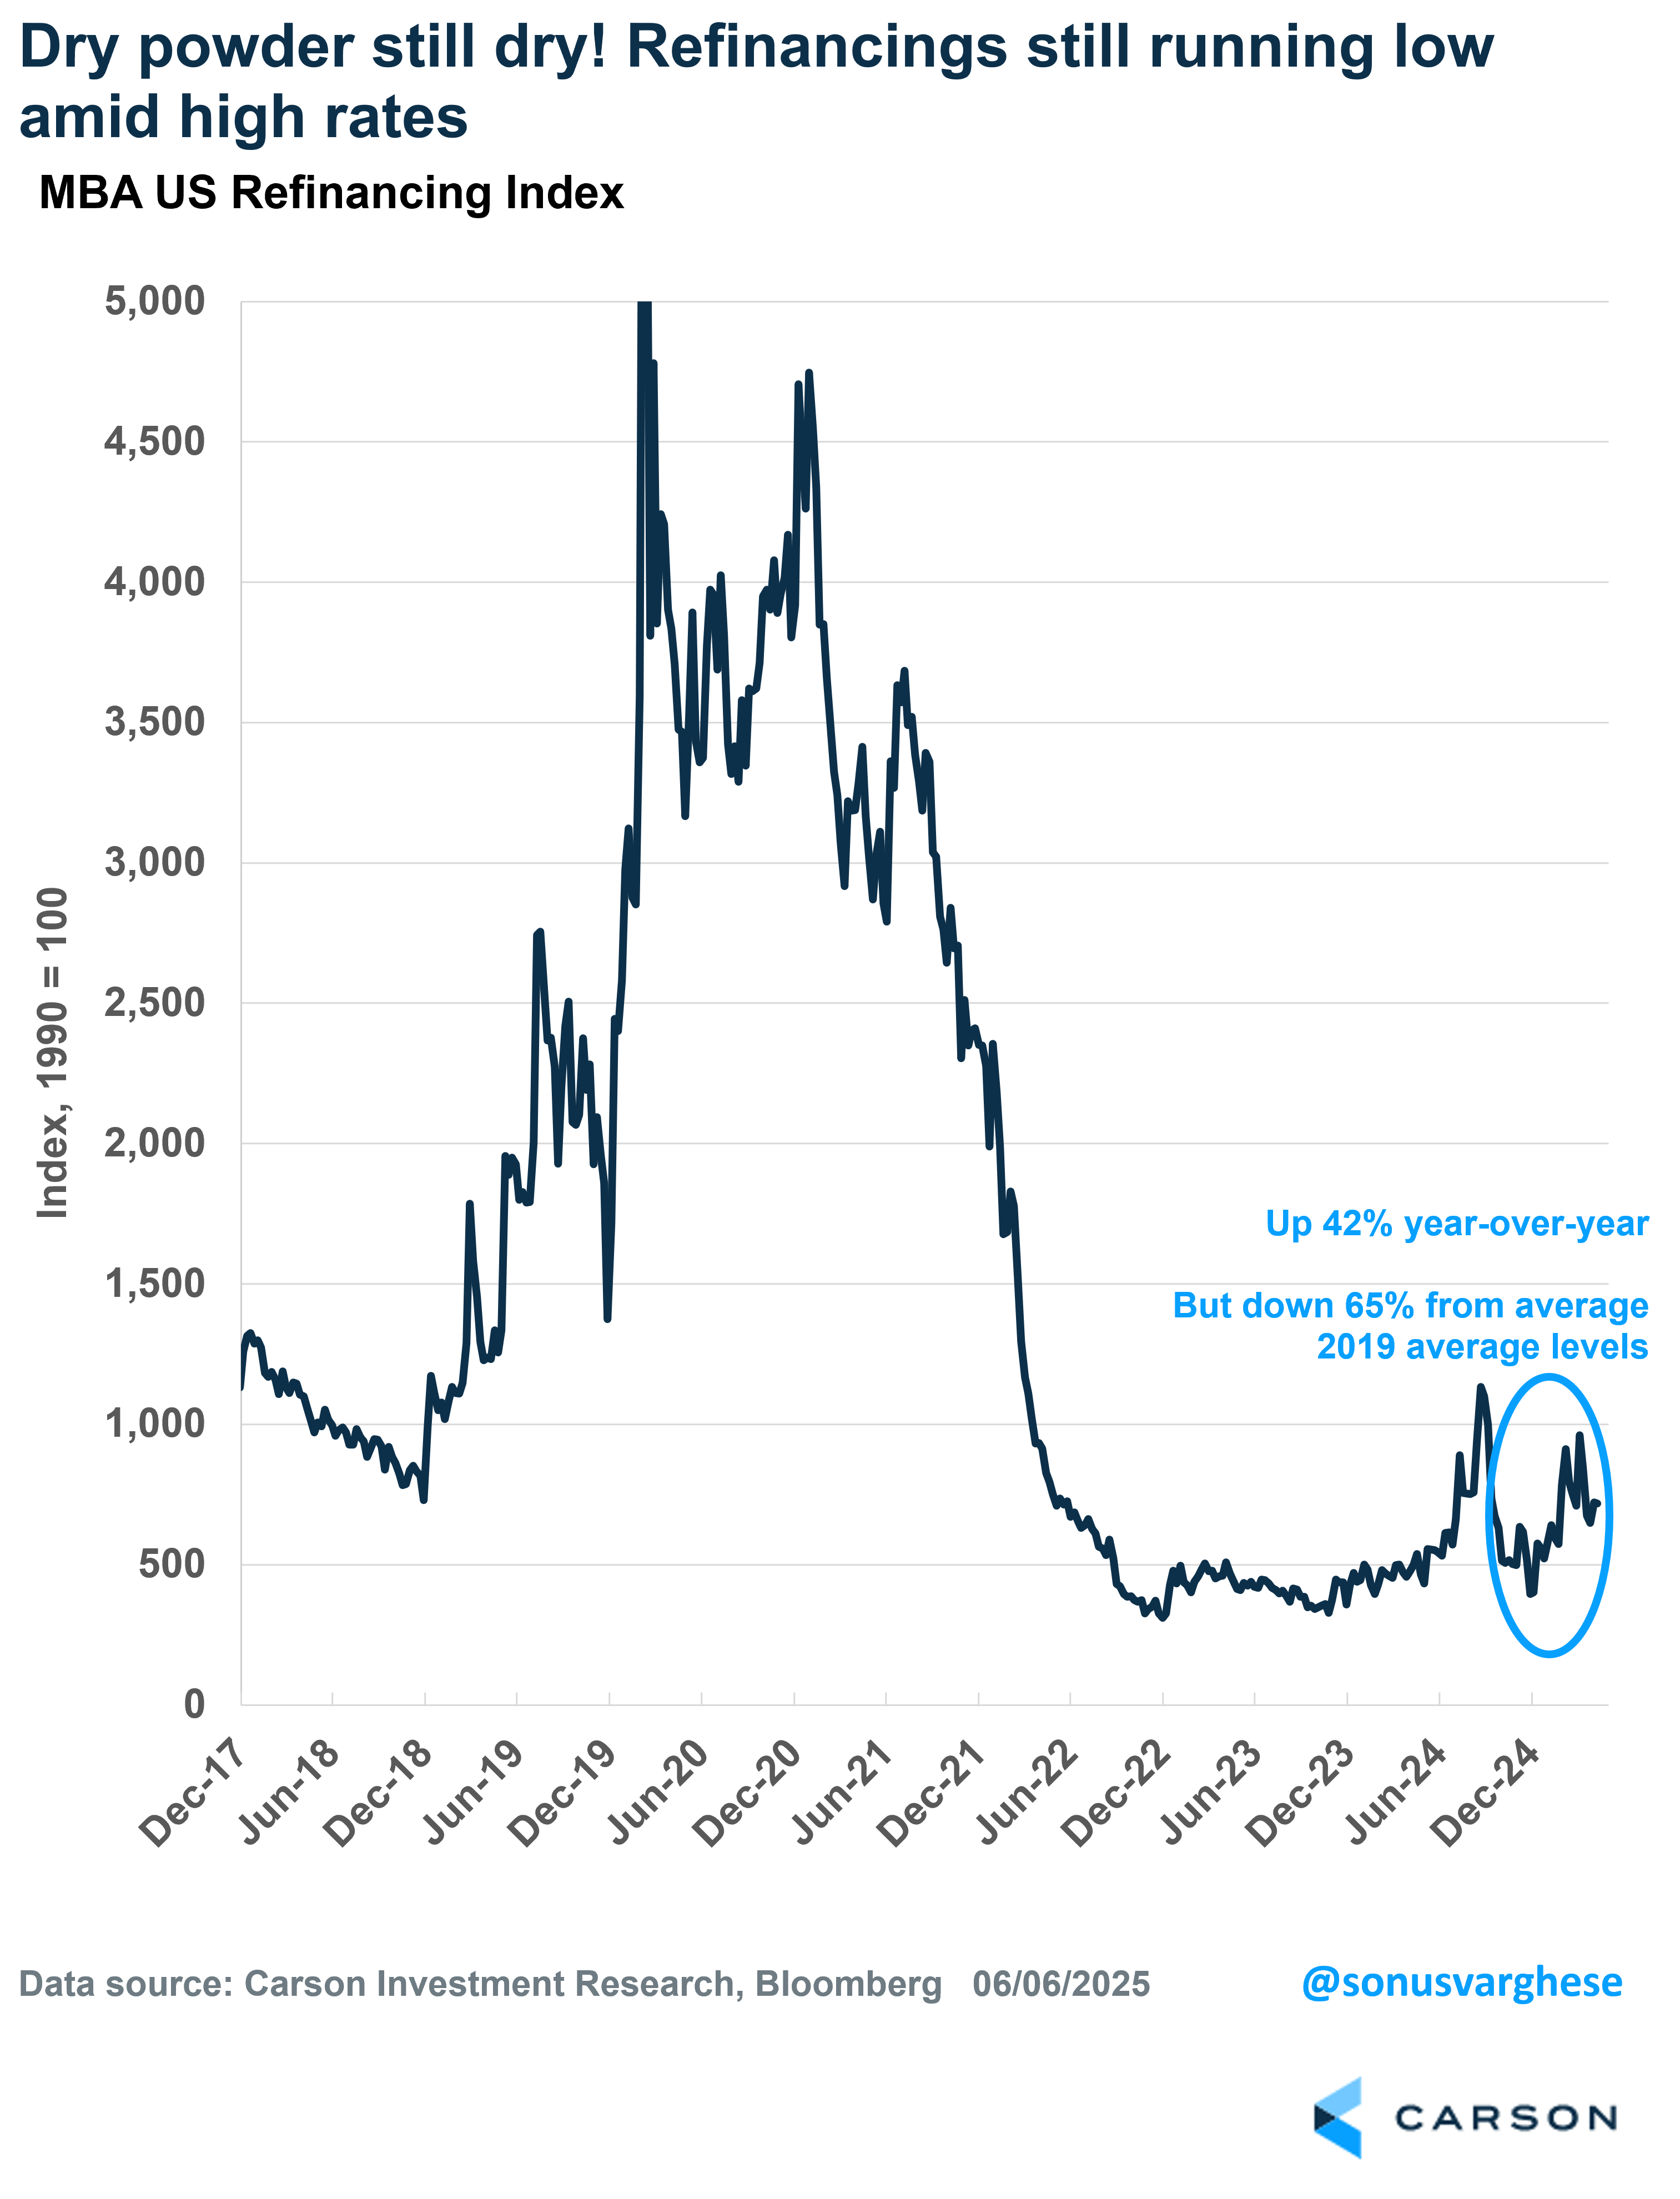
Meanwhile, refinancings are down 65% from average 2019 levels. Remember, this a key mechanism by which homeowners can access home equity (which they have more of), but the door is shut because of elevated rates. And if home prices start to pull back, there’s going to be less equity to tap into as well.
Housing, or residential investment, makes up just 4% of GDP, but it’s amongst the most cyclical parts of GDP and can drive changes in GDP growth (up or down). Also keep in mind that homes are important even beyond the direct impact on GDP growth via new buildings. It drives household formation and is an important source of wealth, especially for lower income groups.
Stay on Top of Market Trends
The Carson Investment Research newsletter offers up-to-date market news, analysis and insights. Subscribe today!
"*" indicates required fields
All in all, we now have a potentially toxic combination of:
- High interest rates, with mortgage rates running close to 7%
- Extremely poor home price affordability
- Rising home inventory and a pullback in home prices (which reduces home equity)
- Weakening labor market, with easing wage growth (running well below mortgage rates)
This is not to say we’ll get an immediate economic crash, but there’s a slow burn happening, with risks increasing.
Ryan and I discussed the payroll data and the implications for Fed policy in our latest Facts vs feelings episode. Take a listen below.
8062258.1.-06.11.25A
For more content by Sonu Varghese, VP, Global Macro Strategist click here
