Here we go again. The crash guy has been let out of his box. The Wall Street Journal had an article this week, where a fund manager says he sees conditions akin to 1929, when stocks crashed. The “silver lining” here is that he thinks this is like the early part of 1929, when stocks continued to boom. Keep in mind that this fund manager essentially keeps buying tail-risk insurance that pays off big time if stocks crash sharply. As the article notes, the same person warned of “something really, really bad” over a year ago in July 2024. The S&P 500 has gained 23% since then.
You just can’t win. You have one side stating that if the stocks are going up, it just can’t be true and surely things are in a bubble. Then, you have the other side that thinks when stocks are going down, things will only get worse.
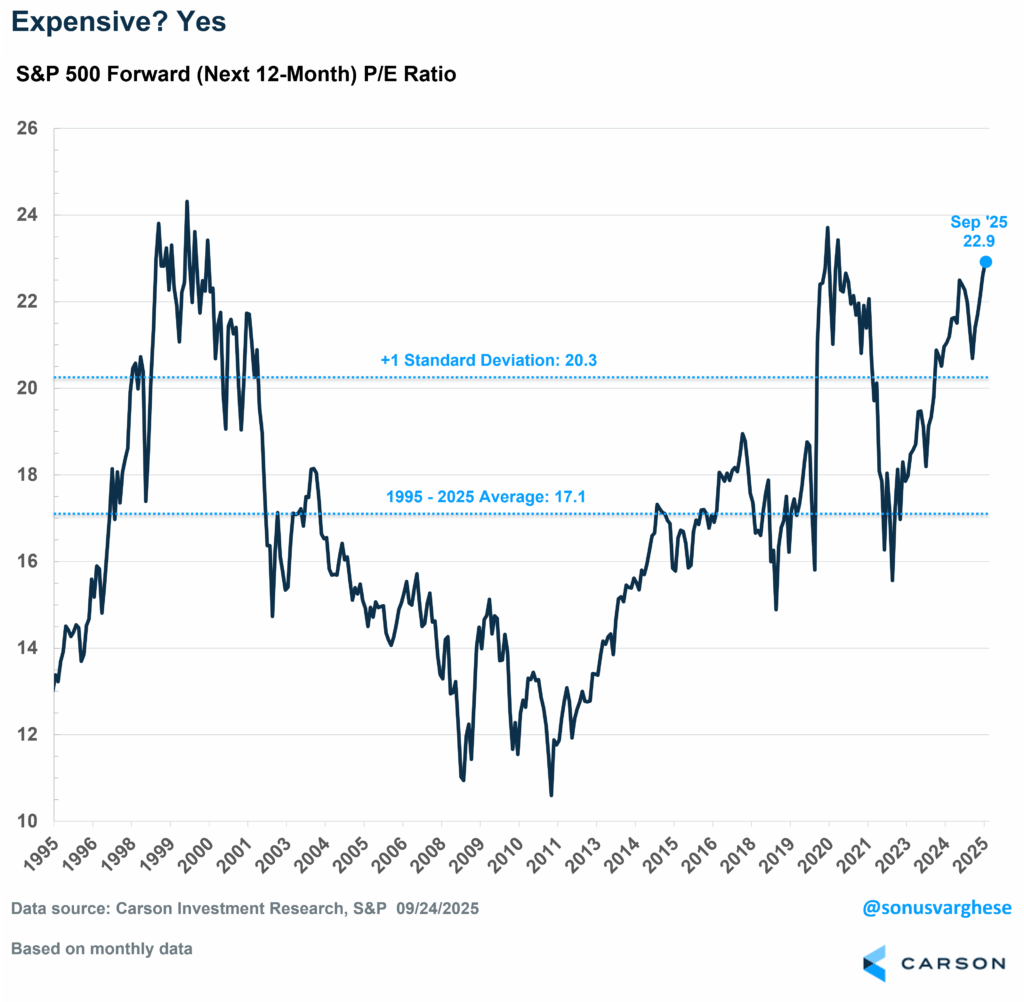
Still, there’s quite a bit of “bubble” talk recently, and whether the market is stretched too thin. The first place I tend to look when I hear this is valuations, as valuations would be really stretched if this were a bubble. The forward price-to-earnings ratio (“P/E”) of the S&P 500 is right now at 22.9x, which is certainly above even the first standard deviation when you look at the last 30 years of data. At the same time, pinpointing a bubble in real time is really hard—Cliff Asness, CIO and Founder of AQR Capital Management, talked about this with Ryan and I on a recent Facts vs Feelings episode. Right now, things do look expensive but it’s hard to say whether or not it’s a bubble, let alone when the bubble will collapse even if it were one. Maybe this is why Powell also said the market was overvalued – we’re all looking at the same data. But what matters is what you do with that information.
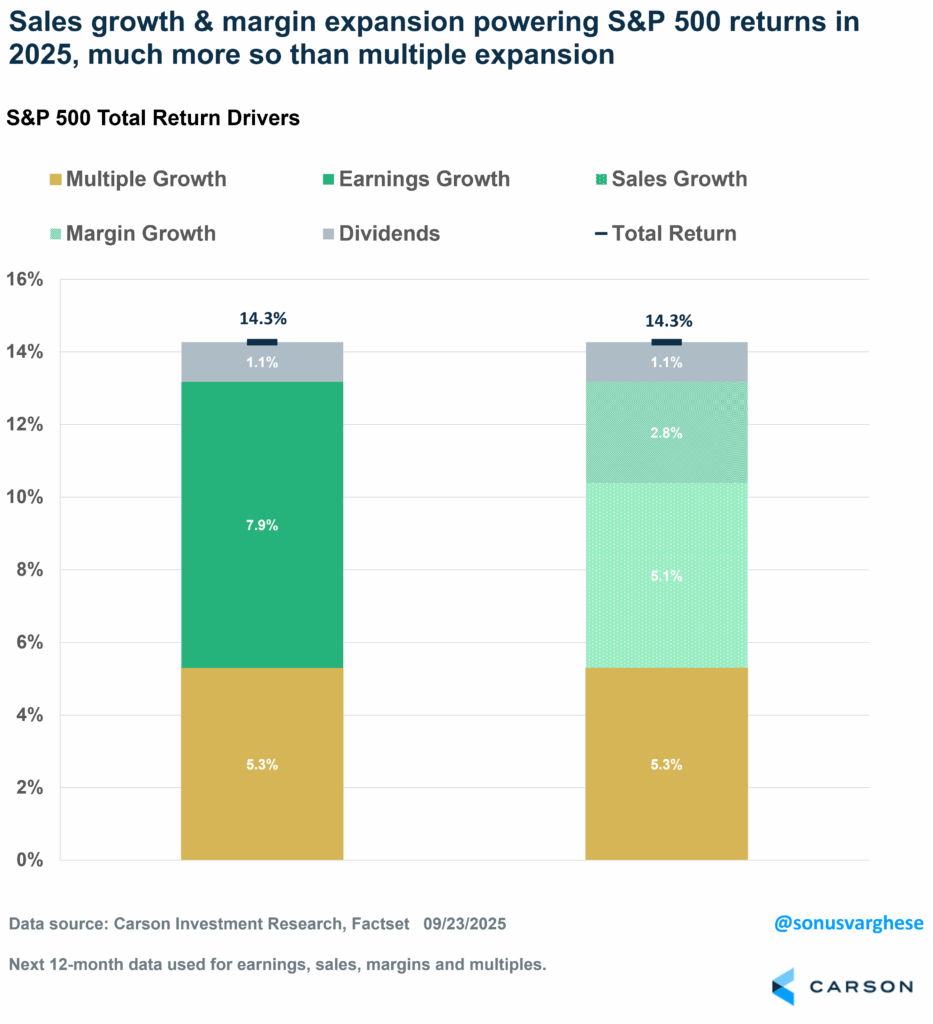
Another approach is to look at what’s driving markets returns. The S&P 500 has gained 14.3% year to date (through September 24), and we can break that down into gains from profit growth, multiple growth (change in valuation), and dividends:
- Earnings growth contribution: +7.9% points
- Multiple growth contribution: +5.3% points
- Dividends: +1.1% points
In short, 9% points of the index’s return has come from profits, both retained and distributed (dividends), or about 63% of the overall return. In fact, we can break the earnings growth contribution into the contribution from sales growth and margin expansion:
- Sales growth contribution: +5.1% points
- Margin expansion: +2.8% points
This tells you that 1) the economy continues to grow, which is why sales are growing; and 2) companies have the ability to expand margins as sales grow, or “operating leverage.” Keep in mind that all this is happening while there’s a lot of uncertainty about tariff policy and the interest rate outlook.
In fact, if you zoom out over the last 5.5+ years, (2020 – 2025 to date), the S&P 500 has gained 125%. That return can be broken down into returns from:
- Earnings growth: +76% points
- Multiple growth: +30% points
- Dividends: +19% points
![]()
But Is There a “Profit Bubble”?
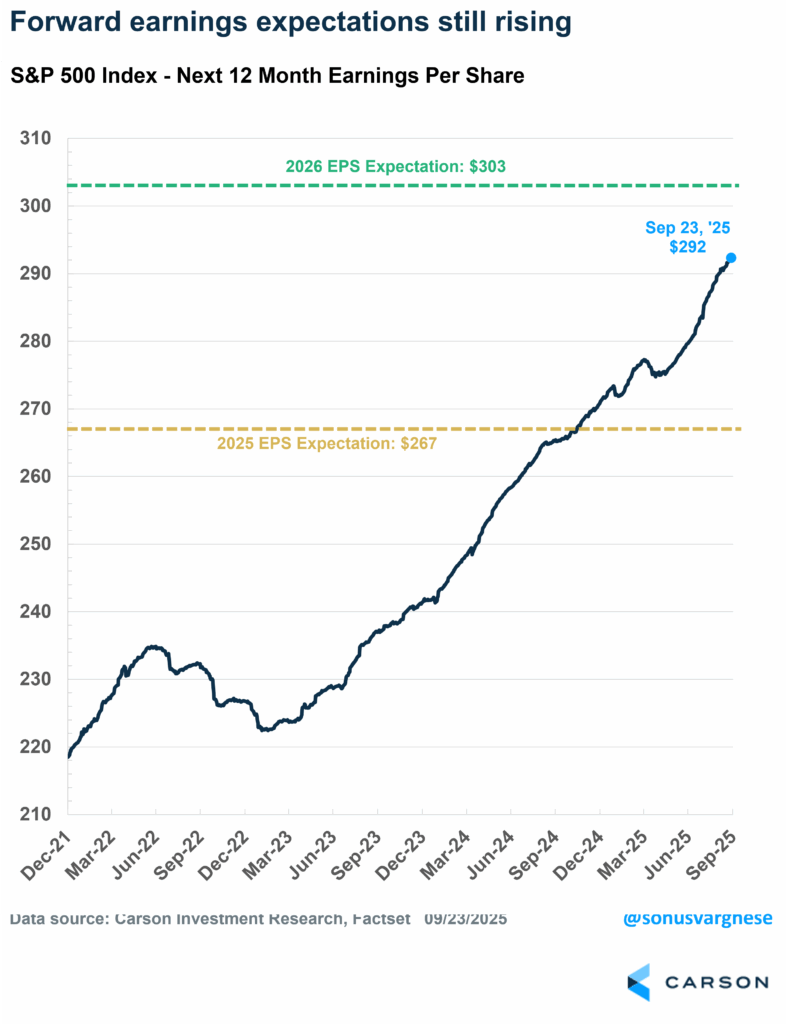
As I noted earlier, year-to-date returns for the S&P 500 have mostly been driven by profits. The S&P 500’s forward 12-month earnings per share (EPS) is currently at $292, up almost 8% from the start of the year. As you can see in the chart below, there’s been no let-up in market expectations of profit growth over the last few months. (There was brief hiccup in April amid the tariff chaos.) The line keeps going up and to the right, which is why stocks are going up and to the right.
This also raises the question as to whether there’s a “profit bubble.” The key question is really what’s driving profits, and from an aggregate macro perspective, a big driver is investment spending, assuming consumer savings and government deficits don’t change (though rising fiscal deficits have also boosted aggregate profits recently).
Stay on Top of Market Trends
The Carson Investment Research newsletter offers up-to-date market news, analysis and insights. Subscribe today!
"*" indicates required fields
The idea with investment driving profit growth is that one company’s spending (or investment) is another company’s income (and profit). And right now, there’s a lot of investment, albeit focused on a particular area: artificial intelligence (AI). The investment, or capital expenditures (capex), in this space is enormous, and is even having a big impact on GDP growth despite being a relatively small part of the overall economy. In fact, over the first half of 2025, AI-related spending (hardware and software) contributed an average of 1.0% point to GDP growth over the last two quarters. That’s more than the contribution of 0.6% points from consumer spending, which makes up close to 70% of the economy.
Cash-rich tech companies are going on a capex spending spree, providing a crucial boost to the economy, and that does not look like it’s ending soon. And it’s also providing a big boost to the profits of these large tech companies. Some examples:
- Nvidia just committed to spending $100 billion in OpenAI and supply it with data center chips, as well as $5 billion in Intel.
- OpenAI is also expected to buy $300 billion in computing power from Oracle over five years.
- CoreWeave signed a 5-year deal with OpenAI worth $11.9 billion.
- Google struck a 6-year cloud computing deal with Meta worth over $10 billion.
- Amazon made another $4 billion investment into OpenAI competitor Anthropic (which makes the AI tool “Claude”), doubling their investment.
- “Stargate”, a joint venture between OpenAI, Oracle, and SoftBank, is expected to invest $500 billion in data centers over the next several years (the debut site is up and running in Abilene, Texas).
This AI-related infrastructure boom is larger than what we saw during the telecom and broadband buildout in the late 1990s, and about as large as the railroad boom back in late 1800s. With the railroad boom, the companies built too many lines too fast, creating duplicate capacity. These sat idle for a while (hence the crash after the boom), but eventually became useful once again as the economy expanded. With the telecom boom, companies laid a lot more fiber optic cables than was needed back then (and so these companies lost money), but this “dark fiber” became useful in later years, especially after all of us started streaming cat videos on Youtube and later spent evenings at home with Netflix. The pattern we’ve seen has been:
- A massive capex boom
- Overbuilding
- A shake-out, leading to a crash
- Long-term benefit
The question right now is whether the current generation of data centers will actually lead to a long-term benefit. One big difference is that the lifespan of this AI infrastructure is much shorter than say railroads and broadband fiber optic cables—datacenters that are deployed with the latest, most sophisticated chips (which are used to train AI models and provide responses to our AI prompts) are likely going to be near obsolete in 3-4 years as chip technology advances. The depreciation of these assets happens much faster, in contrast to what we saw with railroads or telecom. (“Moore’s Law,” first stated in 1965, noted that the number of transistors in an integrated circuit had been doubling about every two years. That observation has continued to hold roughly true the last 60 years.)
Another difference is that there are only a handful of players are involved in the current AI boom, since only these large companies have the funds and scale to operate at these levels. In fact, that also gets to the fact these companies are enormously profitable and have cashflows from other business lines (ads for Google and Meta, and cloud storage for Microsoft and Amazon). So, this is not being driven by debt and levered balance sheets, at least not yet. With the railroads and telecom there were a lot more players, and more widespread vulnerability—land grants and government subsidies boosted the railroad boom while deregulation (including the 1996 Telecom Act) spurred competition and capital spending in telecom in the late 1990s.
Of course, it’s one thing to recognize that there’s a lot of capex spending on AI right now, and a whole other thing to figure out the timing of when it may end, let alone the investment impact. Keep in mind that the big companies don’t have any intention to pull back right now. Here’s Mark Zuckerburg, founder of Meta:
If we end up misspending a couple of hundred billion dollars, I think that that is going to be very unfortunate obviously. But what I’d say is I actually think the risk is higher on the other side. If you if you um build too slowly and then super intelligence is possible in 3 years, but you built it out assuming it would be there in 5 years, then you’re just out of position on what I think is going to be the most important technology that enables the most new products and innovation and value creation and history.
And Larry Page over at Google:
I’m willing to go bankrupt rather than lose this race. Everybody is focused on ROl, but the people making the decisions are not.
There’s a reason why we emphasized diversification in our 2025 Midyear Outlook: Uncharted Waters. In some ways, even the current AI spending/investment boom is “uncharted waters” and now may be the time to pay attention to principles of good portfolio construction, especially diversification, rather than being concentrated in any particular area of the market.
Ryan and I talked about a lot of this stuff on our latest Facts vs Feelings episode. Take a listen below
8427563.1.-24SEPT25A
For more content by Sonu Varghese, VP, Global Macro Strategist click here
