
In our writings and conversations about the markets or portfolios, it would be rare for a mention of momentum not to come up (see a couple of recent writings here and here). Either via the market’s continued strong momentum off of the April lows, or the factor itself — which we utilize in portfolios as a way to add alpha without unnecessary turnover. Allocating to the best performing stocks in a systematic and measured way is much more difficult than it may seem. Weighting schemes, rebalancing frequency, risk management, measurement period, and measurement metrics are all crucial elements of these strategies, even if they are mostly index-based ETFs. This need for extra due diligence is clearly illustrated in the chart below. Shown are all the U.S. large cap momentum ETFs and their year-to-date returns. Despite using the same universe as a starting point, returns from best to worst performing vary by 20%! Roughly half of the products outperformed the S&P 500 YTD, a number that consistently declines as the time periods lengthen.
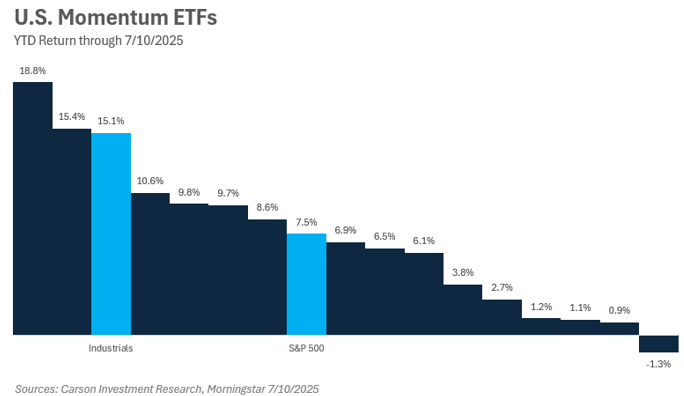
Another observation worth noting is that not only have two of the ETFs doubled the performance of the index so far, but they have also outperformed the best performing sector, Industrials. This is one of the main reasons that in our tactical portfolios we have shifted away from a sector rotation strategy in favor of momentum (we also own momentum in our strategic portfolios and other strategies as well), as the stock selection benefits of not only being in the right sector but owning the right stocks in that sector can be very powerful. Readers can probably guess that we wouldn’t be writing this piece if we were not allocated to the ETF on the far left-hand side of this chart!
Stay on Top of Market Trends
The Carson Investment Research newsletter offers up-to-date market news, analysis and insights. Subscribe today!
"*" indicates required fields
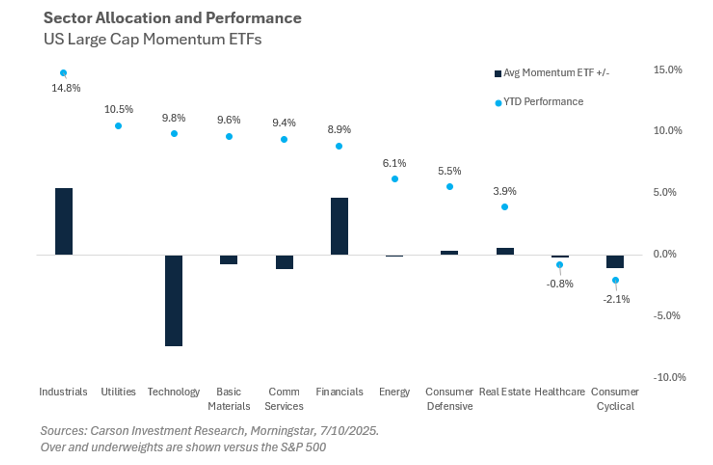
With industrials being the top performing sector this year, it is no surprise that the majority of momentum ETFs have an overweight to the sector. The chart below shows the year-to-date performance (dots), and average industrials over/underweight versus the S&P 500 (bars). However, not all momentum ETFs are created equal, and the tech sector is a large example of this. Allocations to technology vary widely, ranging from 11% to more than 50%. While the allocation to technology — the largest sector weight in the S&P 500 — is very important, the holdings selected within technology are equally as important. In the top two performing momentum ETFs, the tech sector specific holdings have returned 30% year to date, nearly three times that of the broad sector return and twice that of other momentum ETF competitors.
We keep a close eye on how the products we use across portfolios are allocated, and when they update their holdings. It is not uncommon to see us increase or decrease the weight in a momentum ETF based on an underlying rebalance to get the ‘freshest’ (technical term) momentum in portfolios that we can. Systematic strategies, such as momentum and low volatility ETFs and SMAs, can provide great tools in portfolios and work alongside both indices and active managers. Momentum has been the best performing factor for not just decades — but centuries, and pairing momentum with low volatility helps to smooth out the cyclical periods of underperformance that can come with the factor.
8168554.1.-07.14.25A
For more content by Grant Engelbart, VP, Investment Strategist click here
