
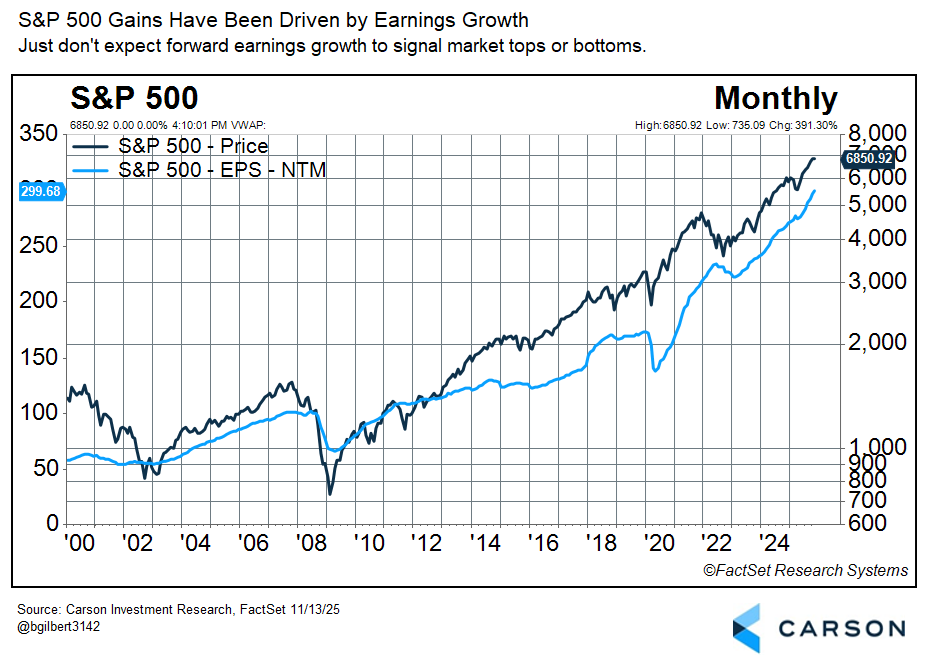
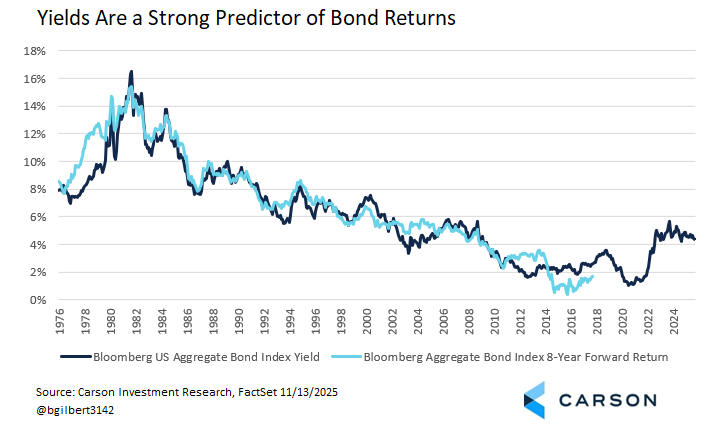
I sometimes get asked about the most important things I consider when thinking about the longer-run outlook for markets. For me, the answer is easy. 1) In the long run, stocks track earnings because earnings drive returns. 2) In the long run, yields drive bond returns. That’s just two short sentences, but it’s the starting point and both are often forgotten in the emotional day-to-day or even year-to-year ups and downs of markets.
There’s an economic reason for both of these, and they’re related. At the simplest level, earnings and yields capture some aspect of the cash flows you get from stocks and bonds, and that ultimately where they get their intrinsic value. Here’s some visual evidence of how that works. For a long-term investor, if you’re only going to look at two charts on fundamentals, look at these.
I could stop here, but I think there’s some added value in thinking about what these tell us about the potential return of stocks and bonds over the next 10 years. These are just rough estimates, can be well off over a given 10-year period (for stocks in particular), and don’t include all the other factors that matter. Still, it’s a good starting point.
Stay on Top of Market Trends
The Carson Investment Research newsletter offers up-to-date market news, analysis and insights. Subscribe today!
"*" indicates required fields
Stock Expectations
What’s the prospective S&P 500 returns over the next 10 years all else equal if we assume earnings growth stays consistent with history? Over the last 20 years, the annualized change in forward earnings has been 6.9%. (10 year rolling periods vary from about 4% to about 10%.) If that stayed the same, it would be a reasonable first estimate of index price gains. Add in the current dividend yield (1.2%) and you get an 8.1% return, a somewhat conservative estimate versus history for the same 20-year period (10.3%) but still reasonable. Keep in mind that’s a simple estimate if everything stayed the same and we only used that one driver (albeit the most important one). The truth is that even over 10-year periods stock returns can vary quite a lot. (Historical 10-year periods for the S&P 500 have ranged from -1% to 20% annualized.)
Bond Expectations
The bond side is easier—take your bearings from yields. That’s partially supported by knowing the exact value of a bond at maturity (assuming it doesn’t default). Right now, the yield on the Bloomberg Aggregate (“Agg”) is 4.3% so a good first estimate of the Agg’s return over the next 10 years is about 4.3%. (That also tells you something about why “momentum chasing” rising bond prices in 2020/2021 didn’t make sense—yields were very low and while we didn’t know the path, we knew return prospects were dim.) Again, this is just an estimate but it’s not as likely to drift as far as you get with stocks. Historically, the annualized return on the Agg eight years forward has been within 1% of the starting yield about 73% of the time. There will be more uncertainty over 10 years but it should still be effective.
Stay Patient—There’s a Reason It’s Called Investing
This brief look at fundamentals still has some important takeaways:
- Stock and bond returns aren’t arbitrary or simply speculative. The have fundamental drivers and in the long run, this is what supports the return outlook.
- Stocks have an expected premium to bonds.
- If you are a patient investor, you can take your bearings from these fundamentals. They’re not the end point but they’re a good way to orient yourself.
For more content by Barry Gilbert, VP, Asset Allocation Strategist click here.
8605668.1.-14NOV25A
