
We discussed the artificial intelligence (AI) wave in our 2026 Outlook and said we believed the best approach for investors was to ride it, using an equity overweight and broad diversified exposure. Five months later, that picture hasn’t changed—if anything, it’s only strengthened. AI continues to have a big impact on the economy. When I say “impact,” I’m referring to investment spending related to AI, rather than the diffusion of AI through the economy, becoming a big boost to productivity (we’re yet to see that and probably won’t get details on that until several years from now).
AI-related investment is surging on the hardware and software side.
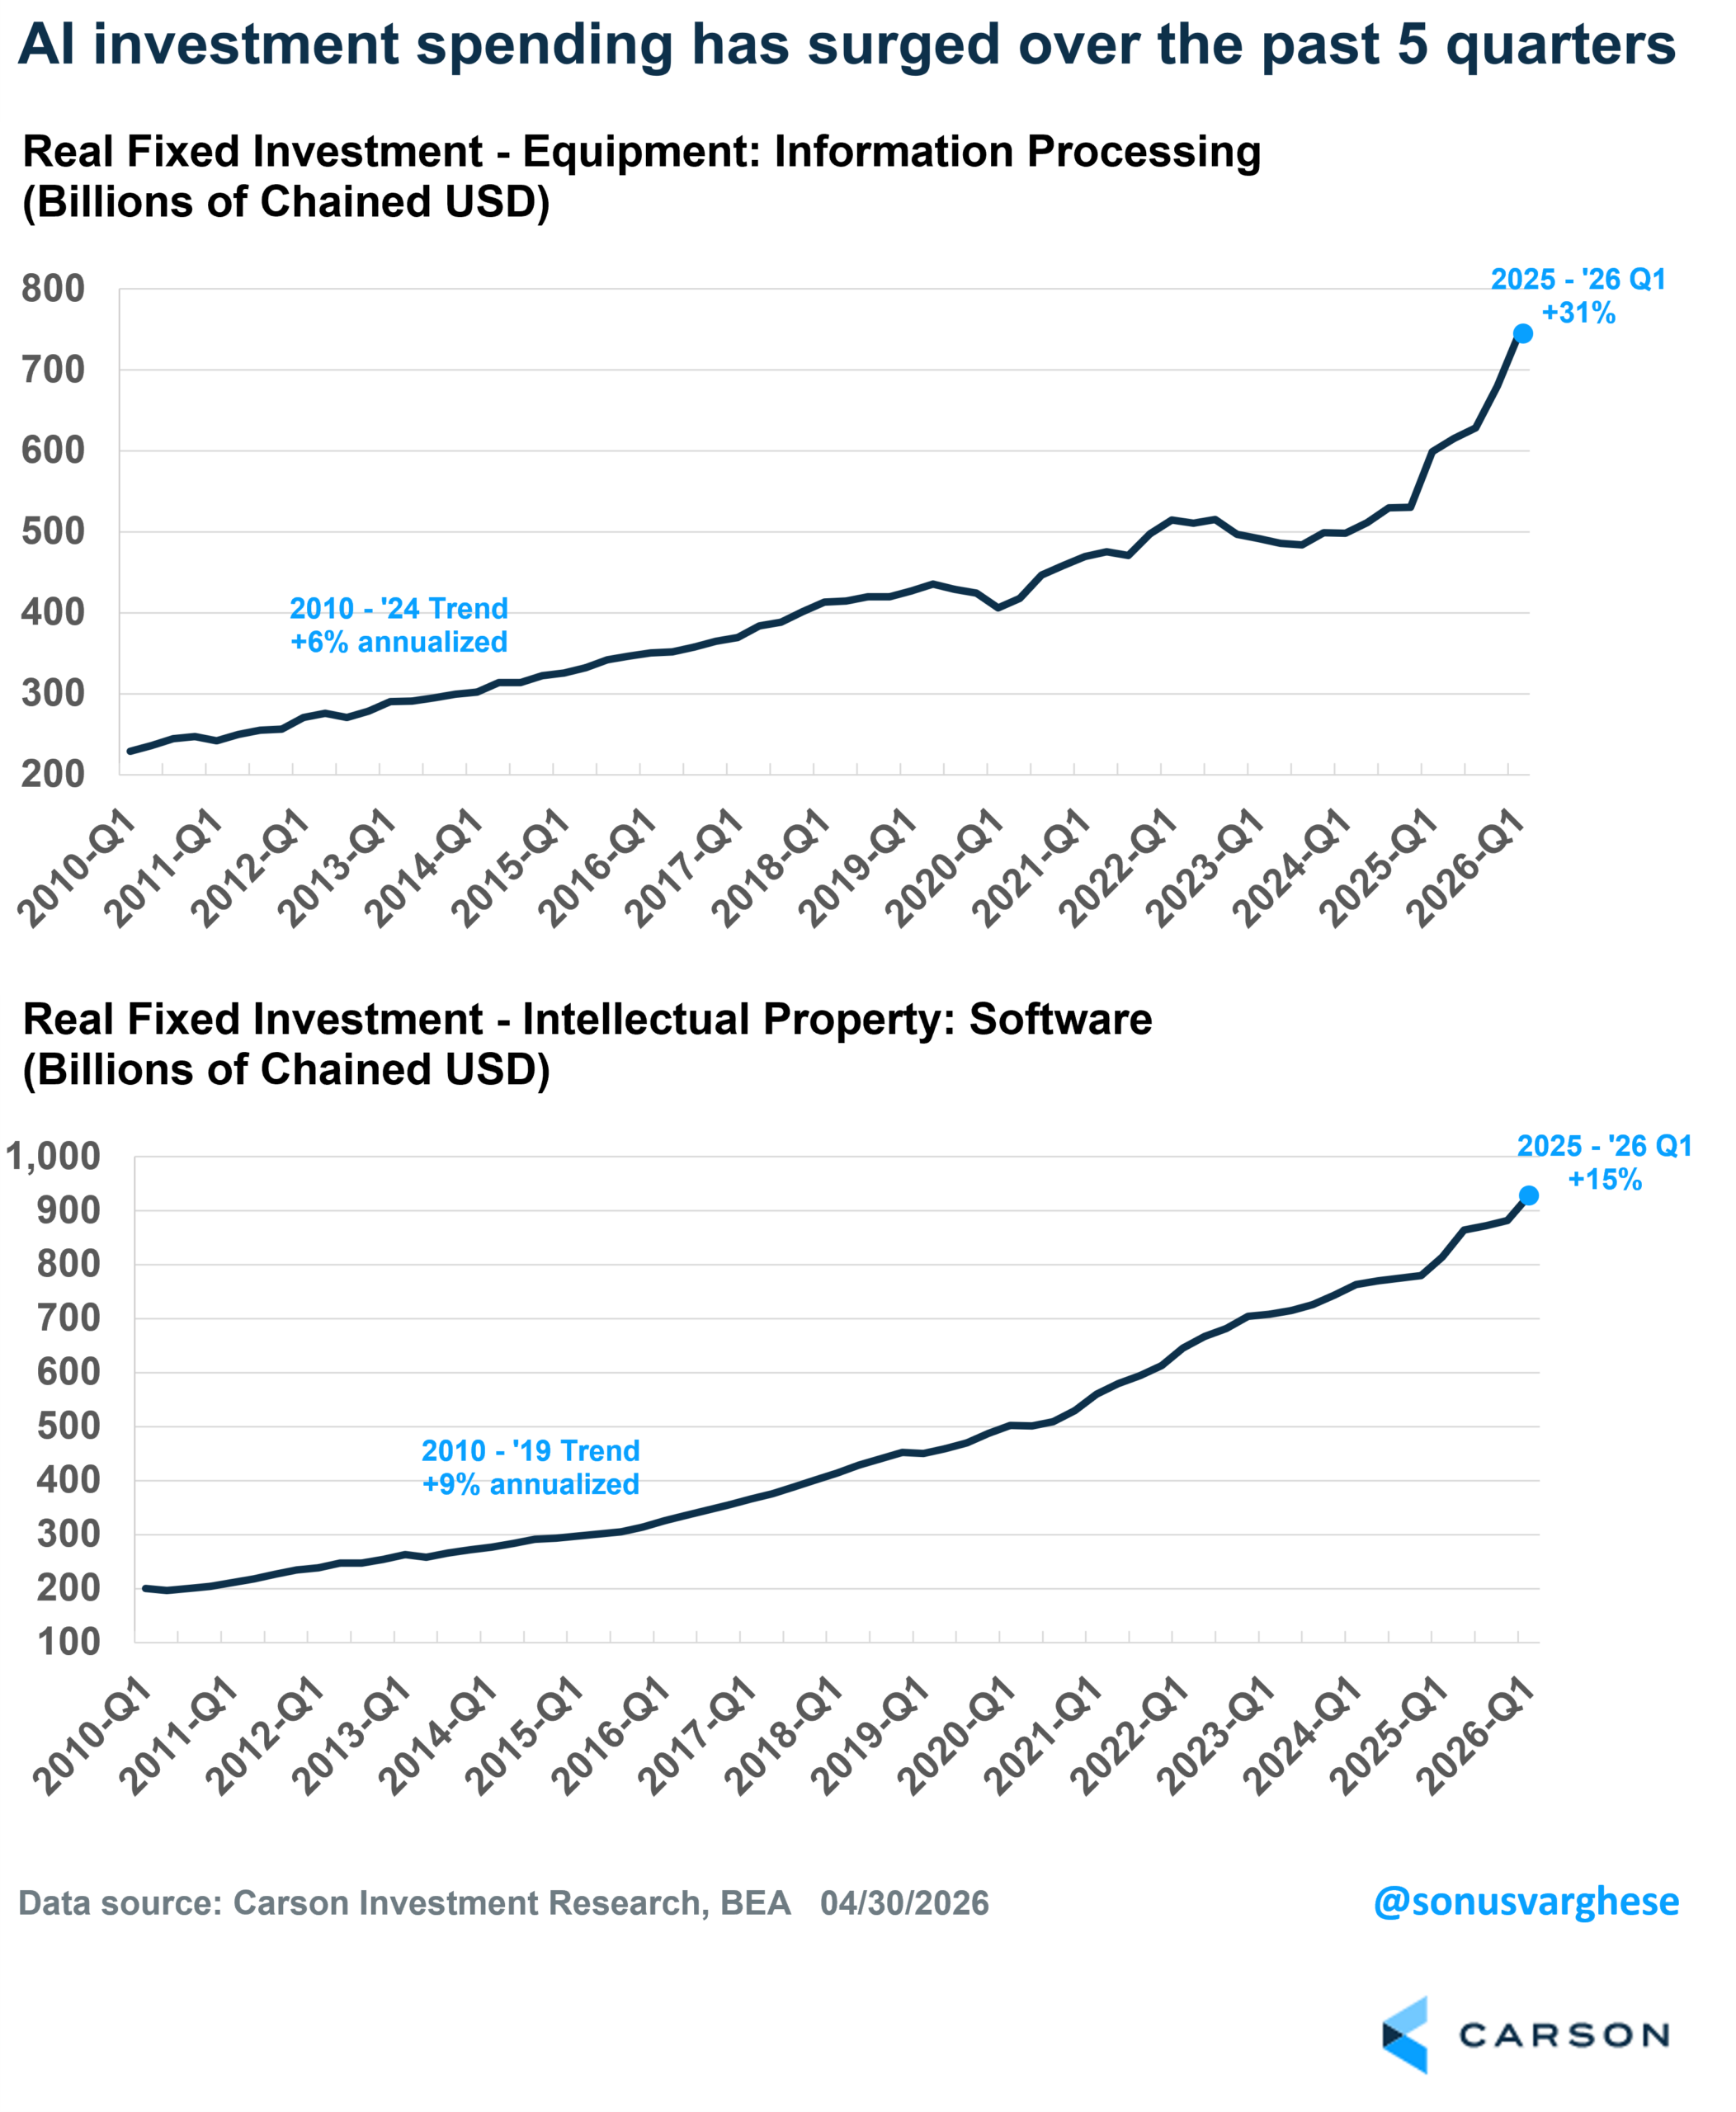
- On the hardware side, investment spending on IT equipment rose at an annualized pace of 43% in Q1 and clocked in at a 31% annualized pace over the past five quarters. The 2010-2024 annual pace was just 6%.
- On the software side, investment spending rose at an annualized pace of 23% in Q1 and clocked in at a 15% annualized pace over the past five quarters. The 2010-2024 annual pace was 9%.
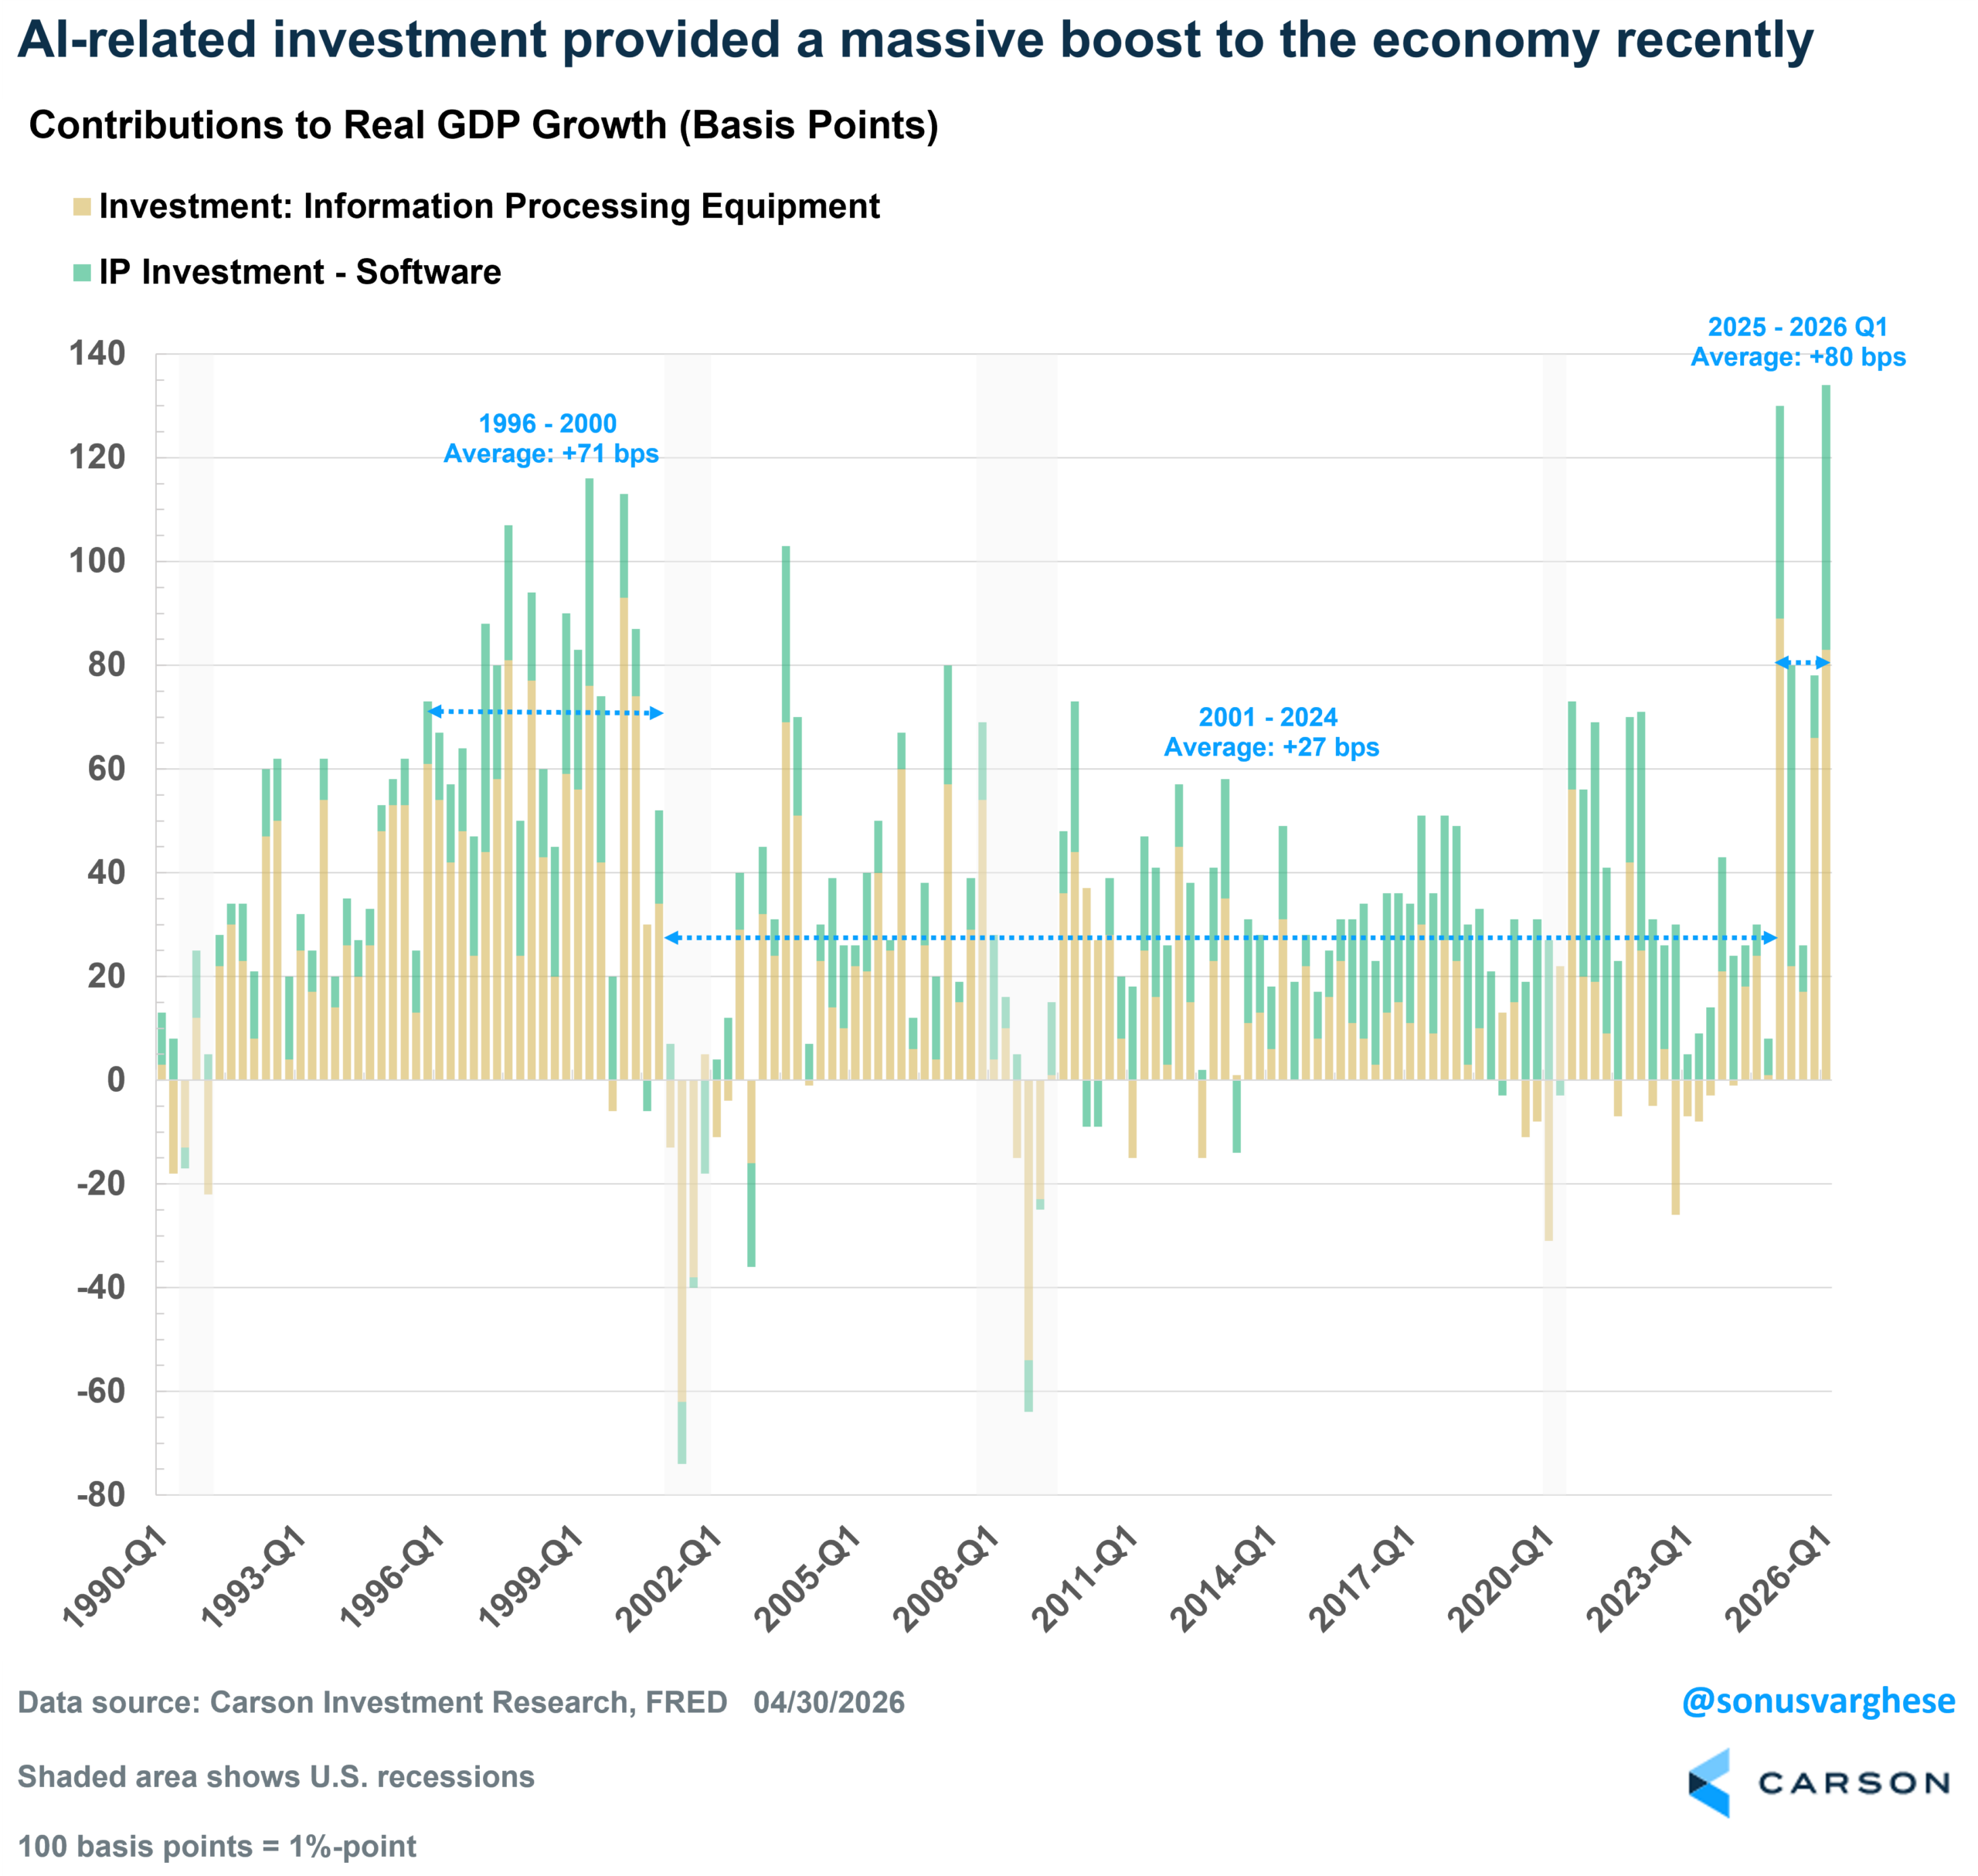
These numbers are simply massive, and keep in mind that these are all adjusted for inflation. They’ve made a huge contribution to GDP growth recently. Across the past five quarters, real GDP growth averaged 2.0%.
- AI-related hardware (IT equipment) and software spending contributed 0.90%-points (pp) per quarter or about 45%(!) of real GDP growth.
- For perspective, consumption contributed an average of 1.36 pp per quarter.
- But consumption makes up 68% of the economy, while AI-related investment spending makes up just under 5% of GDP.
- From 2001-2024, IT equipment and software spending contributed on average 0.27 pp per quarter.
- Even during the internet boom (1995-2000), it only contributed an average of 0.68 pp per quarter to real GDP growth.
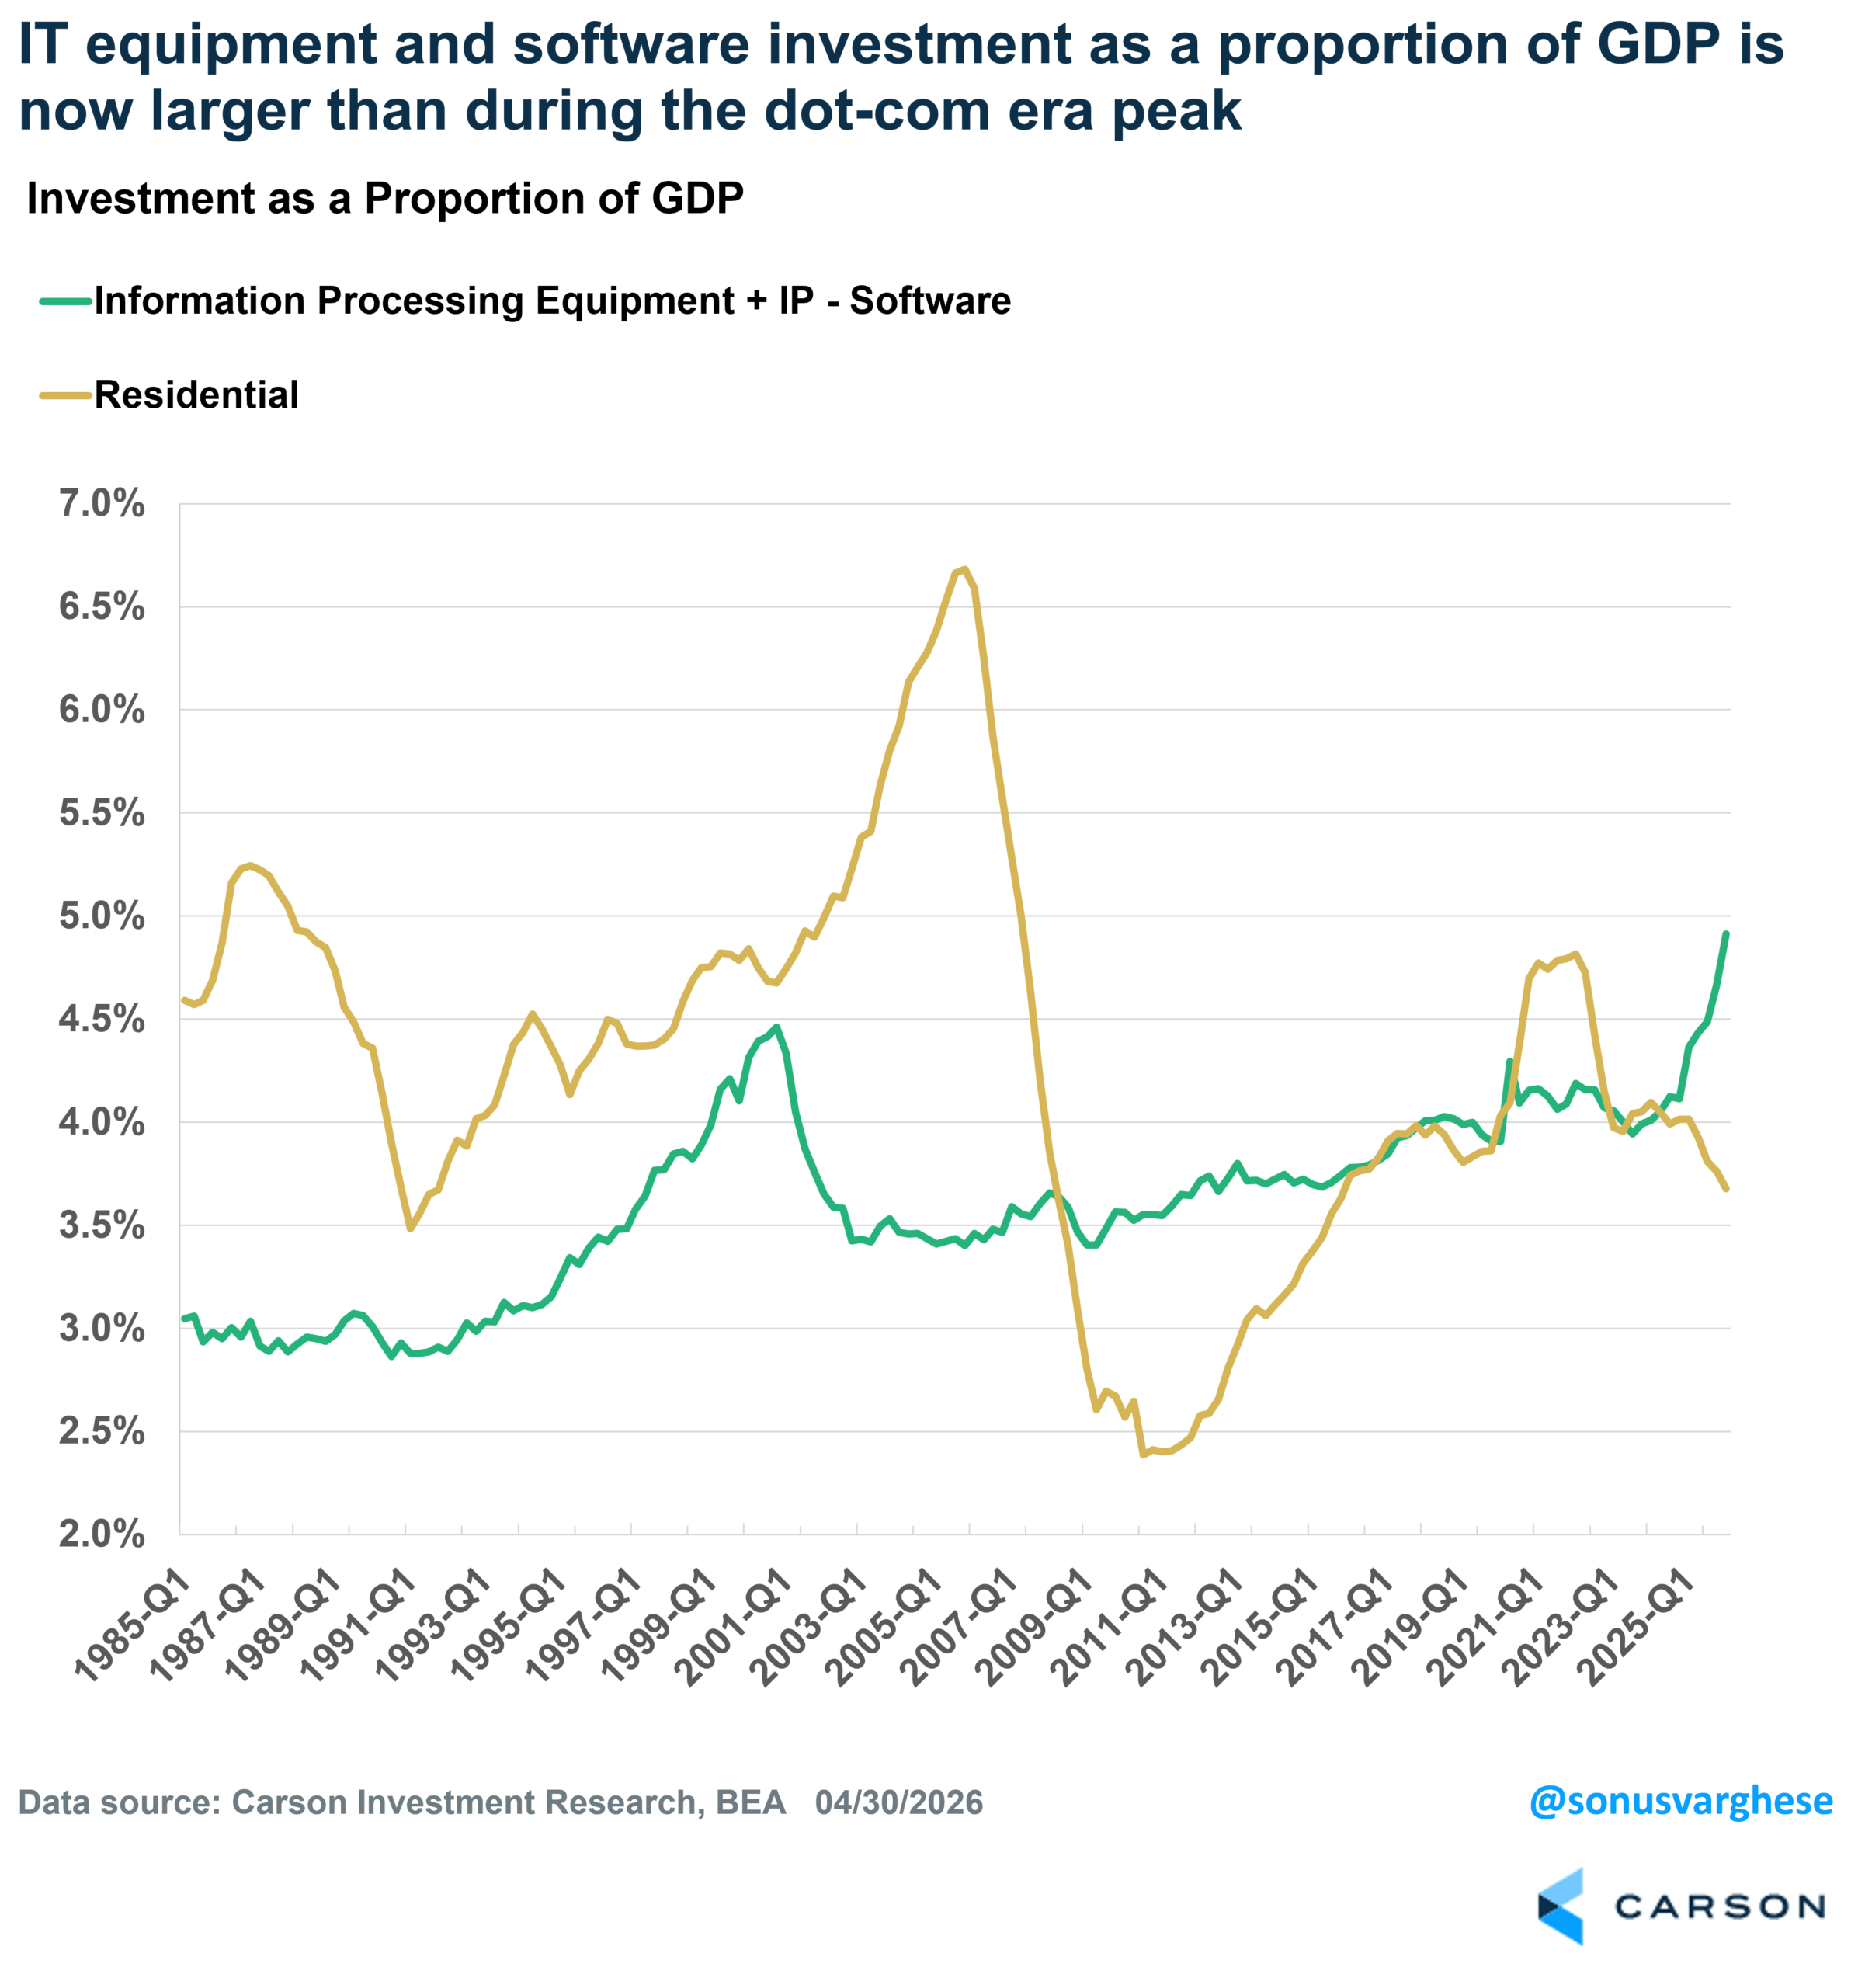
AI-related investment – IT equipment and software – makes up about 4.7% of GDP, and that is higher than what we saw during the peak of the dot-com era, when these two categories made up 4.5% of GDP. For perspective, residential investment made up over 6.5% of GDP at the peak of the housing bubble (it’s collapsed to about 3.5% since then).
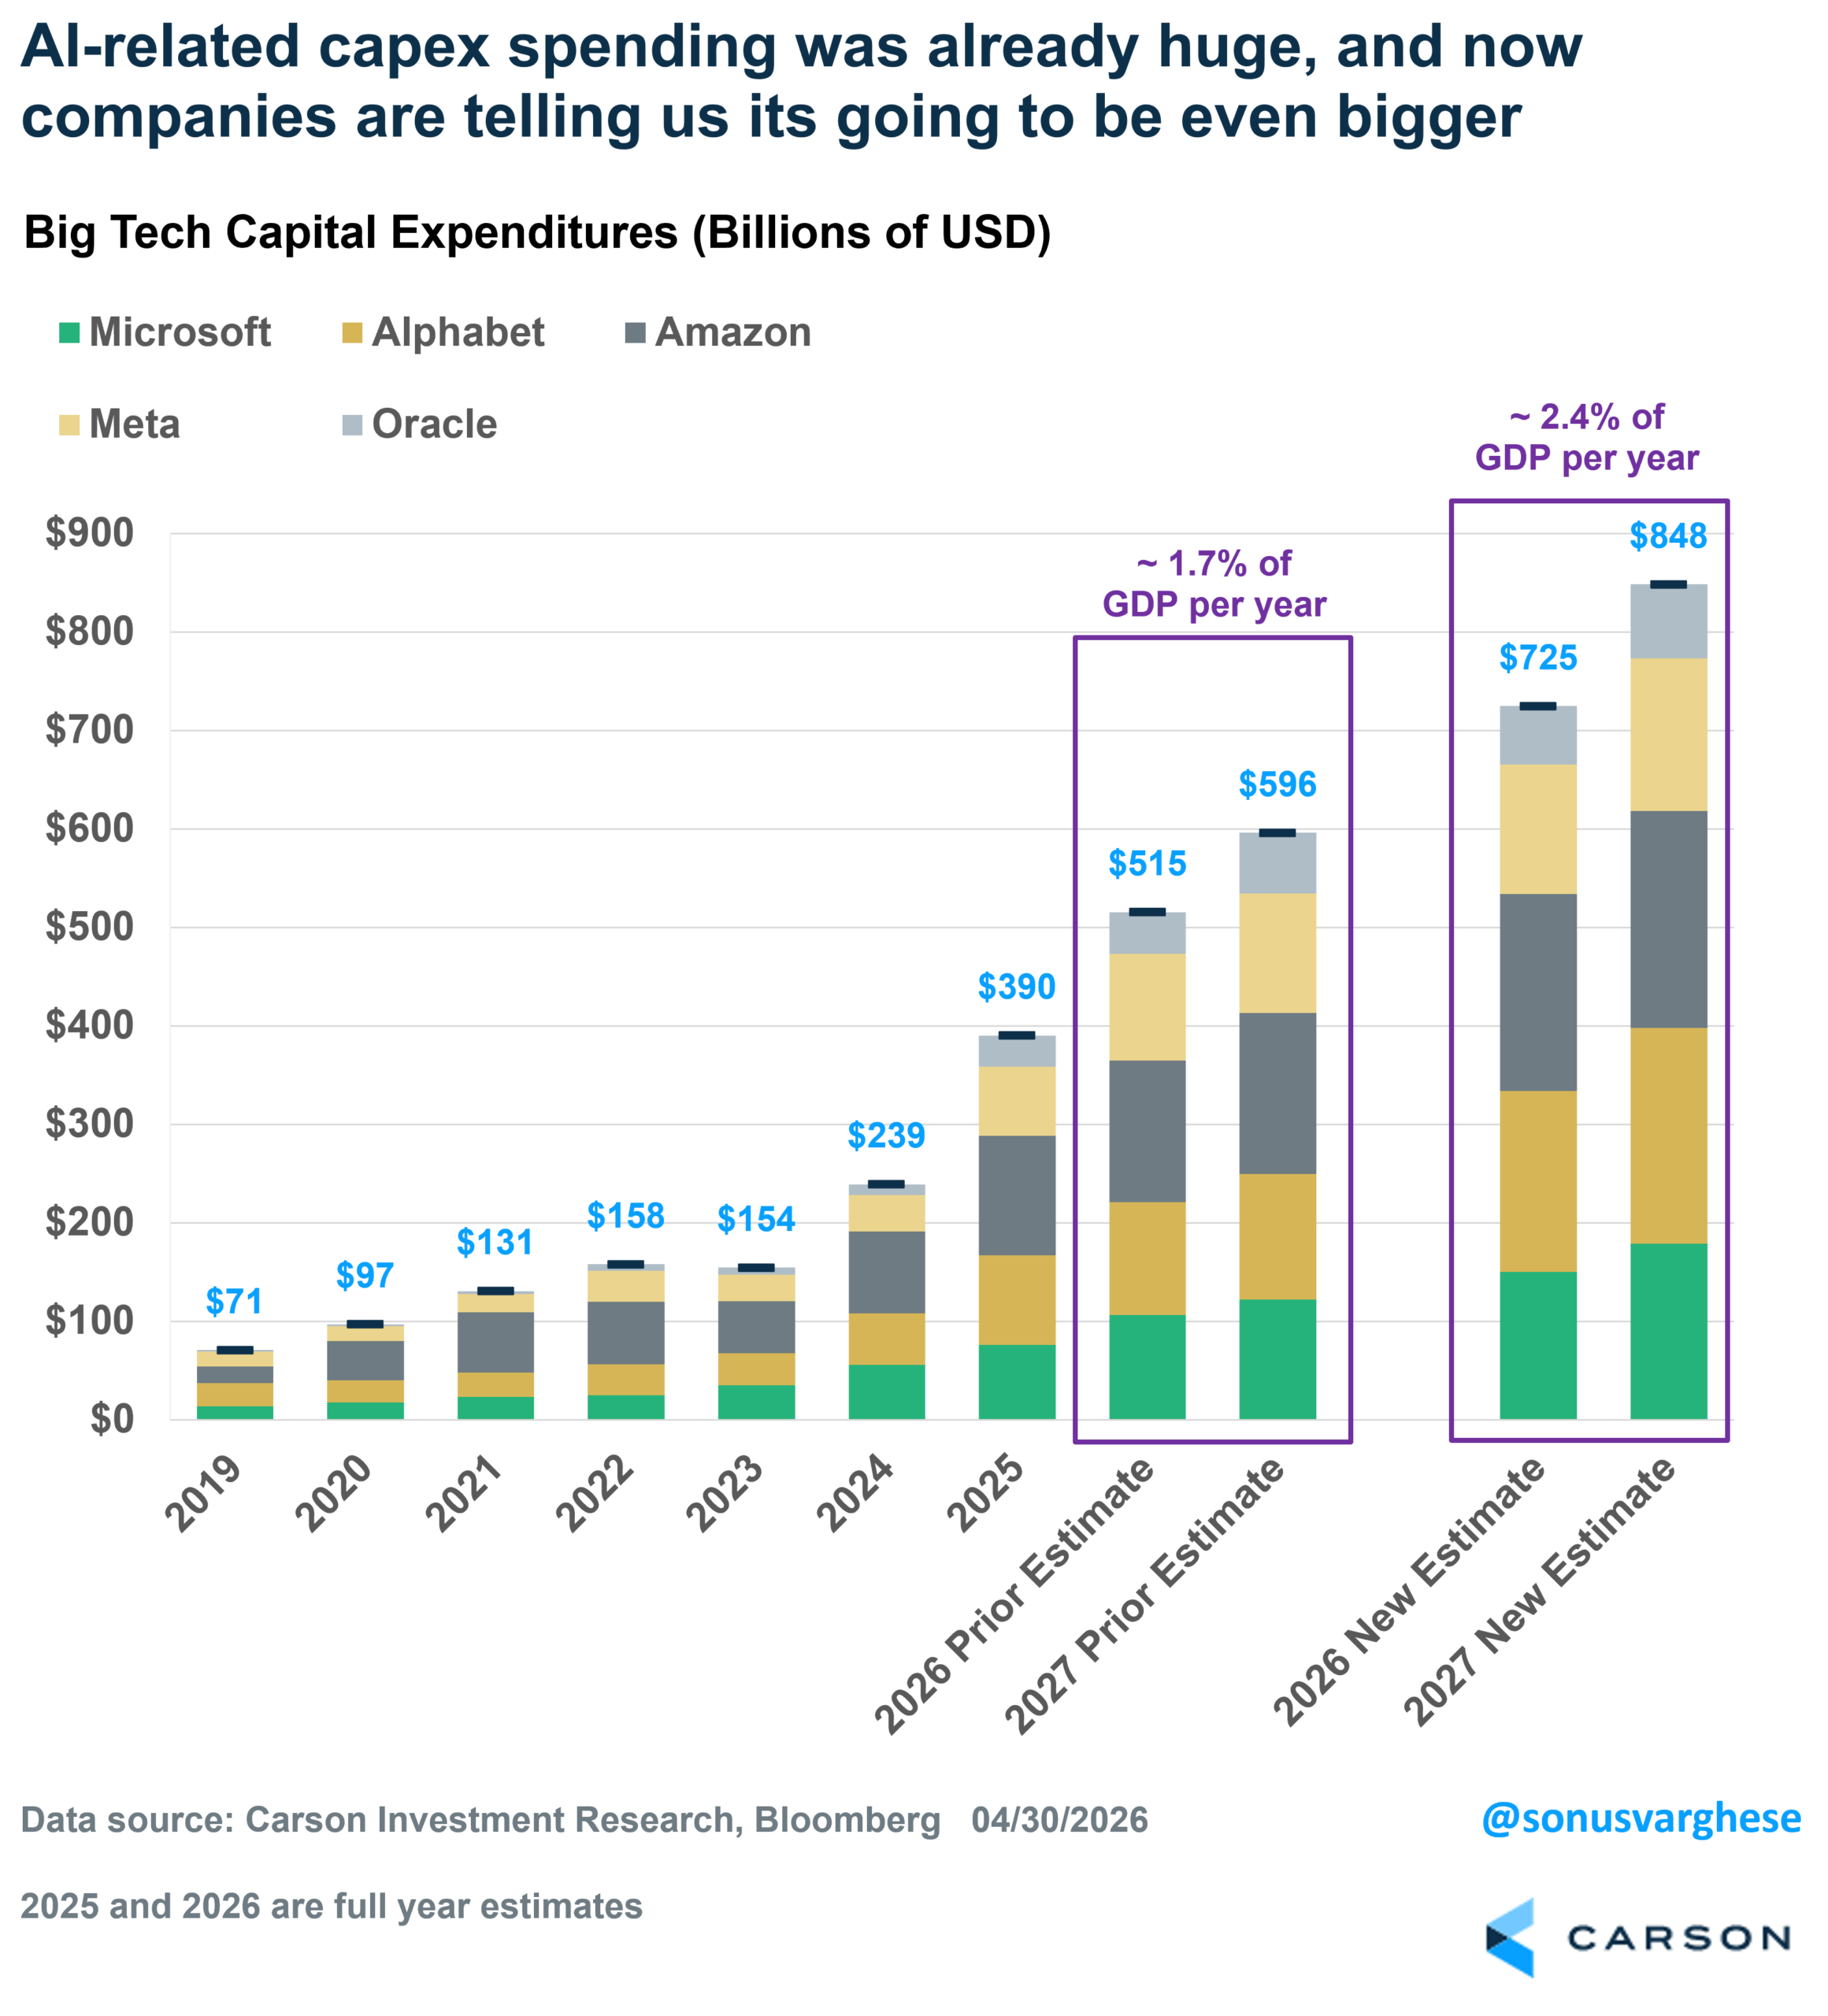
Looking ahead, it doesn’t seem like there’s any letup in AI-related capex spending. The big tech firms recently reported earnings, and they’re ramping up capex to even larger levels. When we wrote our 2026 Outlook, we estimated that these firms would spend a total of $515B on capex in 2026, up from almost $400B in 2025. That amounts to about 1.6% of GDP, which is staggering. The most recent updates take the 2026 capex estimate to a whopping $725B, which is about 2.3% of GDP (2027 is expected to be even larger) – that is over 4x the level of capex in 2023 (0.5% of GDP) and 7x the size of where it was in 2019 (0.3%).
What’s important to keep in mind here is that one company’s spending is another company’s revenue and profits. That’s the connection between all this spending and what you see in the stock market.
But Why Is Real GDP Growth Relatively Weak?
Real GDP grew just 2% annualized in Q1, below expectations for a 2.3% increase. This was a pickup from the weak Q4 pace of just 0.5%, but in line with the 2025 pace of 2%. The big bounce from Q4 to Q1 was not a surprise, as weakness from the government shutdown in Q4 reversed and boosted growth in Q1. One way to look past the shutdown impact is to average real GDP growth across the last two quarters, but that gets you to a relatively weak 1.25%. That is a marked slowdown from the 2023-2024 pace of 2.9% and also below the 2010-2019 trend of 2.4% annualized.
This seems strange given the AI-related investment boom, but the issue is that a lot of the equipment is imported (these are also exempted from the post-Liberation Day tariffs), and so it doesn’t directly “contribute” to GDP in a strict sense, since only goods produced domestically contribute to GDP.
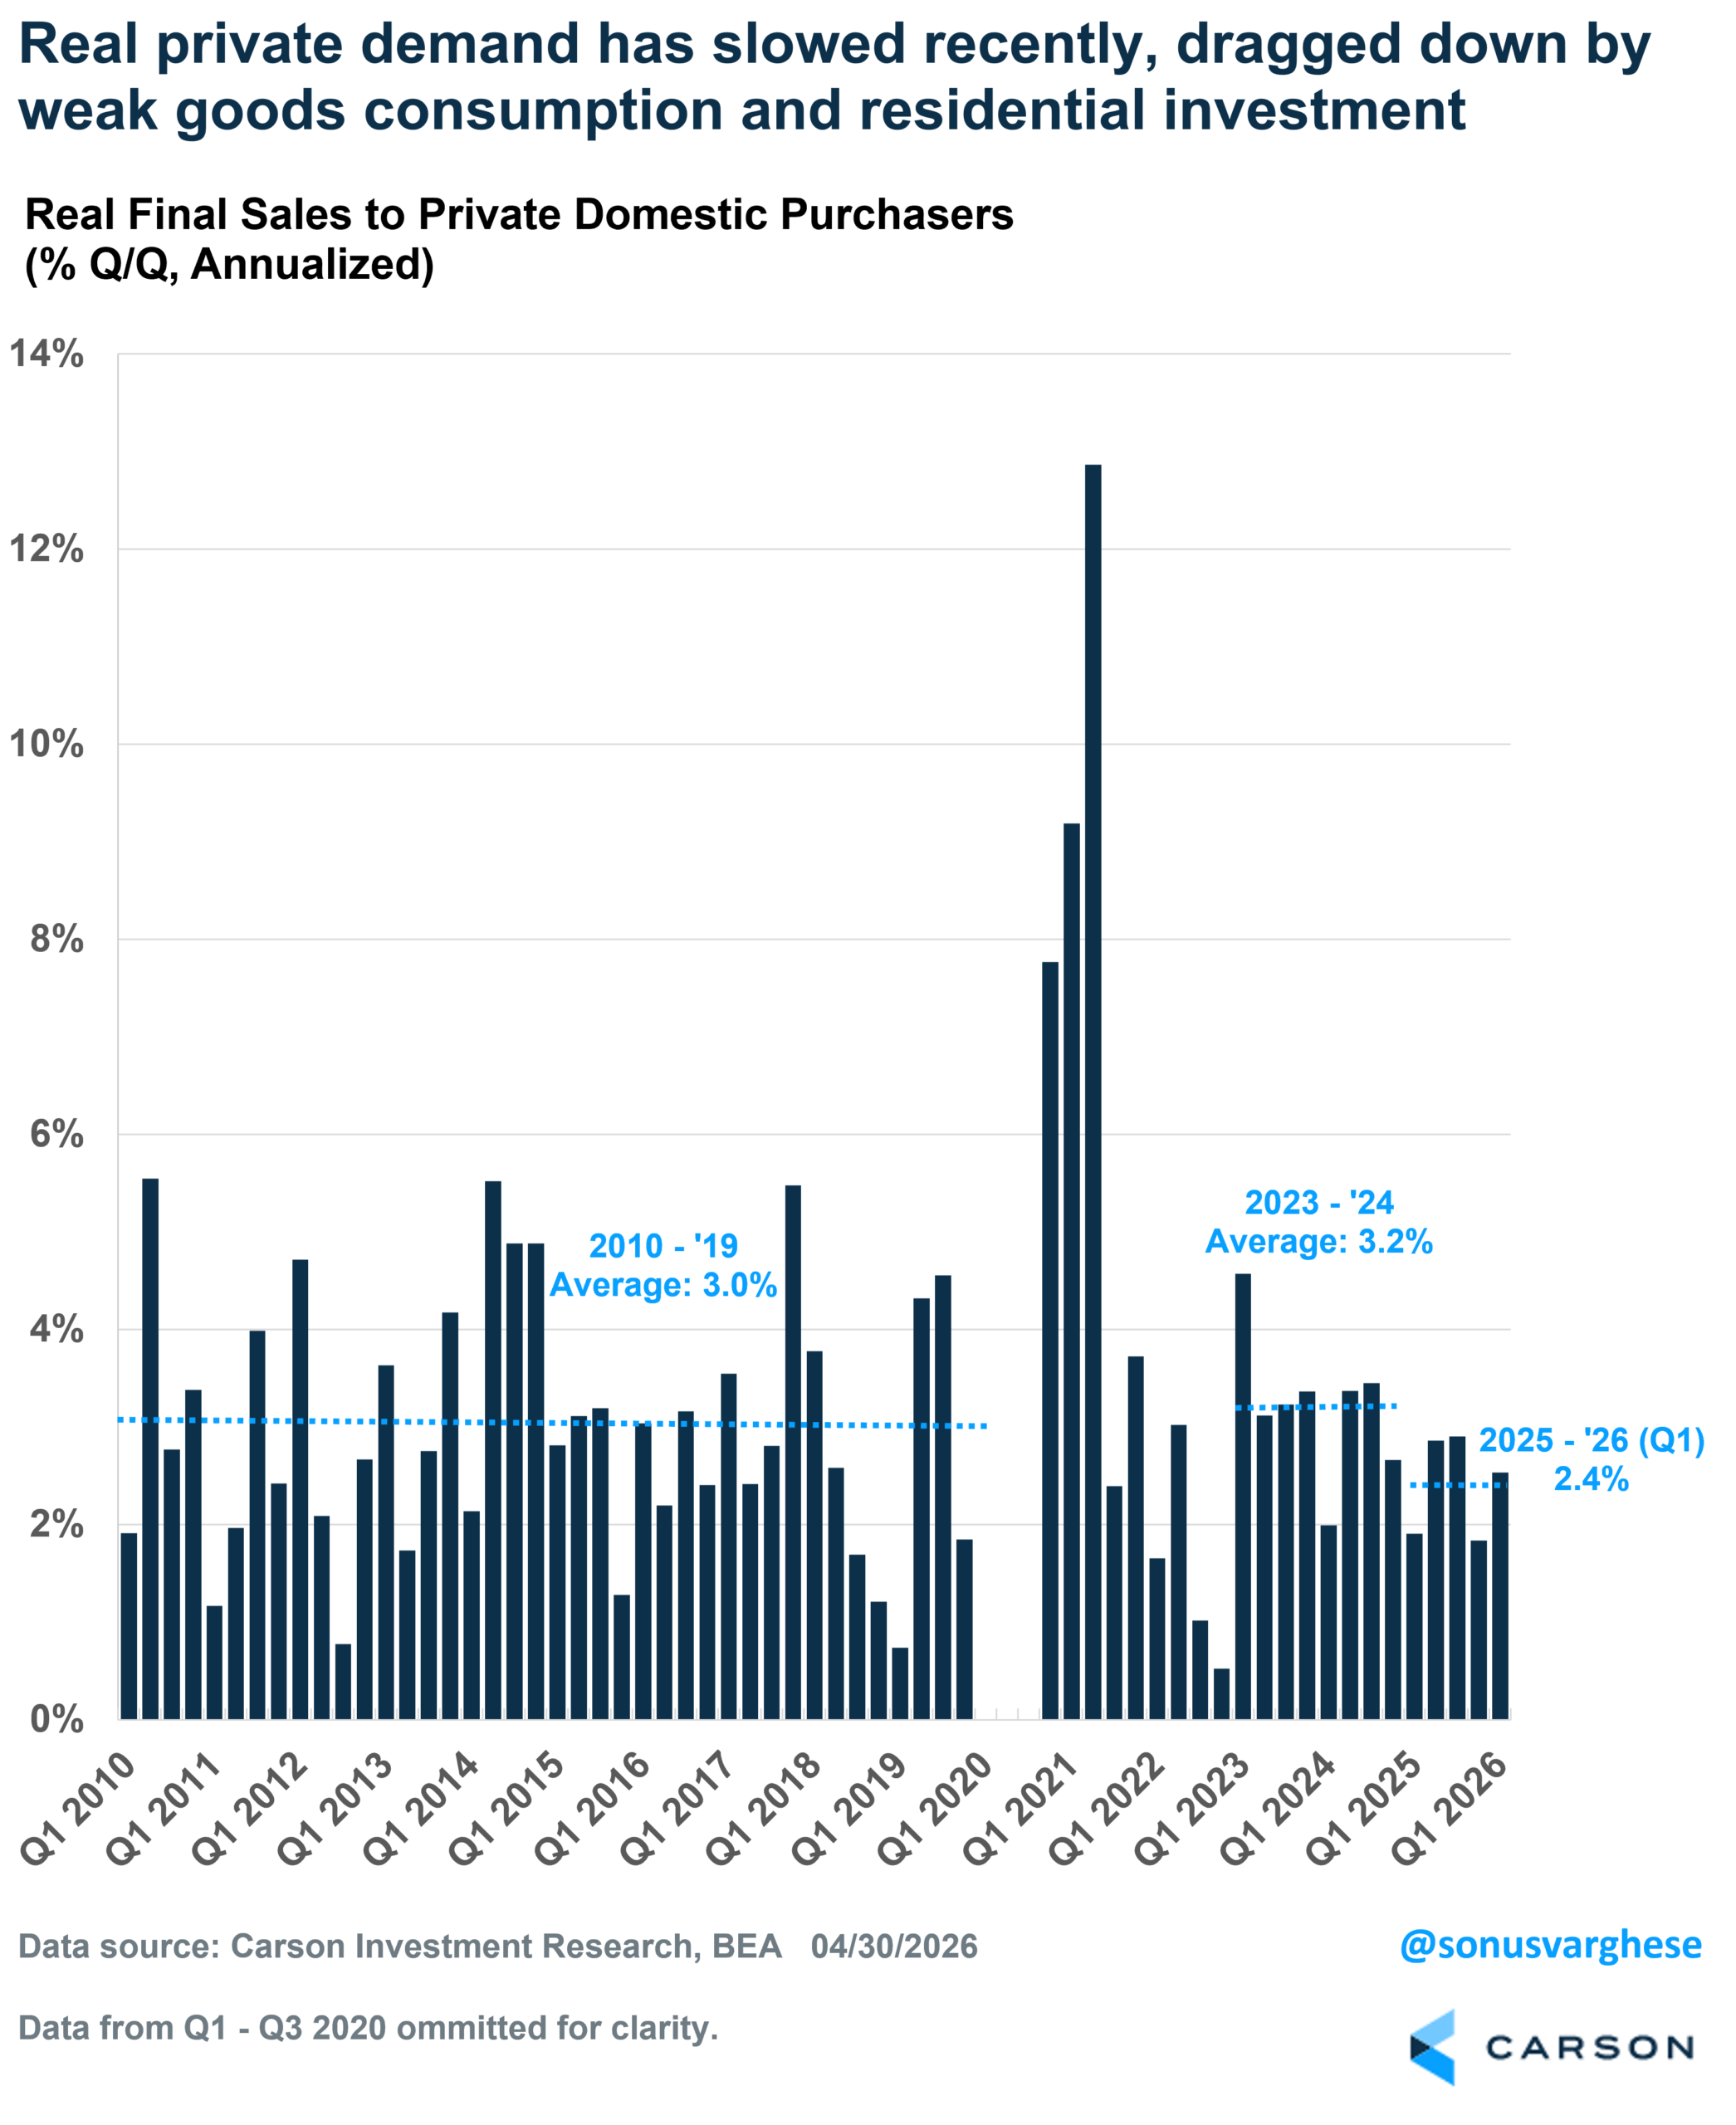
GDP growth can be noisy because of volatile components like net exports (exports minus imports) and inventories. Excluding these gives us “real final demand,” which is a picture of domestic activity (sales) – the combination of household consumption, investment, and government spending.
Real demand rose at a robust annualized pace of 2.8% in Q1 thanks to the rebound in government spending. If we just focus on the private sector, real demand rose at a relatively healthy pace of 2.5%, and it has averaged 2.4% annualized over the last five quarters. That’s not bad, but it’s slower than the 3.2% pace we saw across 2023-2024 or the 3.0% trend from 2010-2019.
Real final demand running below trend is essentially why GDP growth over the last five quarters has clocked in below trend. There are two big drivers here:
- Weak goods spending, which has run at an annualized pace of just 1.1%, well below the 2010-2019 trend of 3.6% and the 2023-2024 pace of 3.9%
- Weak residential investment, which has fallen at an annualized pace of almost 5% over the last five quarters, versus 4.6% across 2010-2019 and 1.9% in 2023-2024
Goods spending can be volatile, especially as consumers pull back amid higher inflation. But housing is paying the highest cost of higher inflation, because of higher interest rates. Residential investment has now fallen in seven of the last eight quarters, and this weakness is likely to continue if interest rates remain on the higher side.
Inflation Is Elevated, and Rising
Despite the energy crisis, arguably the most important macro story right now is the AI wave. The big picture is that AI demand continues to increase, but supply can barely keep up. Which is why you’re seeing the massive AI-related investment, and that is more than offsetting weakness in other parts of the economy (like housing). However, the other side of this is inflation.
Stay on Top of Market Trends
The Carson Investment Research newsletter offers up-to-date market news, analysis and insights. Subscribe today!
"*" indicates required fields
Amid AI-related bottlenecks, the Personal Consumption Expenditures Price Index (PCE) for computer software and accessories rose at an annualized pace of 59% in Q1. Prices for this category fell continuously over the past decade, but we’re seeing prices surge higher amid the AI-boom.
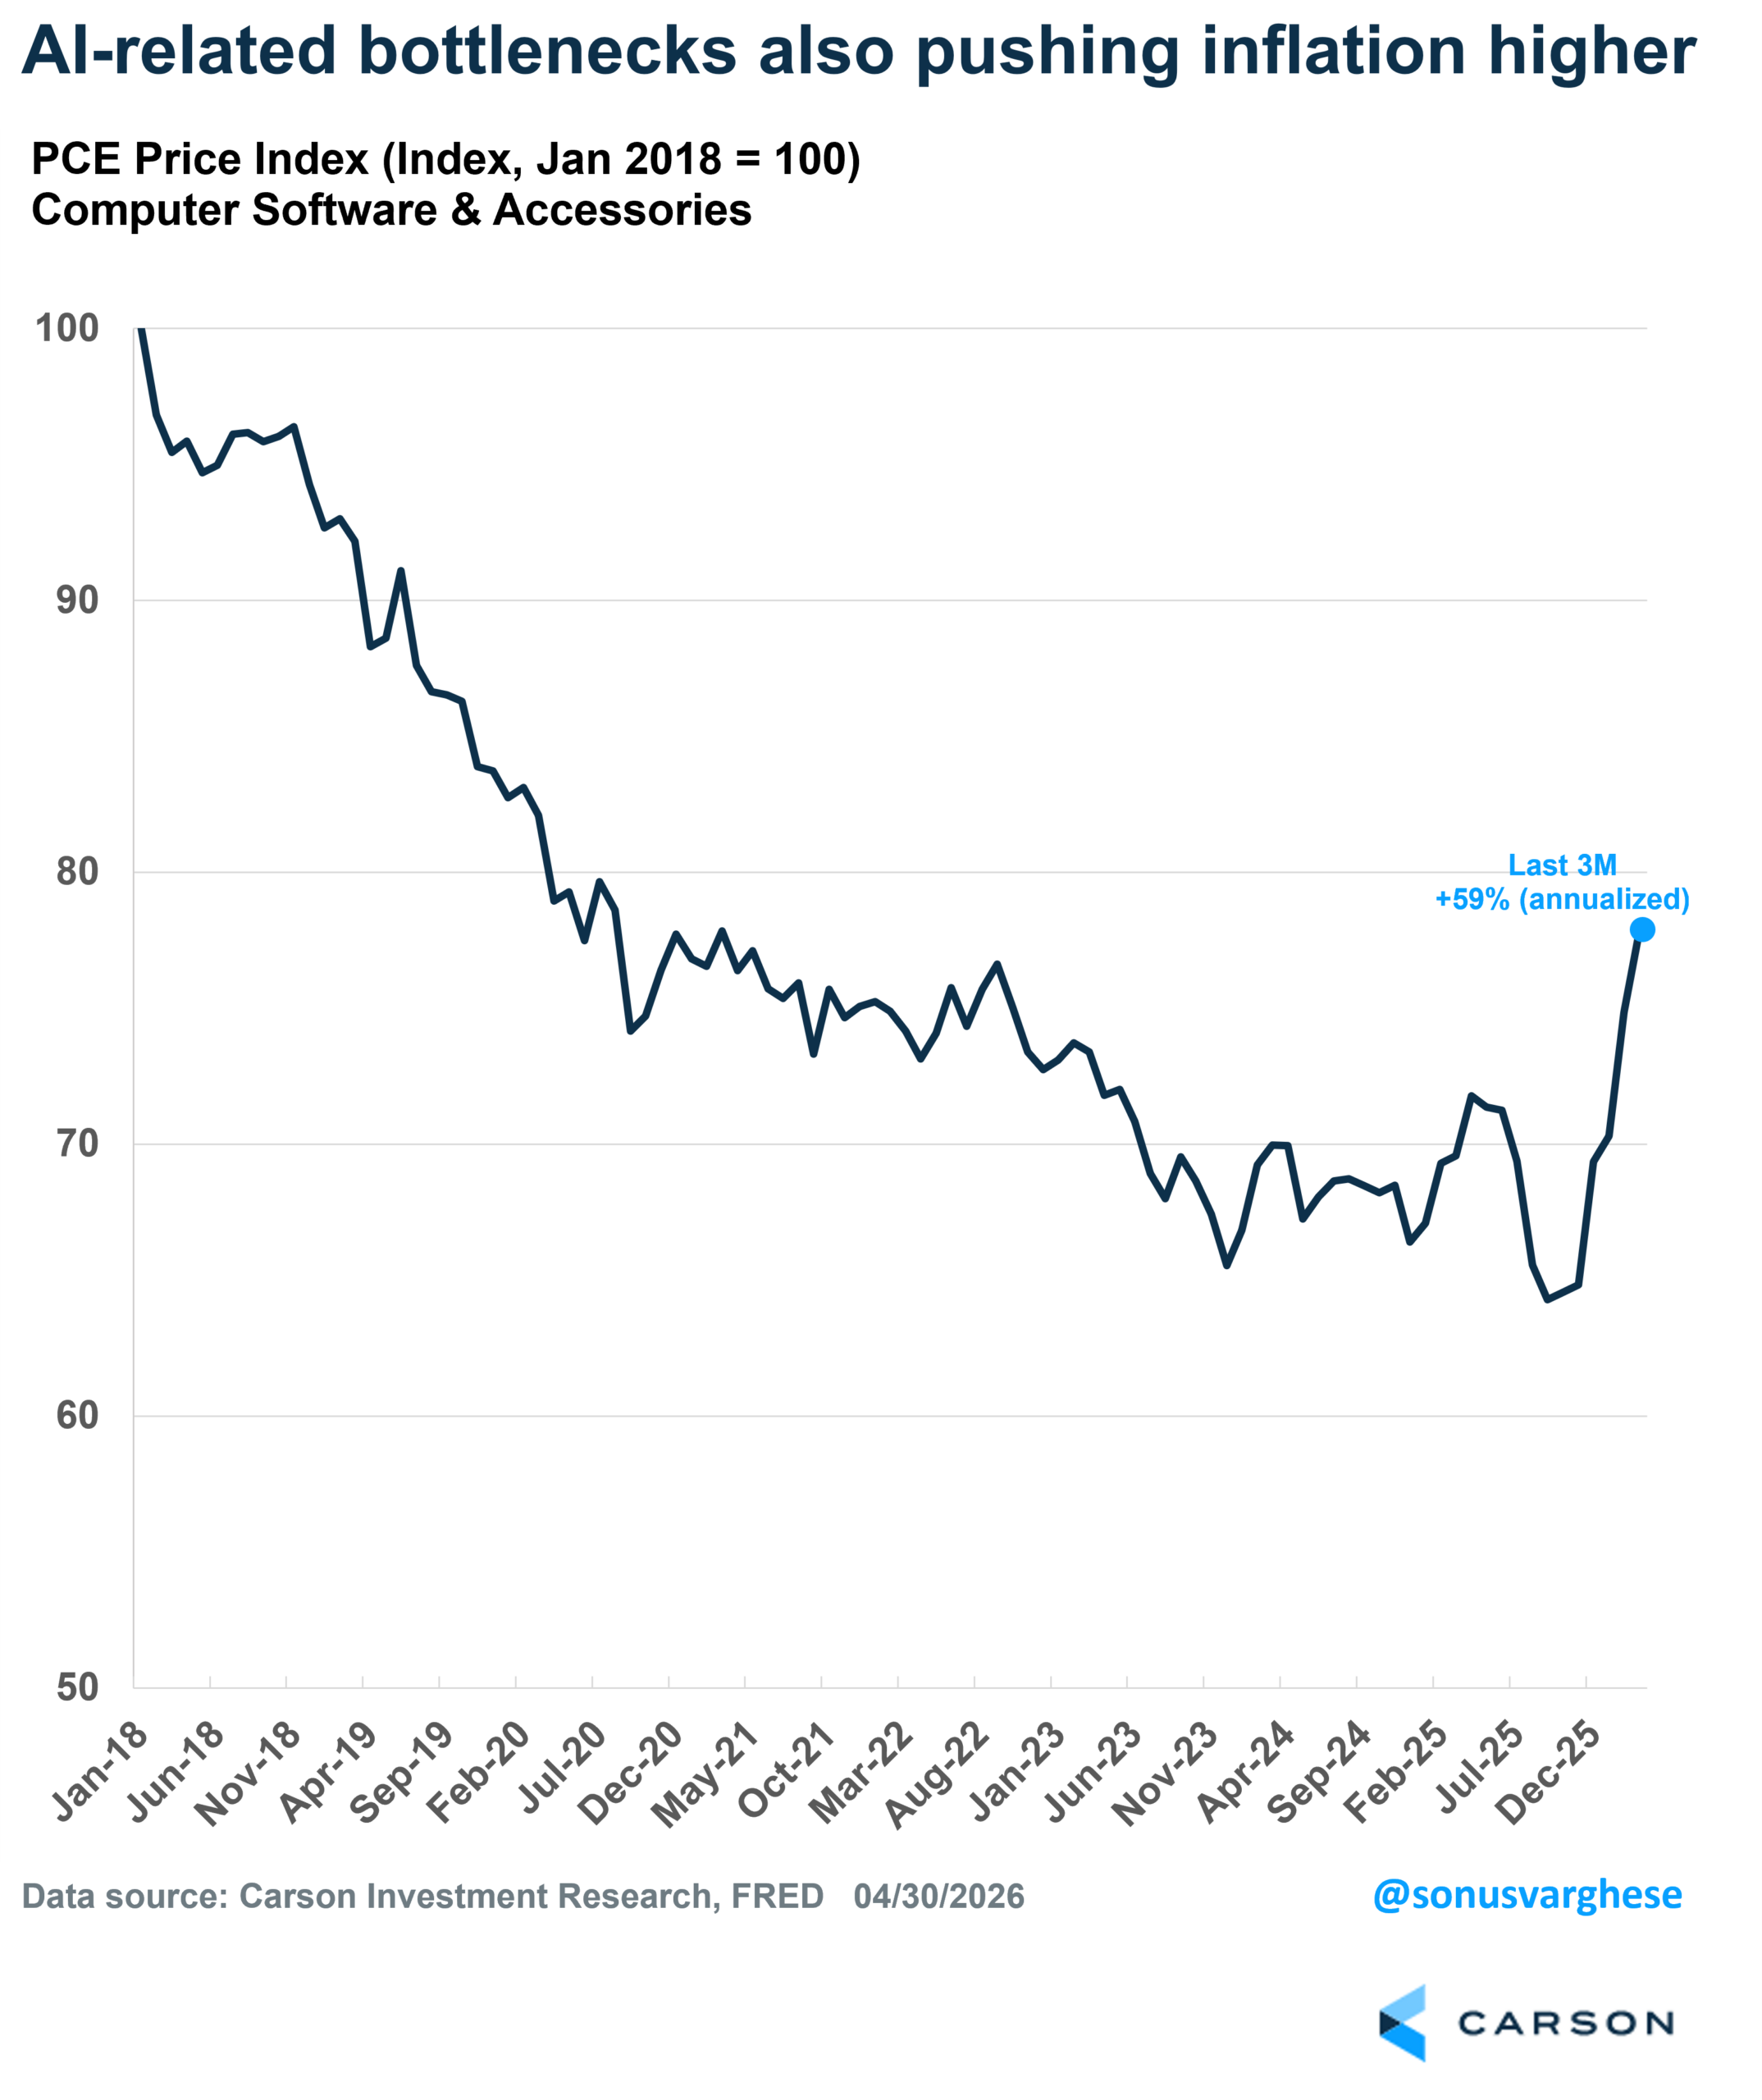
Of course, AI-related bottlenecks are just one of many problems within the inflation data. The energy shock from the Middle East crisis has sent inflation data well above the Fed’s target of 2%.
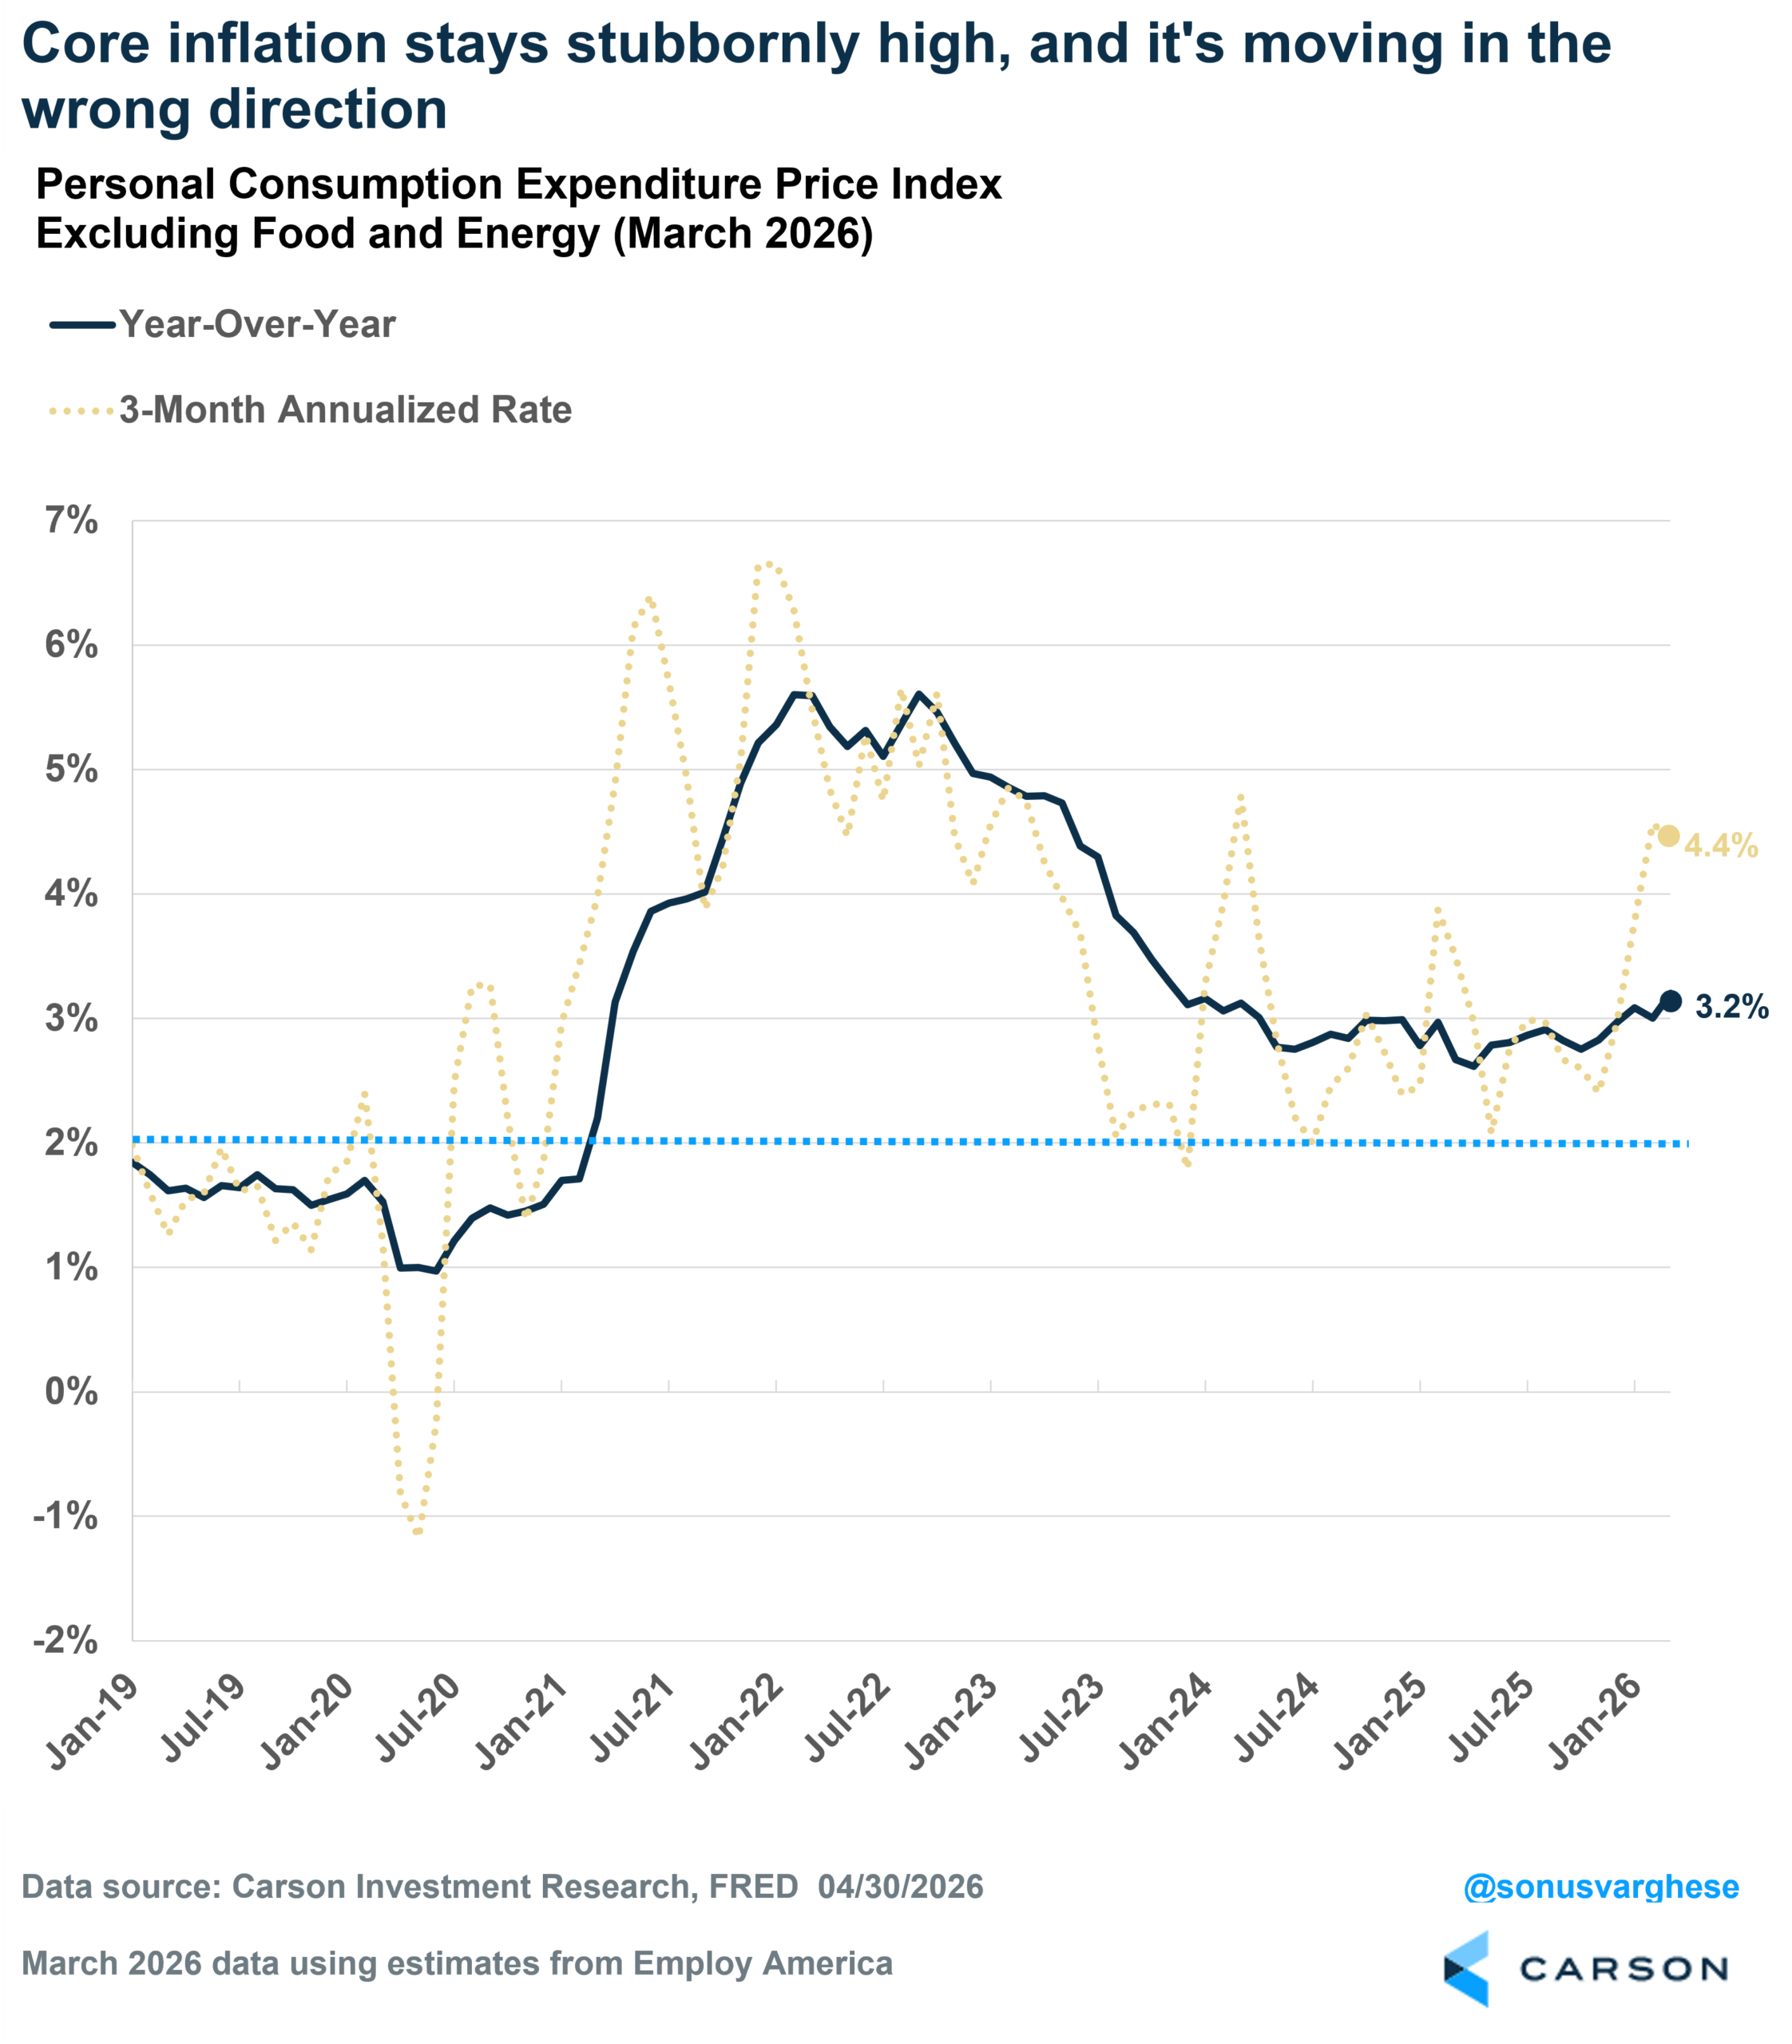
Headline PCE rose at an annualized pace of 5.6% in Q1 and is up 3.5% since last year. The core inflation data is worse in a way, because excluding energy (and food) hardly brings good news. Core PCE, which is the inflation metric the Fed tends to focus on, rose at an annualized pace of 4.4% in Q1. The price index is up 3.2% from last year, the 60th straight month above 2.5%. There’s no sign of any deceleration, and in recent months, core PCE has gone the wrong way. It could get worse as the energy shock comes through and feeds into core categories like airfares.
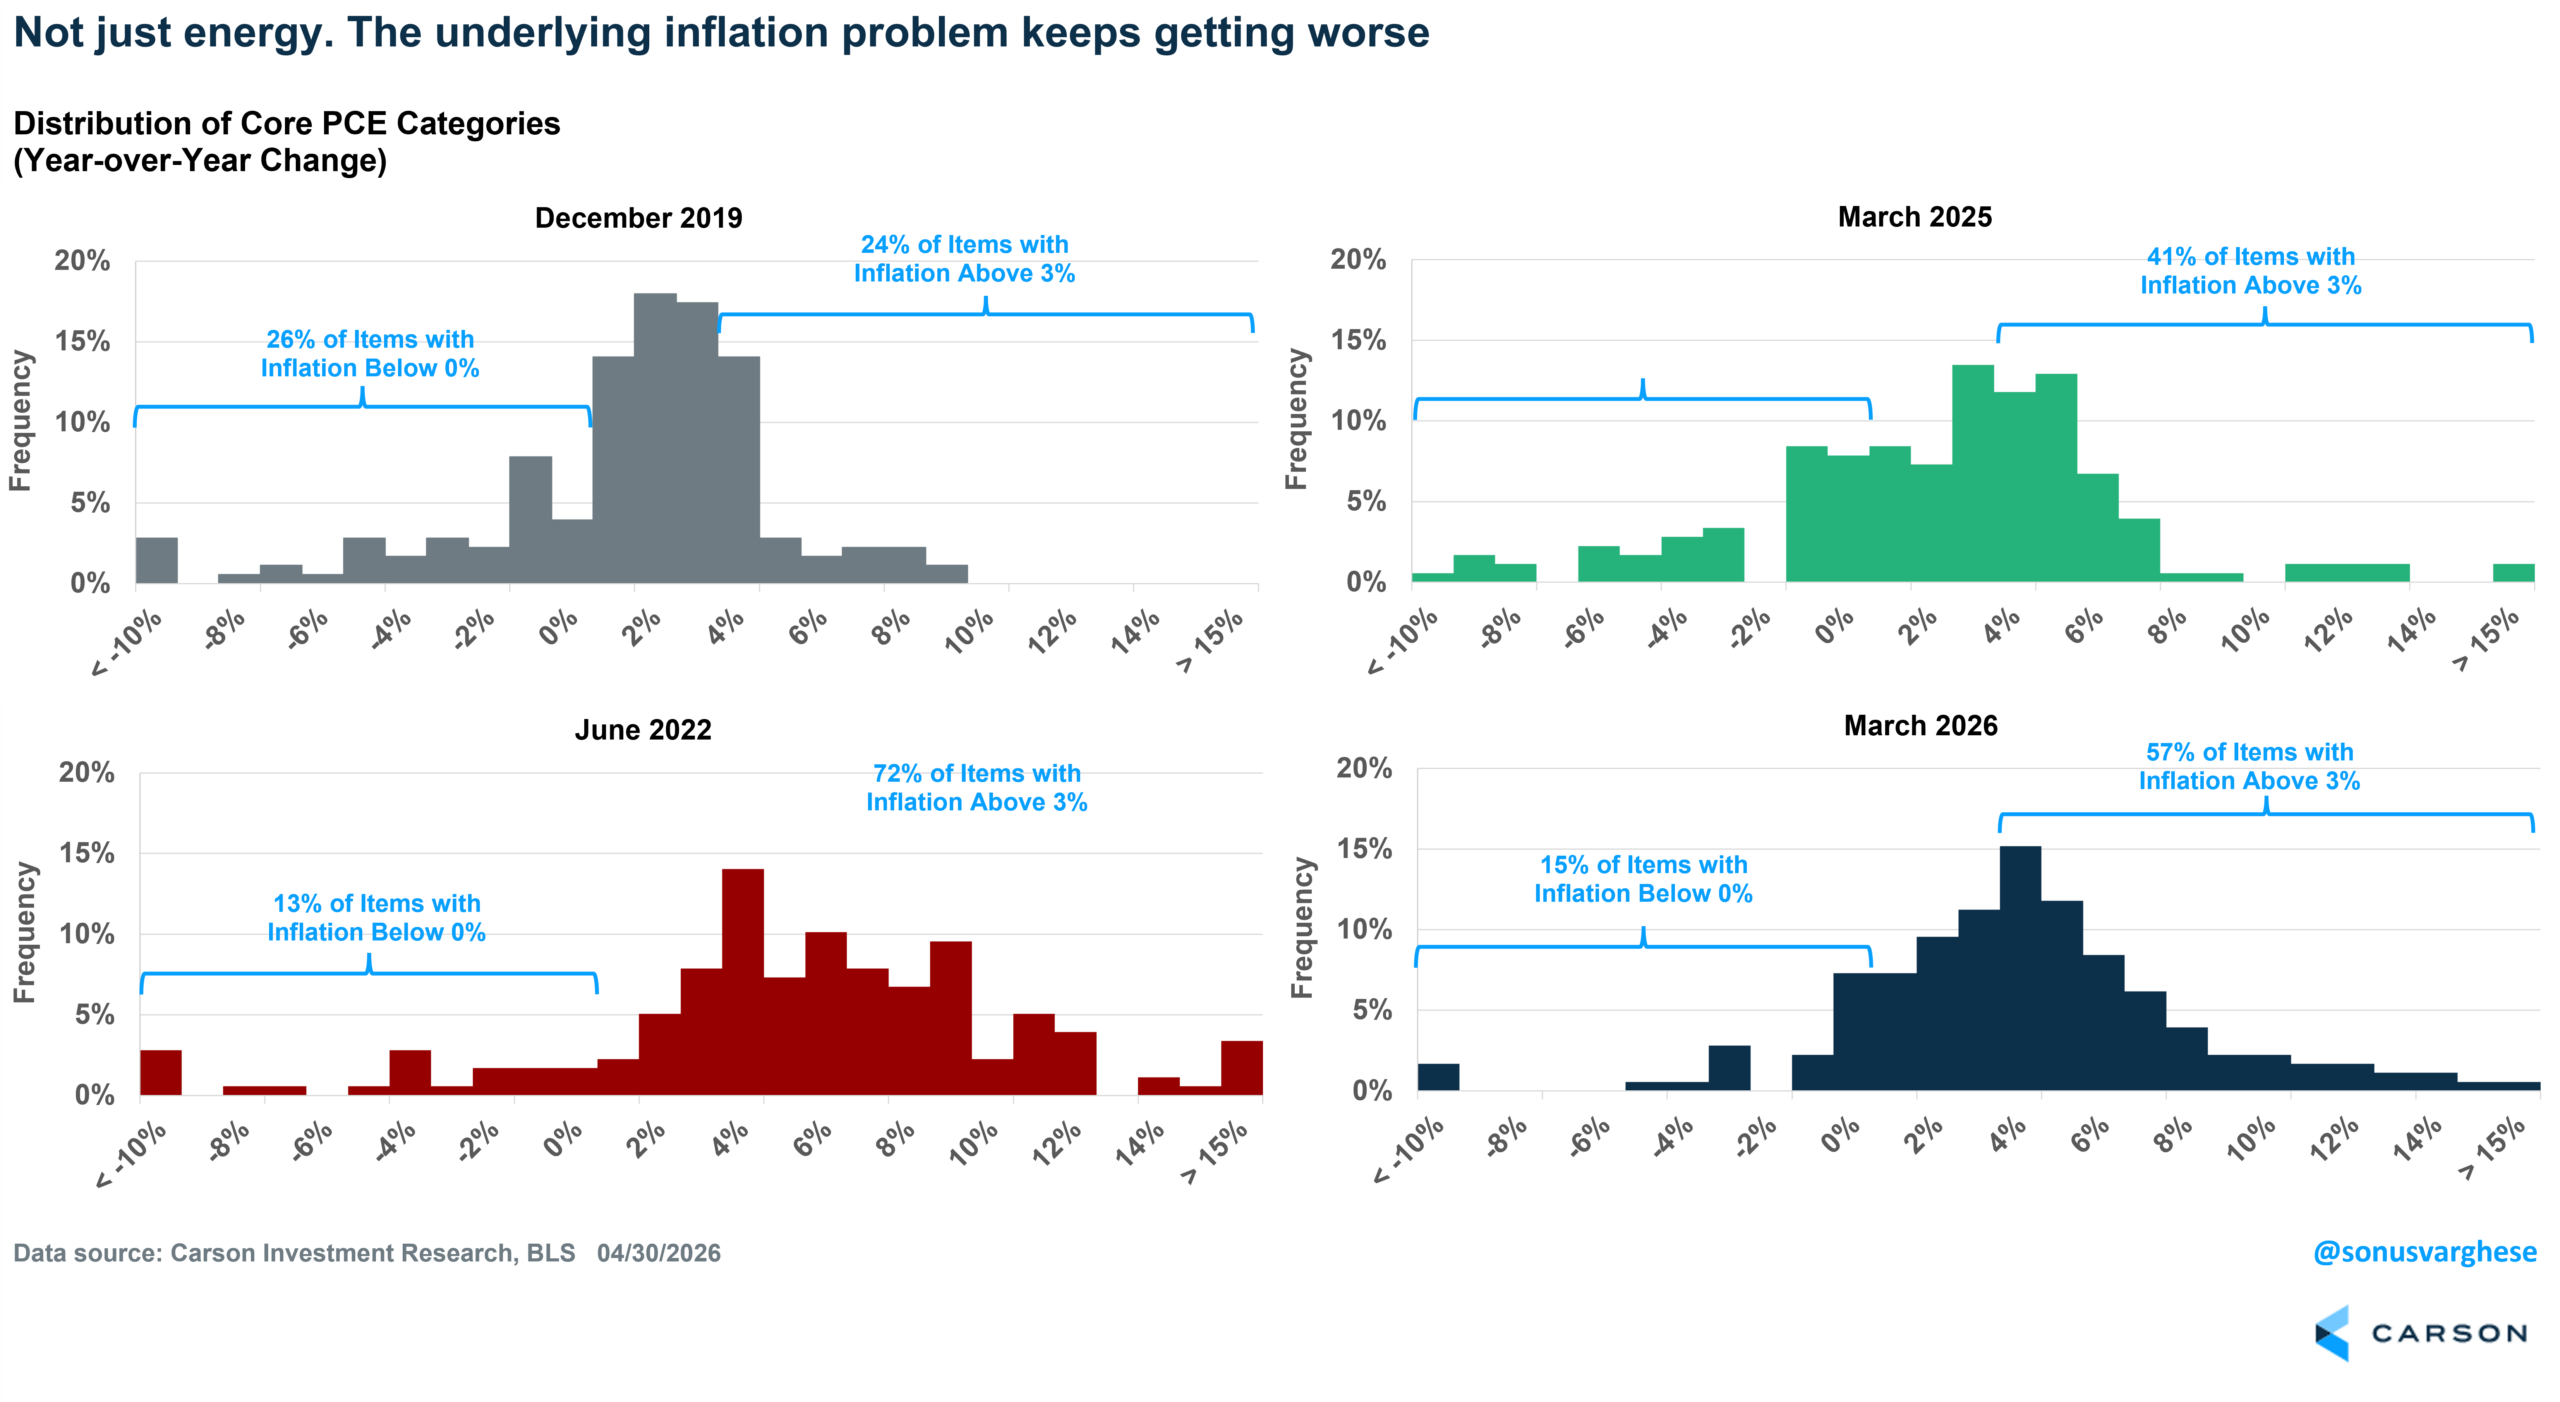
Headline and even core numbers can hide what’s happening under the hood. I looked at 178 items within the core PCE basket and calculated the distribution of year-over-year inflation at four different times. You can see how inflation really broadened out in June 2022 relative to December 2019. The good news up until last year was that the distribution was narrowing, but things were still not quite “normal.” And over the past year, the inflation picture has gotten even worse.
- In December 2019, just 24% of items had inflation rates above 3%
- 10% with inflation rates above 4%
- In June 2022, 72% of items had inflation rates above 3%
- 58% with inflation rates above 4%
- In March 2025, 41% of items had inflation rates above 3%
- 29% with inflation rates above 4%
- In March 2026, 57% of items had inflation rates above 3%
- 42% with inflation rates above 4%
The broadening proportion of categories that are experiencing 3%+ inflation, and even 4%+ inflation, tells you that this is not just an energy problem, or even just energy and tariffs.
Profits Power Stocks to New All-Time Highs
The S&P 500 hit its 11th new all-time high on the last day of April, taking the monthly return to a whopping 10.5%, and the year-to-date return to 5.7%. There’s a lot of confusion as to why markets are hitting all-time new highs amidst an inflation crisis, not to mention real GDP growth running below trend.
The answer is profits (and momentum is a powerful force as well).
We can separate the S&P 500’s return into contributions from:
- Earnings growth
- Multiple changes (the price-to-earnings or P/E ratio)
- Dividends
The S&P 500 is up 5.7% year-to-date, of which:
- Earnings growth contribution: +8.7%-points
- Multiple growth contribution: -4.6%-points
- Dividends: +0.4%-points
In short, the year-to-date return is almost entirely on the back of rising profit expectations, which have more than offset multiple contractions. The forward P/E is now at 21.1x, down from 22.2x at the end of 2025.
Profit growth itself can be separated into two pieces: sales growth + margin expansion.
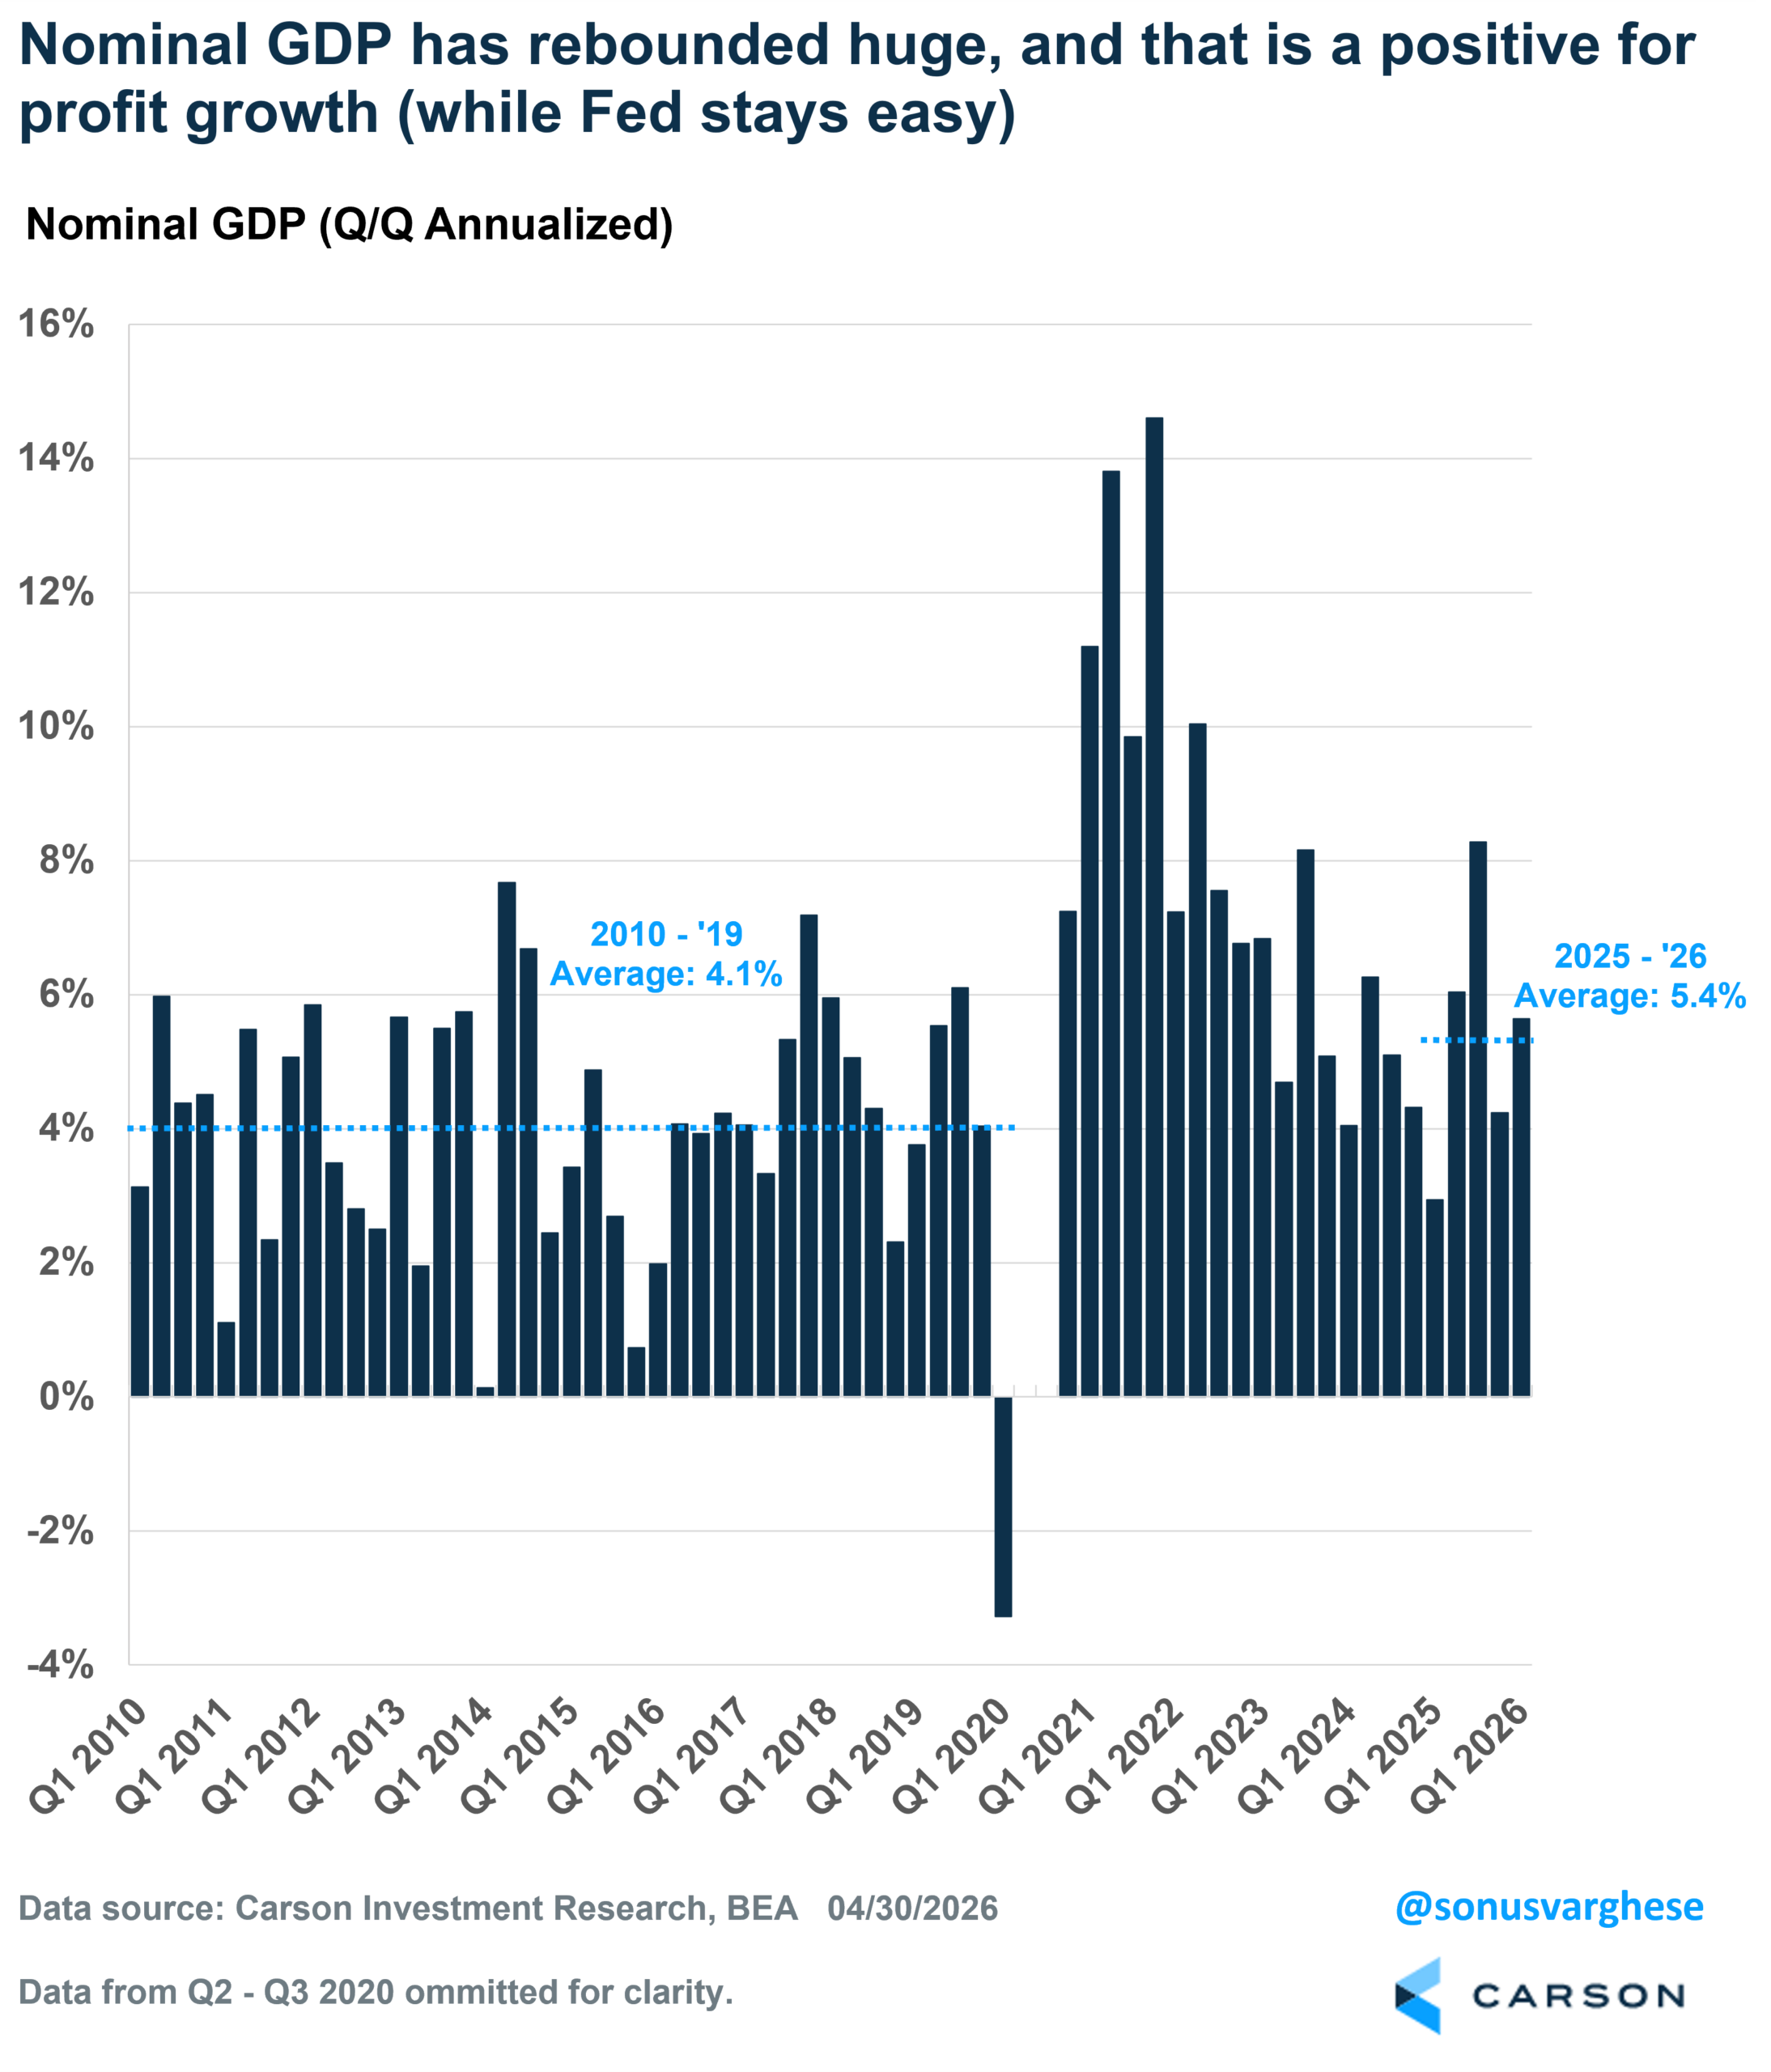
Sales growth is closely tied to nominal GDP growth — as long as we don’t have a recession, sales growth should run fairly strong. Nominal GDP growth surged at a 5.6% annualized pace in Q1 and has averaged about 5.4% over the past five quarters. This is well above the 2010-2019 trend of 4.1% growth. Expect this to continue going forward.
Sales growth was strong even in 2022 (+8.5%) as nominal GDP growth clocked in around 8% for the year. But EPS growth was weak in 2022 (+3.8%) because of a pullback in margins amid surging interest rates. However, margins have expanded a lot over the last three years. Forward margins were around 12% at the end of 2019 and had expanded to 12.7% by the end of 2022. Since then, margins have expanded to 14.5% by the end of 2025, a new all-time high. And they’ve increased even more to 15.2% over the first four months of 2026.
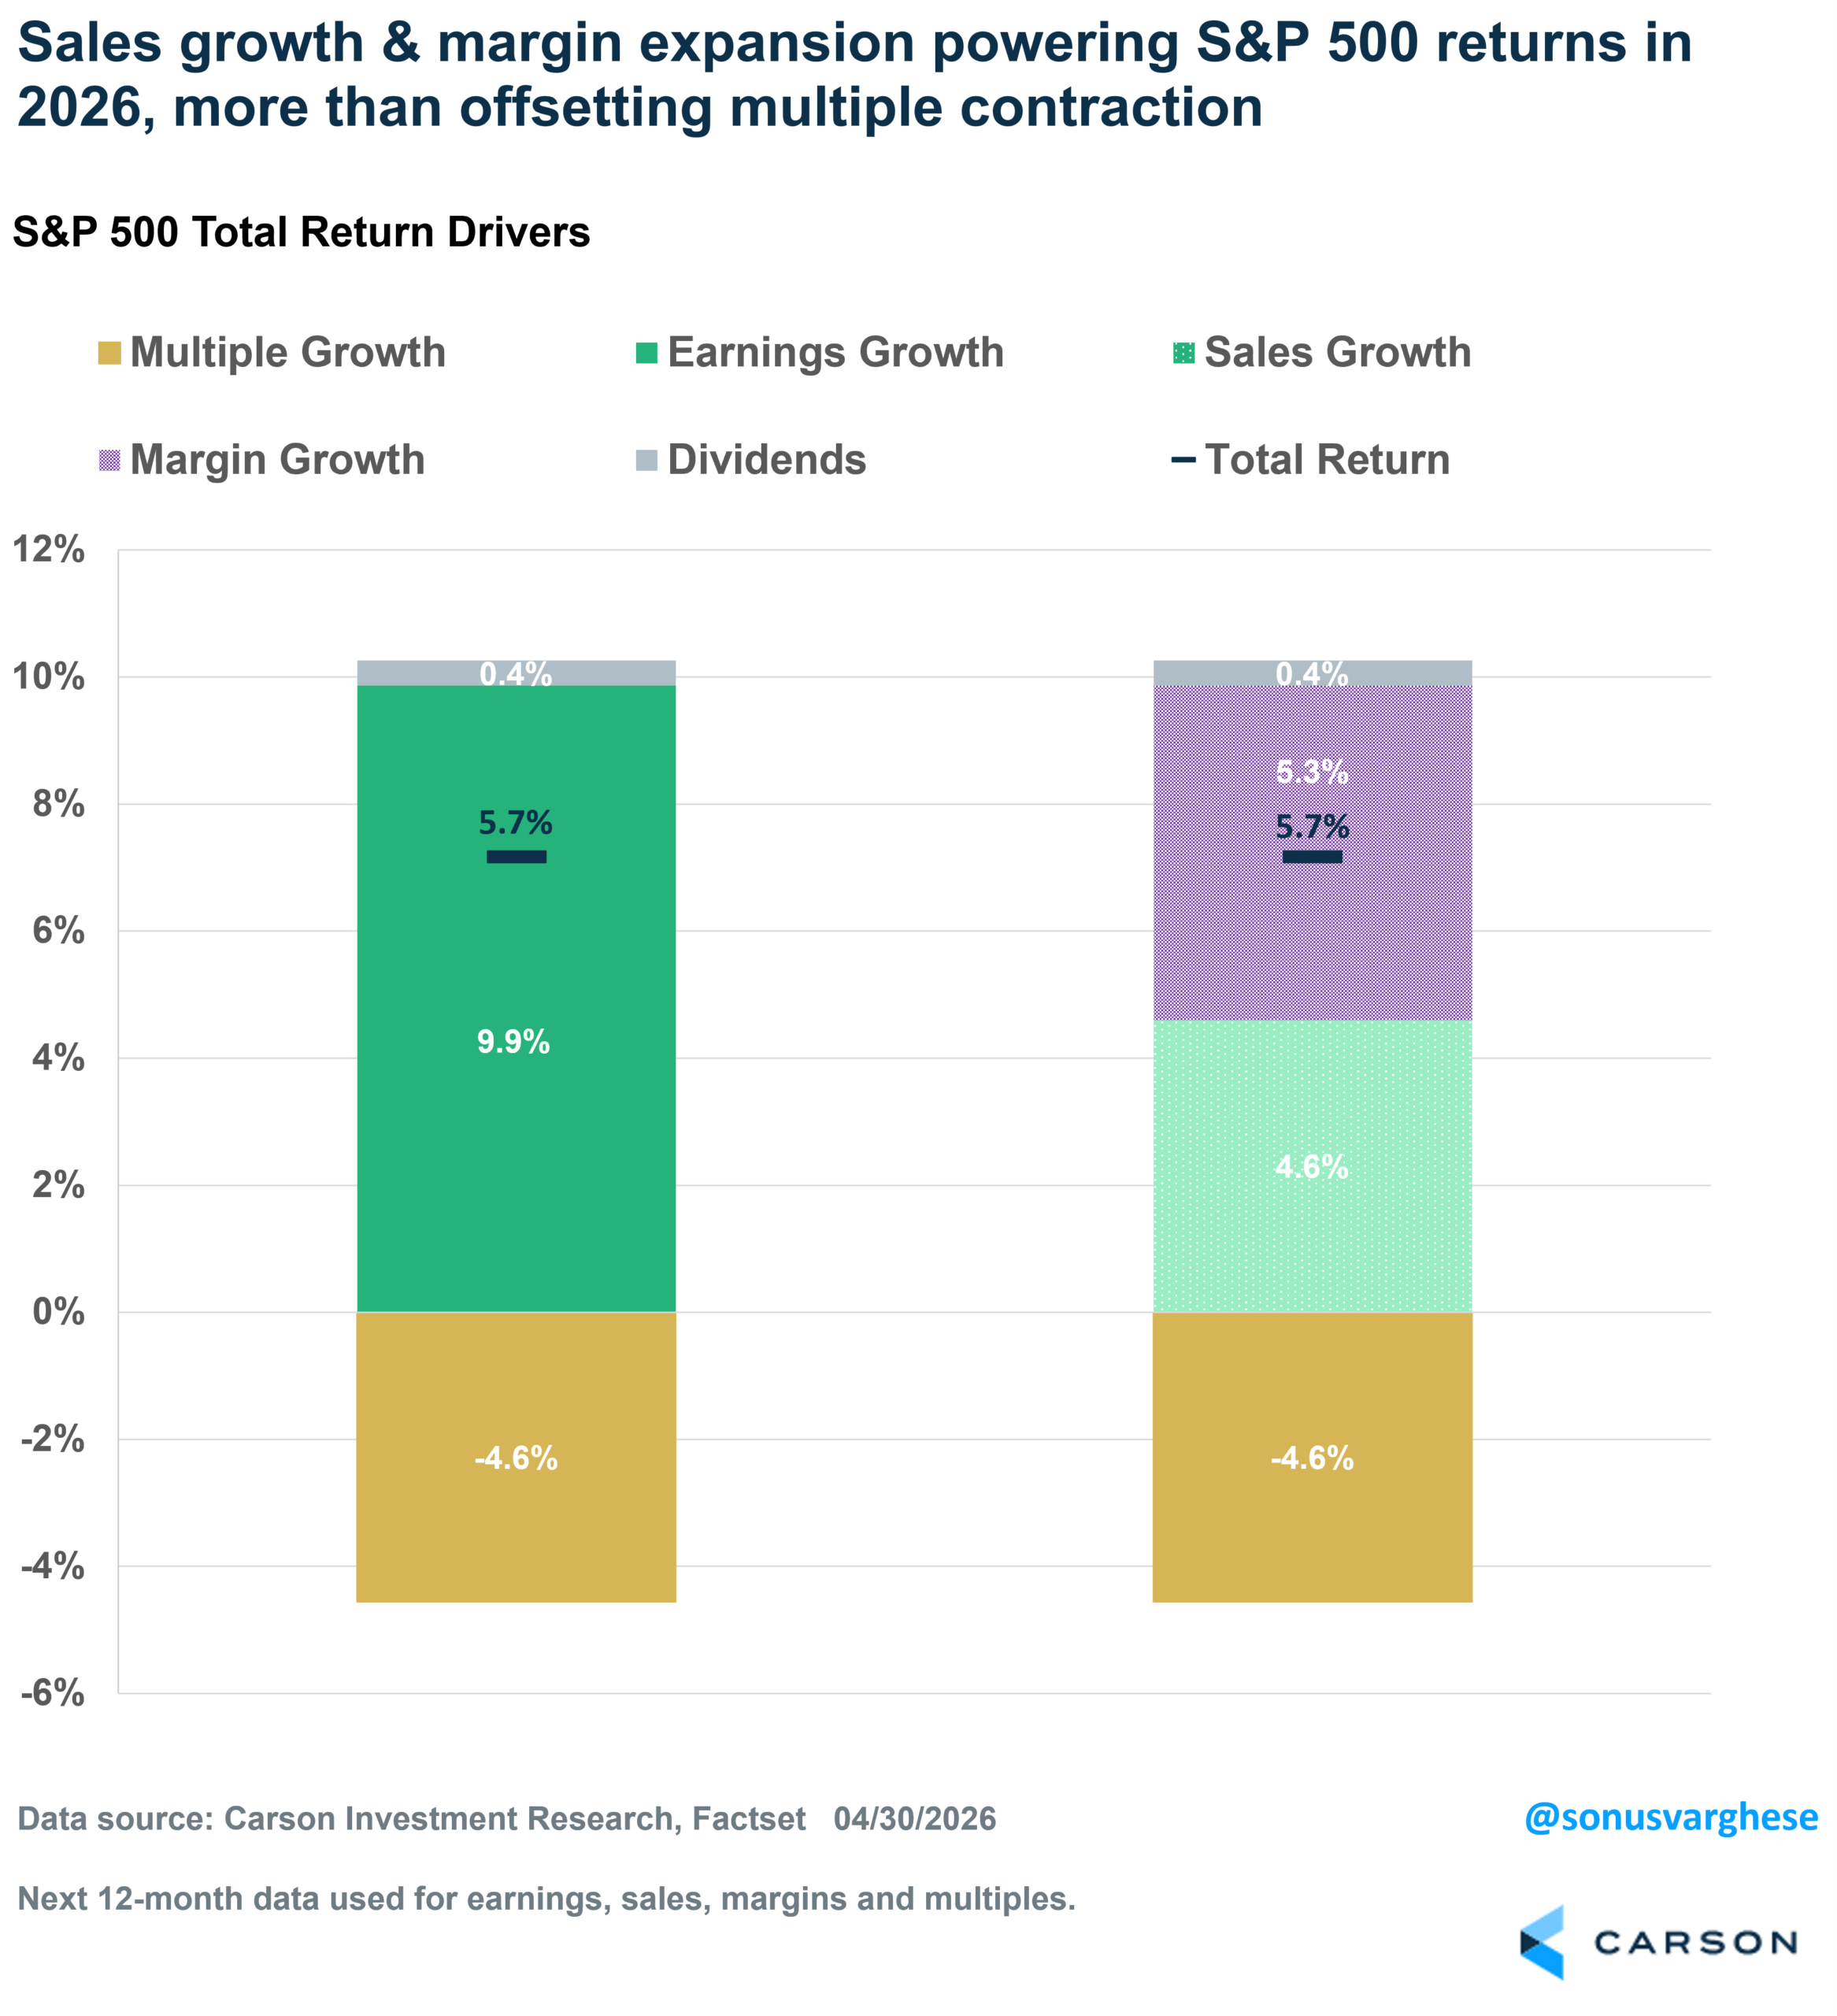
Here’s a look at how this has actually helped S&P 500 returns year to date. I break down EPS growth into sales and margins. As I noted above, the S&P 500 is up 5.7 % year to date. Here’s a breakdown of the contributions:
- Earnings growth: +9.9%-points
- Sales growth: +4.6%-points
- Margin expansion: +5.3%-points
- Multiple growth: -4.6%-points
- Dividends: +0.4%-points
What this is saying is that profit margin expansion (expected) is the biggest driver of profit growth so far in 2026, even more so than sales growth expectations.
In fact, the above chart showing return drivers for the S&P 500 explains what’s happened this year, and why the index is at an all-time high despite a major crisis in the Middle East.
- The primary driver of the year-to-date return is margin expansion, but the other side of this is inflation.
- Sales growth is strong on the back of strong nominal GDP growth (5-6%), but that’s on the back of inflation rather than real GDP growth (which is likely to run below trend for a second straight year).
- Multiple contractions have been a drag on returns, as markets price in fewer rate cuts and a relatively less dovish Fed amid higher inflation.
Too many commentators are making the mistake of translating an inflation surge into weaker real consumption, and hence weaker economic growth and profit growth. But as we can see, inflation also means margins are rising, and that’s driving profit expectations higher.
We expect the AI wave to continue supporting the stock market, even as inflation remains elevated. Looking ahead, a Federal Reserve that is led by Kevin Warsh is likely to hold rates unchanged for the rest of the year. However, with inflation moving in the wrong direction, that means policy is getting more dovish. Couple that with rising fiscal deficits and the policy environment is supportive of “running it hot,” with nominal GDP growth continuing to clock in around 5-6%. For now, that’s another potential tailwind for stocks.
For more content by Sonu Varghese, Chief Macro Strategist, click here.
8907249.1. – 1MAY26A