
“Life is like riding a bicycle. To keep your balance you must keep moving.” Albert Einstein
Three long streaks ended yesterday and in today’s blog we will take a closer look at what it might mean. First off, I didn’t plan on writing this blog today. In fact, I had a longer blog all ready to go that was going to look some things to consider as we head into 2026. But due to the weakness yesterday, I’ve pushed that one back to Friday. For now, enjoy this one.
A Long Time Near Highs Is Over
First up, the government opened up after a record 45 days last Wednesday night and all the stock market has done is fall three days in a row. I’m not sure about you, but if this continues, I’m for closing it up again.
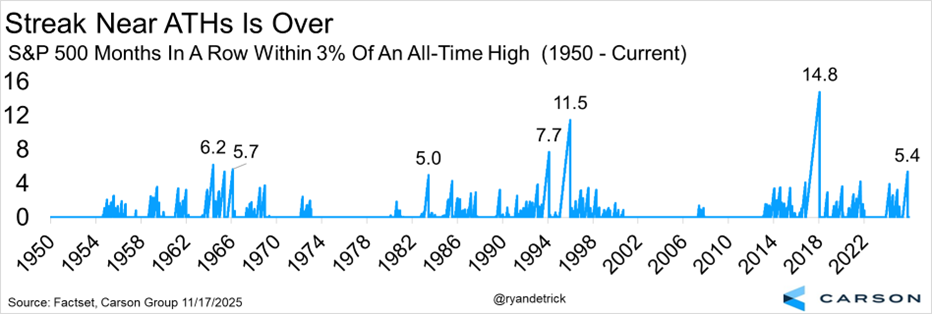
In the midst of the three-day losing streak, the S&P 500 finally closed more than 3% away from the all-time high for the first time since June 5. That is more than five months in a row of closing near an all-time high, one of the longest streaks ever.
Only seven other times in history has the S&P 500 gone five months or more near all-time highs. Incredibly, the record was nearly 15 months, which started right after the election in November 2016. The bottom line is a streak like this was due to end at any time. Although it could usher in potentially more near-term volatility, we don’t think it is the start to a longer period of overall weakness.
So Much for Liking Monday
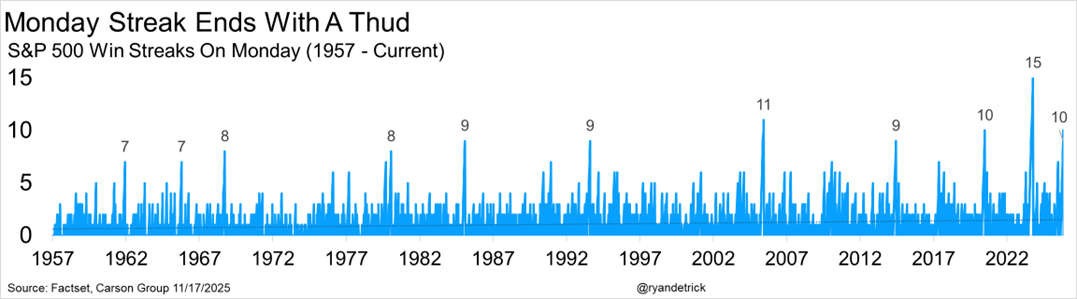
Monday closed higher an incredible 10 weeks in a row until yesterday’s rough day. We’ve discussed this a lot on Facts vs Feelings the past few weeks and our explanation is bad news has come out late in the week, then over the weekend (usually Sunday) some good news would come out to push stocks higher. This one was due to end eventually and we don’t think this says much other than it was good while it lasted.
Stay on Top of Market Trends
The Carson Investment Research newsletter offers up-to-date market news, analysis and insights. Subscribe today!
"*" indicates required fields
Houston, We Have A 50-Day Moving Average Break
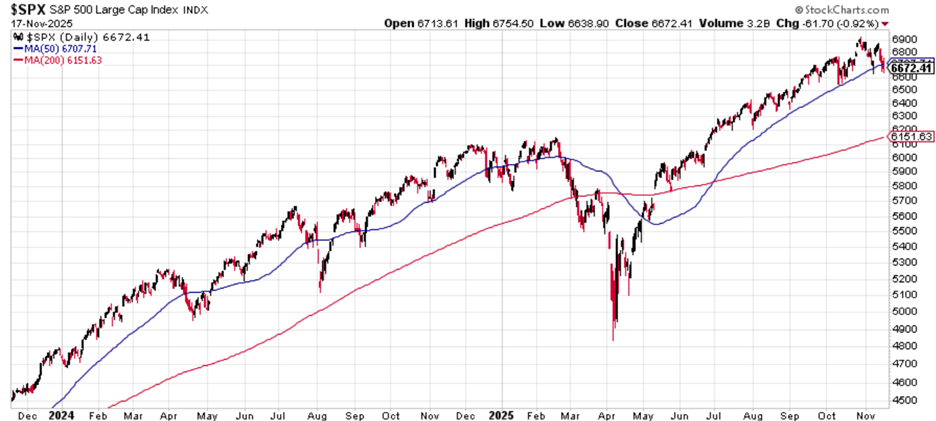
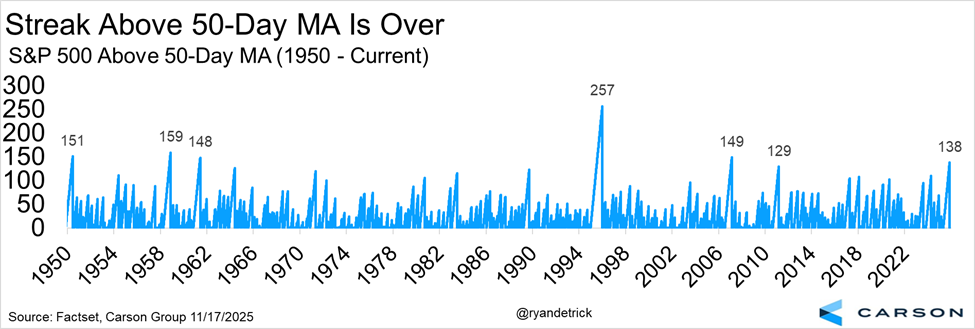
Along these same lines, the S&P 500 closed beneath its 50-day moving average for the first time in 138 trading days (or more than six months). It broke this level the past two Fridays before late rallies helped it close above it, but it finally gave way yesterday. Below is a nice chart that shows the 50-day average crossover, but I think the clear upward bias to the longer-term 200-day moving average is more important and suggests the overall trend remains strong.
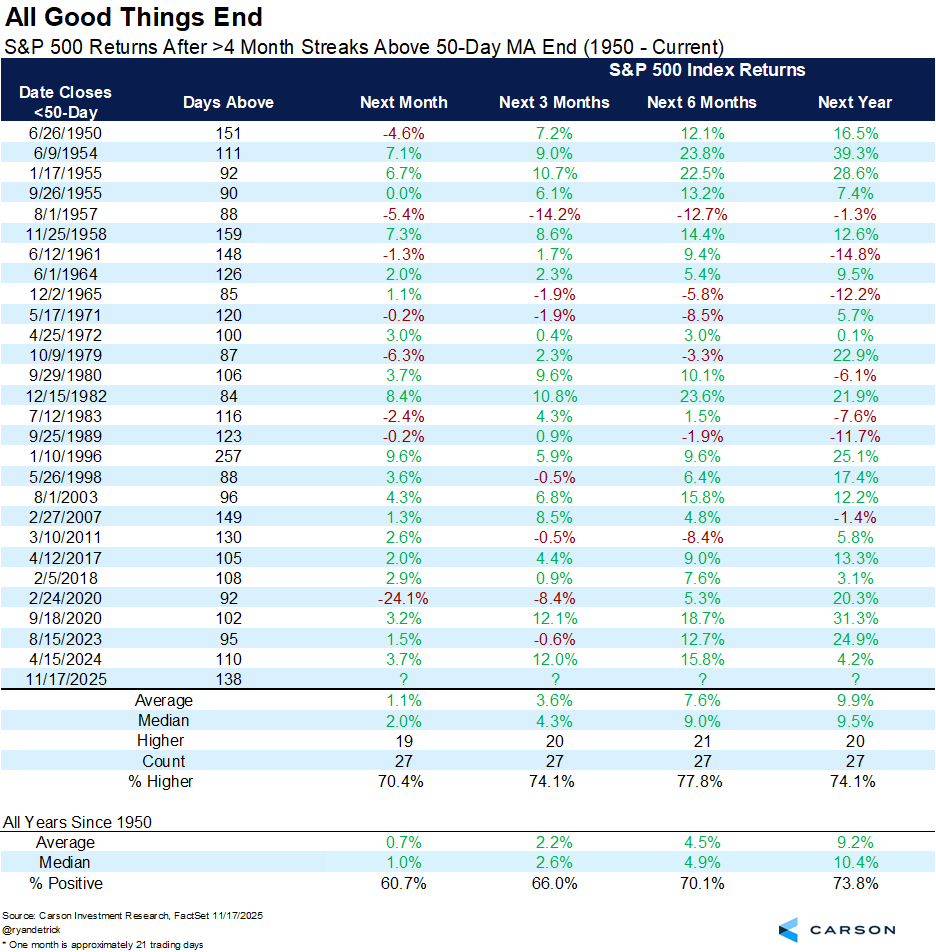
Here are all the previous streaks that lasted at least four months and how stocks did after that initial 50-day moving average break. Much better than average and the median return going out six months is surprising, while the return a year later is about your average year. In other words, this doesn’t appear to be a bearish trigger.
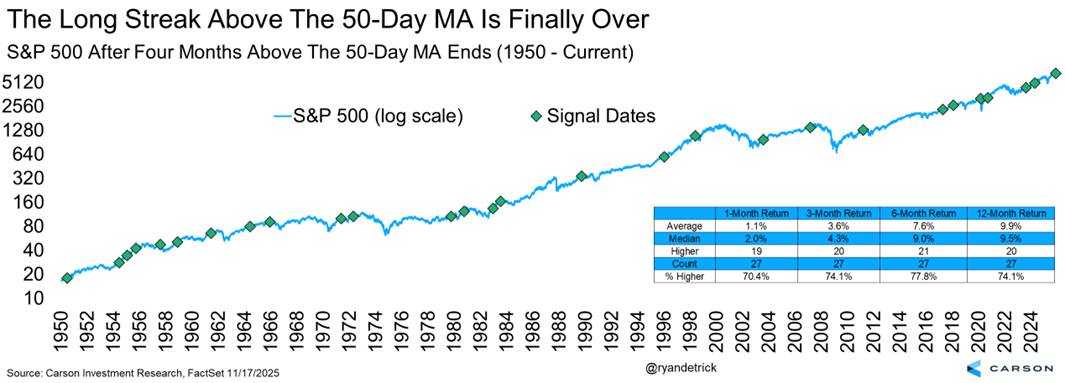
Here’s the same data as above, but on a chart of the S&P 500. Again, just eyeballing these previous long streaks and it doesn’t appear to be overly bearish when the long streaks finally break.
What About November?
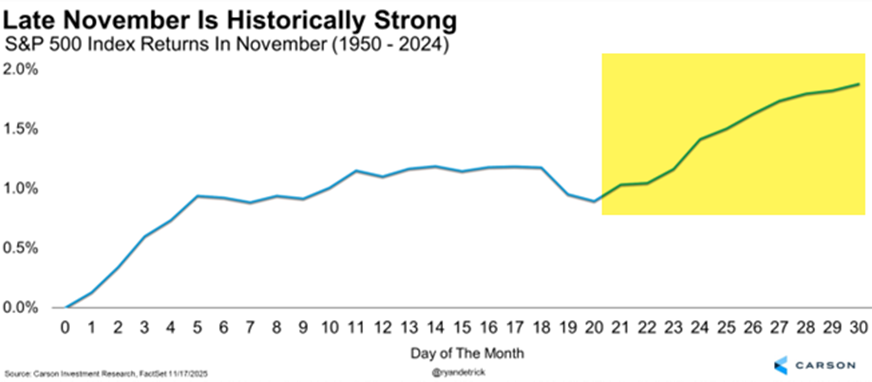
After a historic rally off the April lows, some type of early November volatility isn’t a big surprise, but it is never fun when it happens. Yes, we are still optimistic that we will see more new highs before 2025 is over and a year-end rally, but what about the rest of November? Don’t forget that the last part of November is historically one of the most bullish times of the year and call me old fashioned, but I think we could be due for better times this time around again.
Thanks as always for reading and just remember that this too shall pass. For more of our team’s thoughts on the current state of things, I was honored to join my friend Caleb Silver, Editor-In Chief at Investopedia, for the Investopedia Express podcast. Oh, and the one and only Sonu Varghese, VP, Global Macro Strategist joined in on the fun. Check it out below
Investopedia is not affiliated with CWM, LLC. Opinions expressed by this individual may not be representative of CWM, LLC.
For more content by Ryan Detrick, Chief Market Strategist click here
8615267.1.-18NOV25A
