Headline GDP growth in the first quarter disappointed, but as I pointed out yesterday, underlying growth was actually quite strong. The good news is that the cyclical areas of the economy, namely housing activity and business investment, are seeing strong growth despite the hurdle of higher interest rates. That’s really icing on the cake.
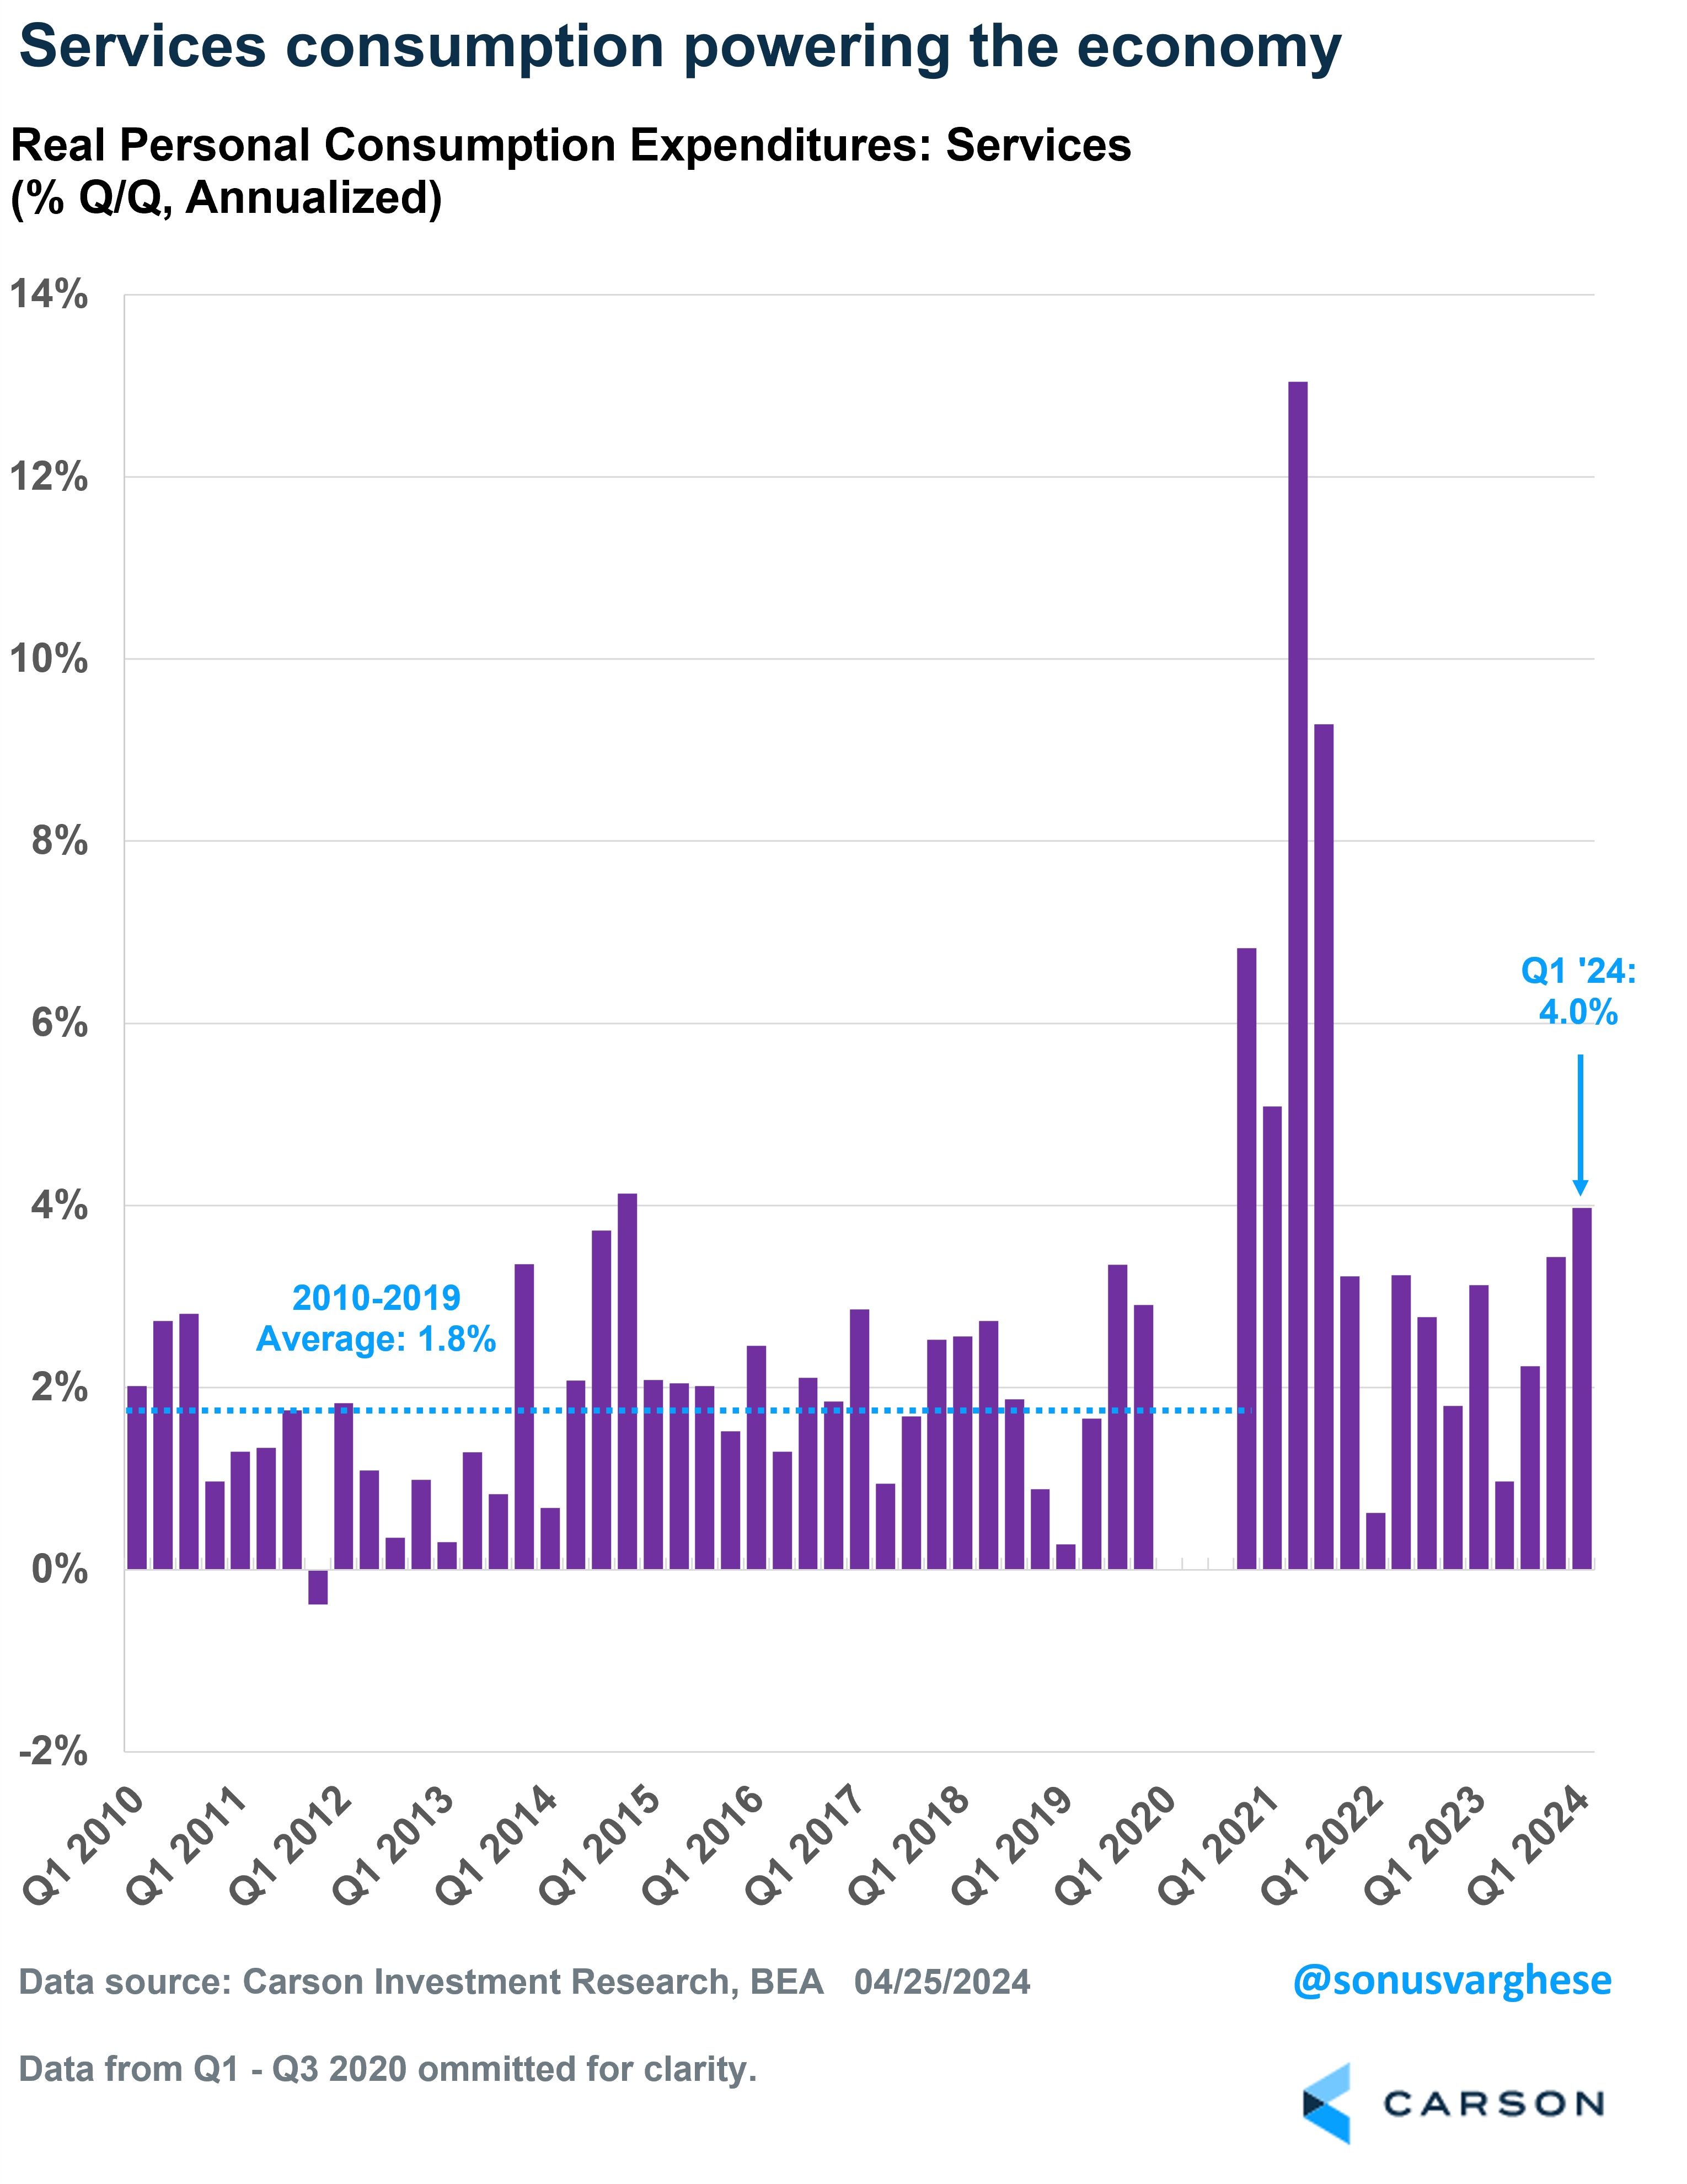
The workhorse of the US economy remains the consumer, and there’s really not much sign of a slowdown as far as household spending is concerned. In fact, services spending, which makes up 45% of the economy (more than twice as large as goods spending) rose at an annualized pace of 4% — above the 2010-2019 trend of 1.8%, and the fastest pace in since the third quarter of 2021. Back in 2021, strong services spending was driven by everyone rushing out to spend once Covid looked to be in the background. That’s not the case now. The current strength of consumption is directly related to the strength of American household finances. Let’s walk through these.
Incomes Are Growing Faster than Inflation
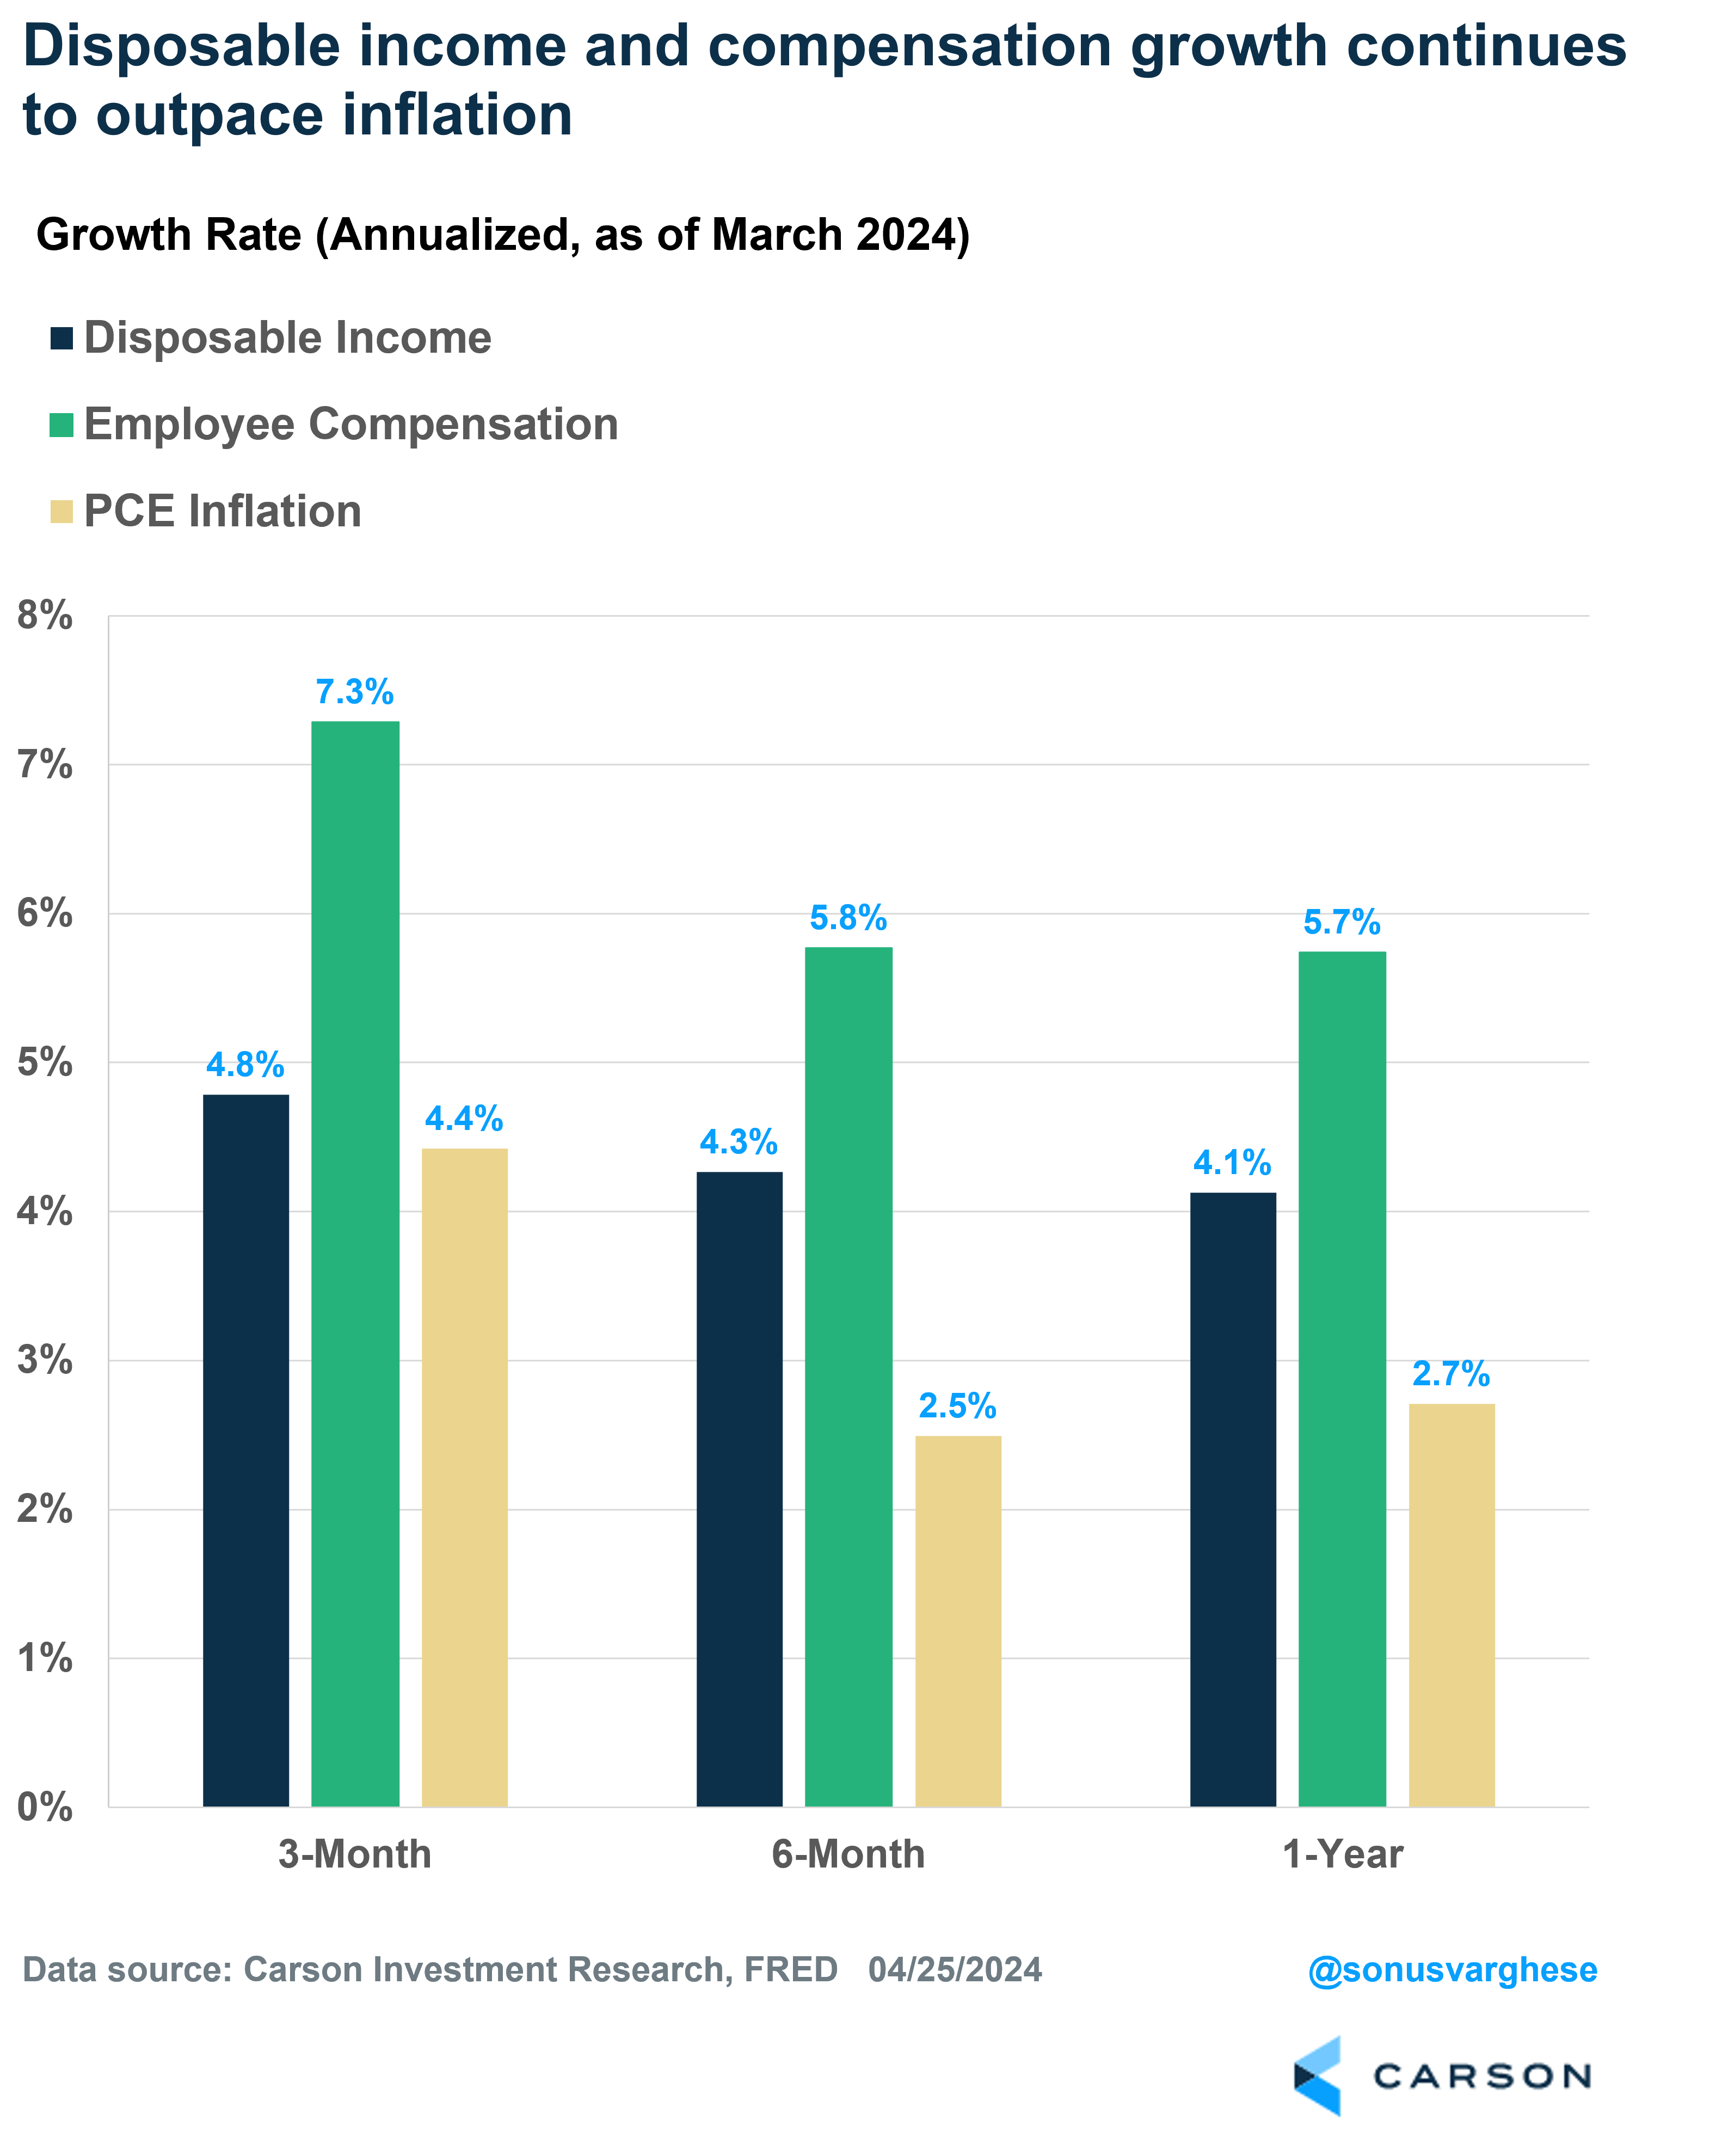
There’s no question that inflation ran hot in the first quarter, which is a setback after the downtrend in the second half of 2023. The Federal Reserve’s preferred inflation metric, the personal consumption expenditures index, rose at an annualized pace of 4.4% in Q1. But here’s the big picture: income growth is outpacing inflation. Disposable incomes grew at an annualized pace of 4.8% in Q1, but that’s also being pulled lower by falling income from assets (like dividends). More importantly, employee compensation surged by 7.3%. That’s the simplest explanation for why consumption continues to run strong.
Average Hourly Wages Are Growing Faster Than Inflation
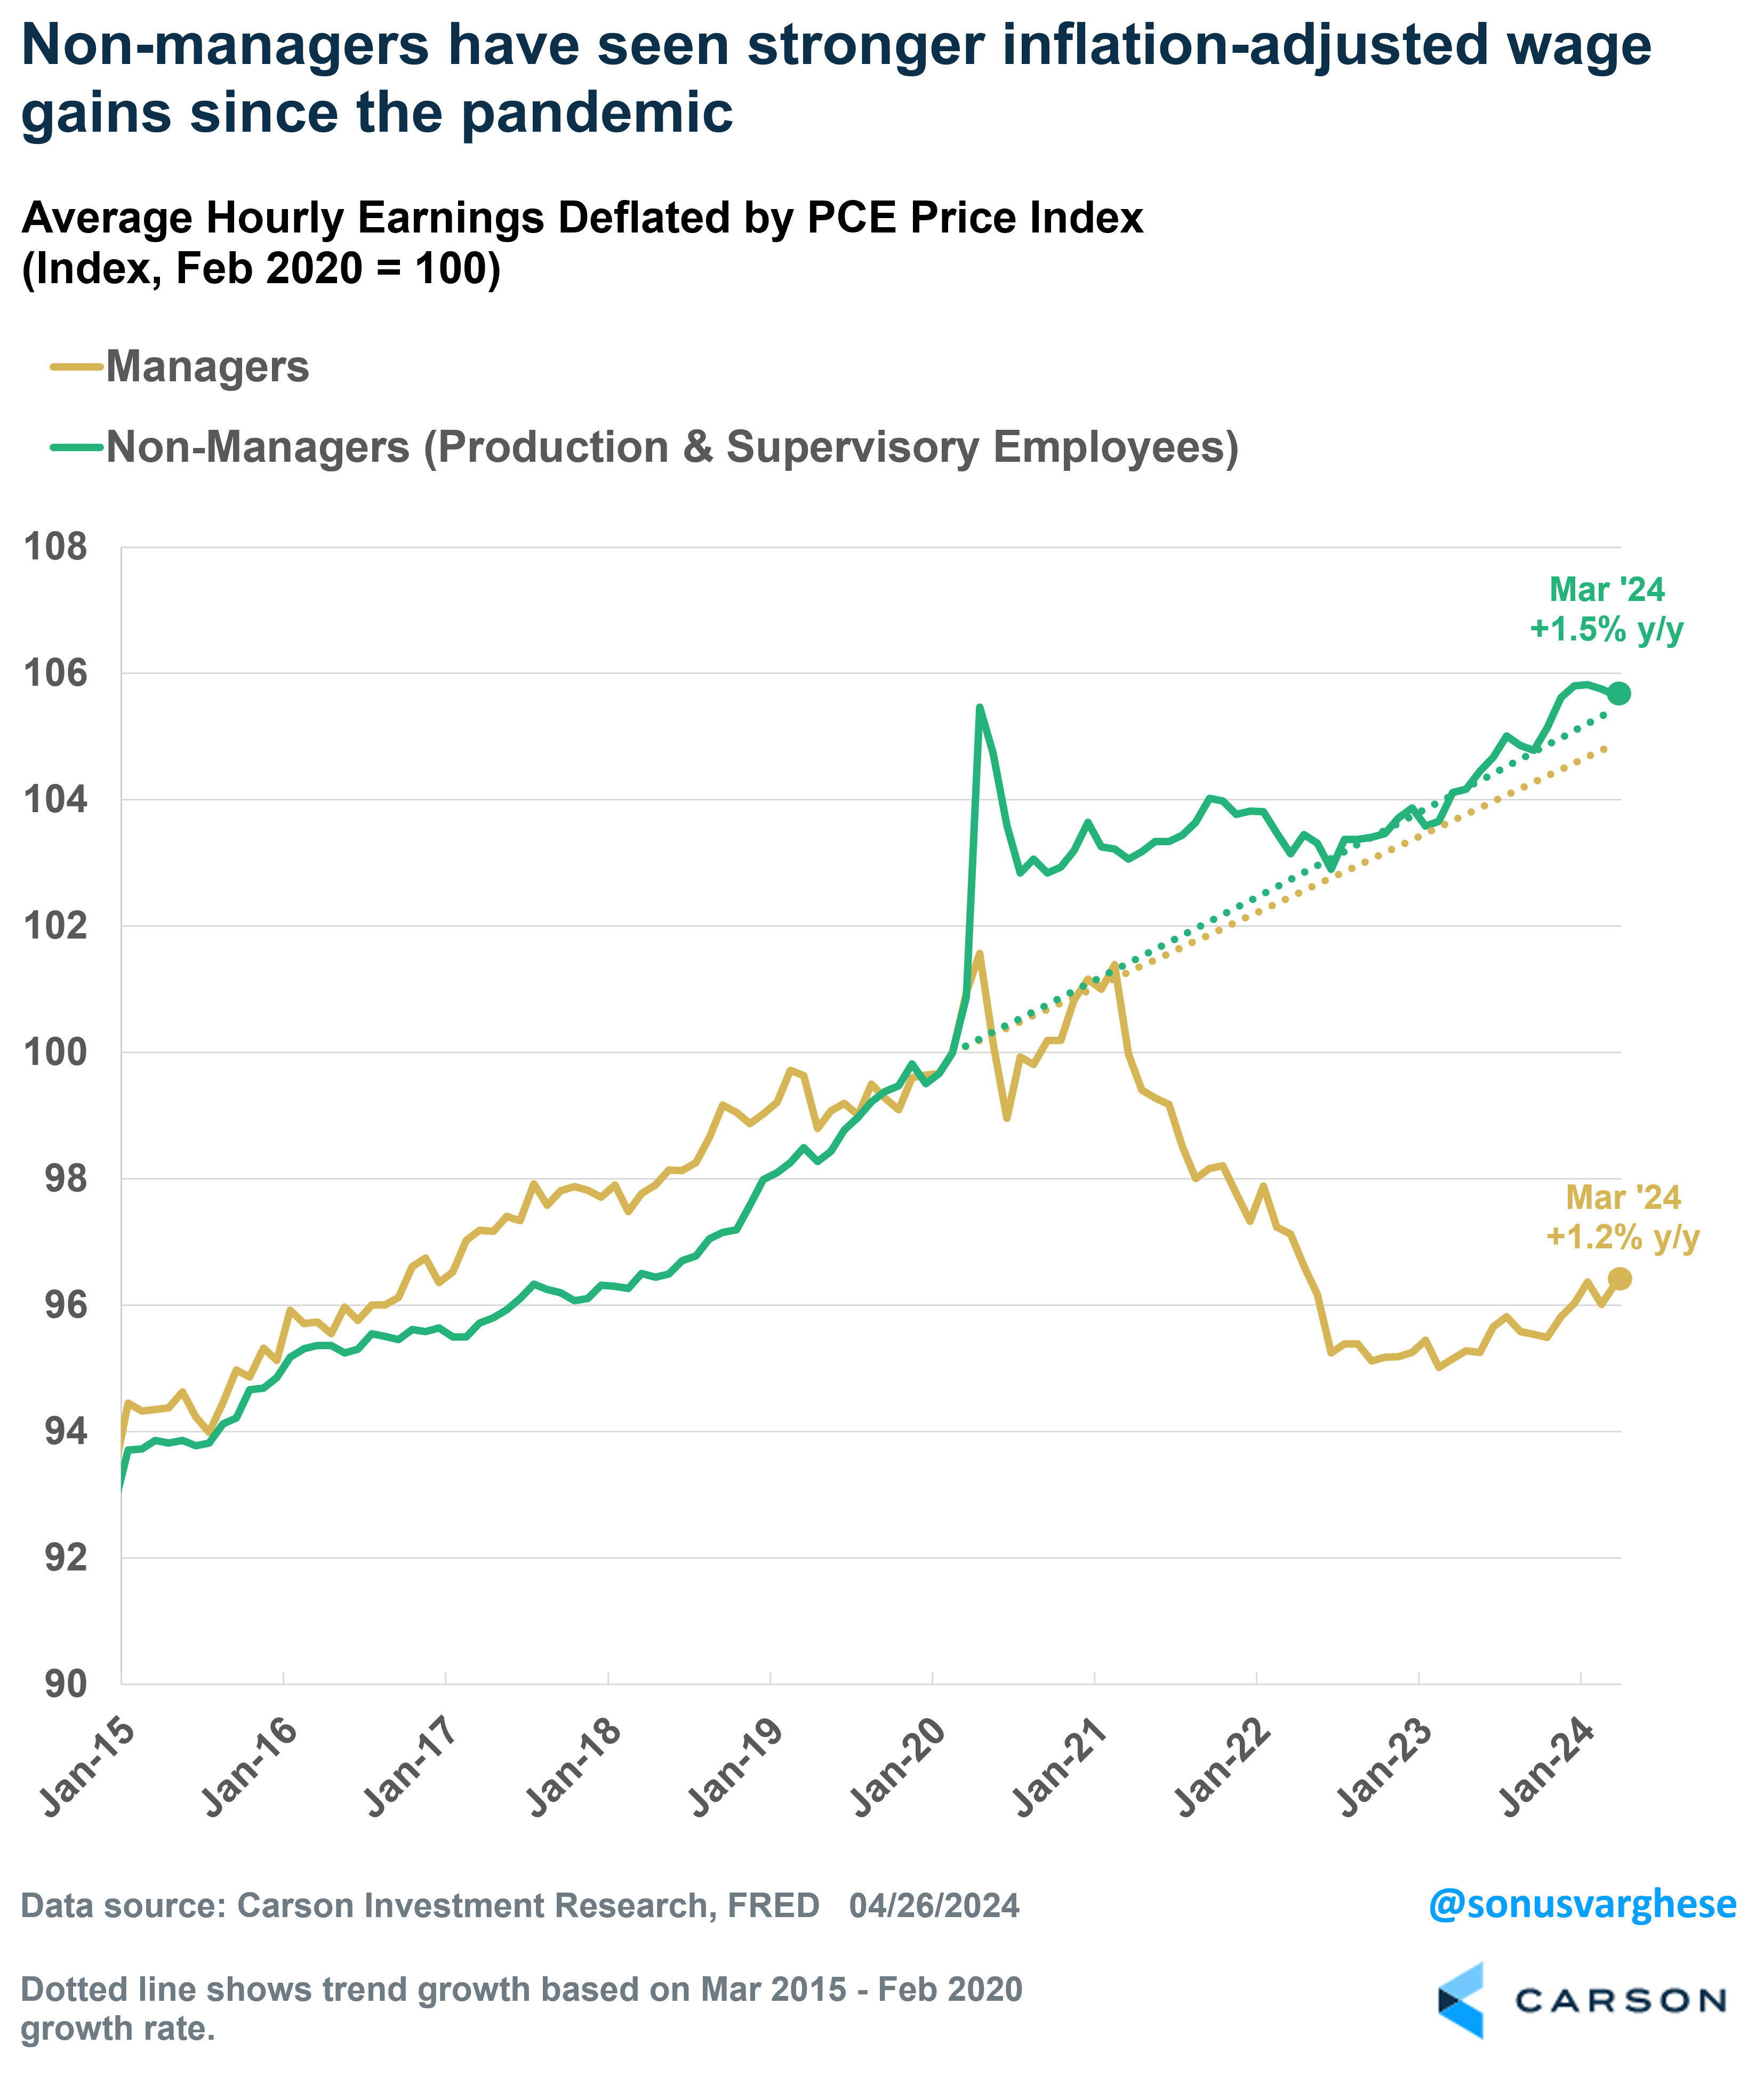
The charts above showed aggregate income growth, or total income across all workers, but that has been helped by an increase in the number of workers. However, inflation-adjusted hourly wages are growing even when you look at the average worker, and separate non-managers from managers. Since the pandemic started, average wages for non-managers have grown faster than the pre-pandemic trend, after adjusting for inflation (green line in the chart below). Over the last year it’s up 1.5%, above the pre-pandemic trend of 1.3%. Interestingly, wage growth for managers has fallen behind inflation since the pandemic, but the good news is that it’s been picking up recently, as the yellow line shows. Over the last year, inflation-adjusted wage growth for managers is up 1.2%, matching the pre-pandemic trend. Keep in mind that non-managers typically tend to spend a greater proportion of their incomes from wages.
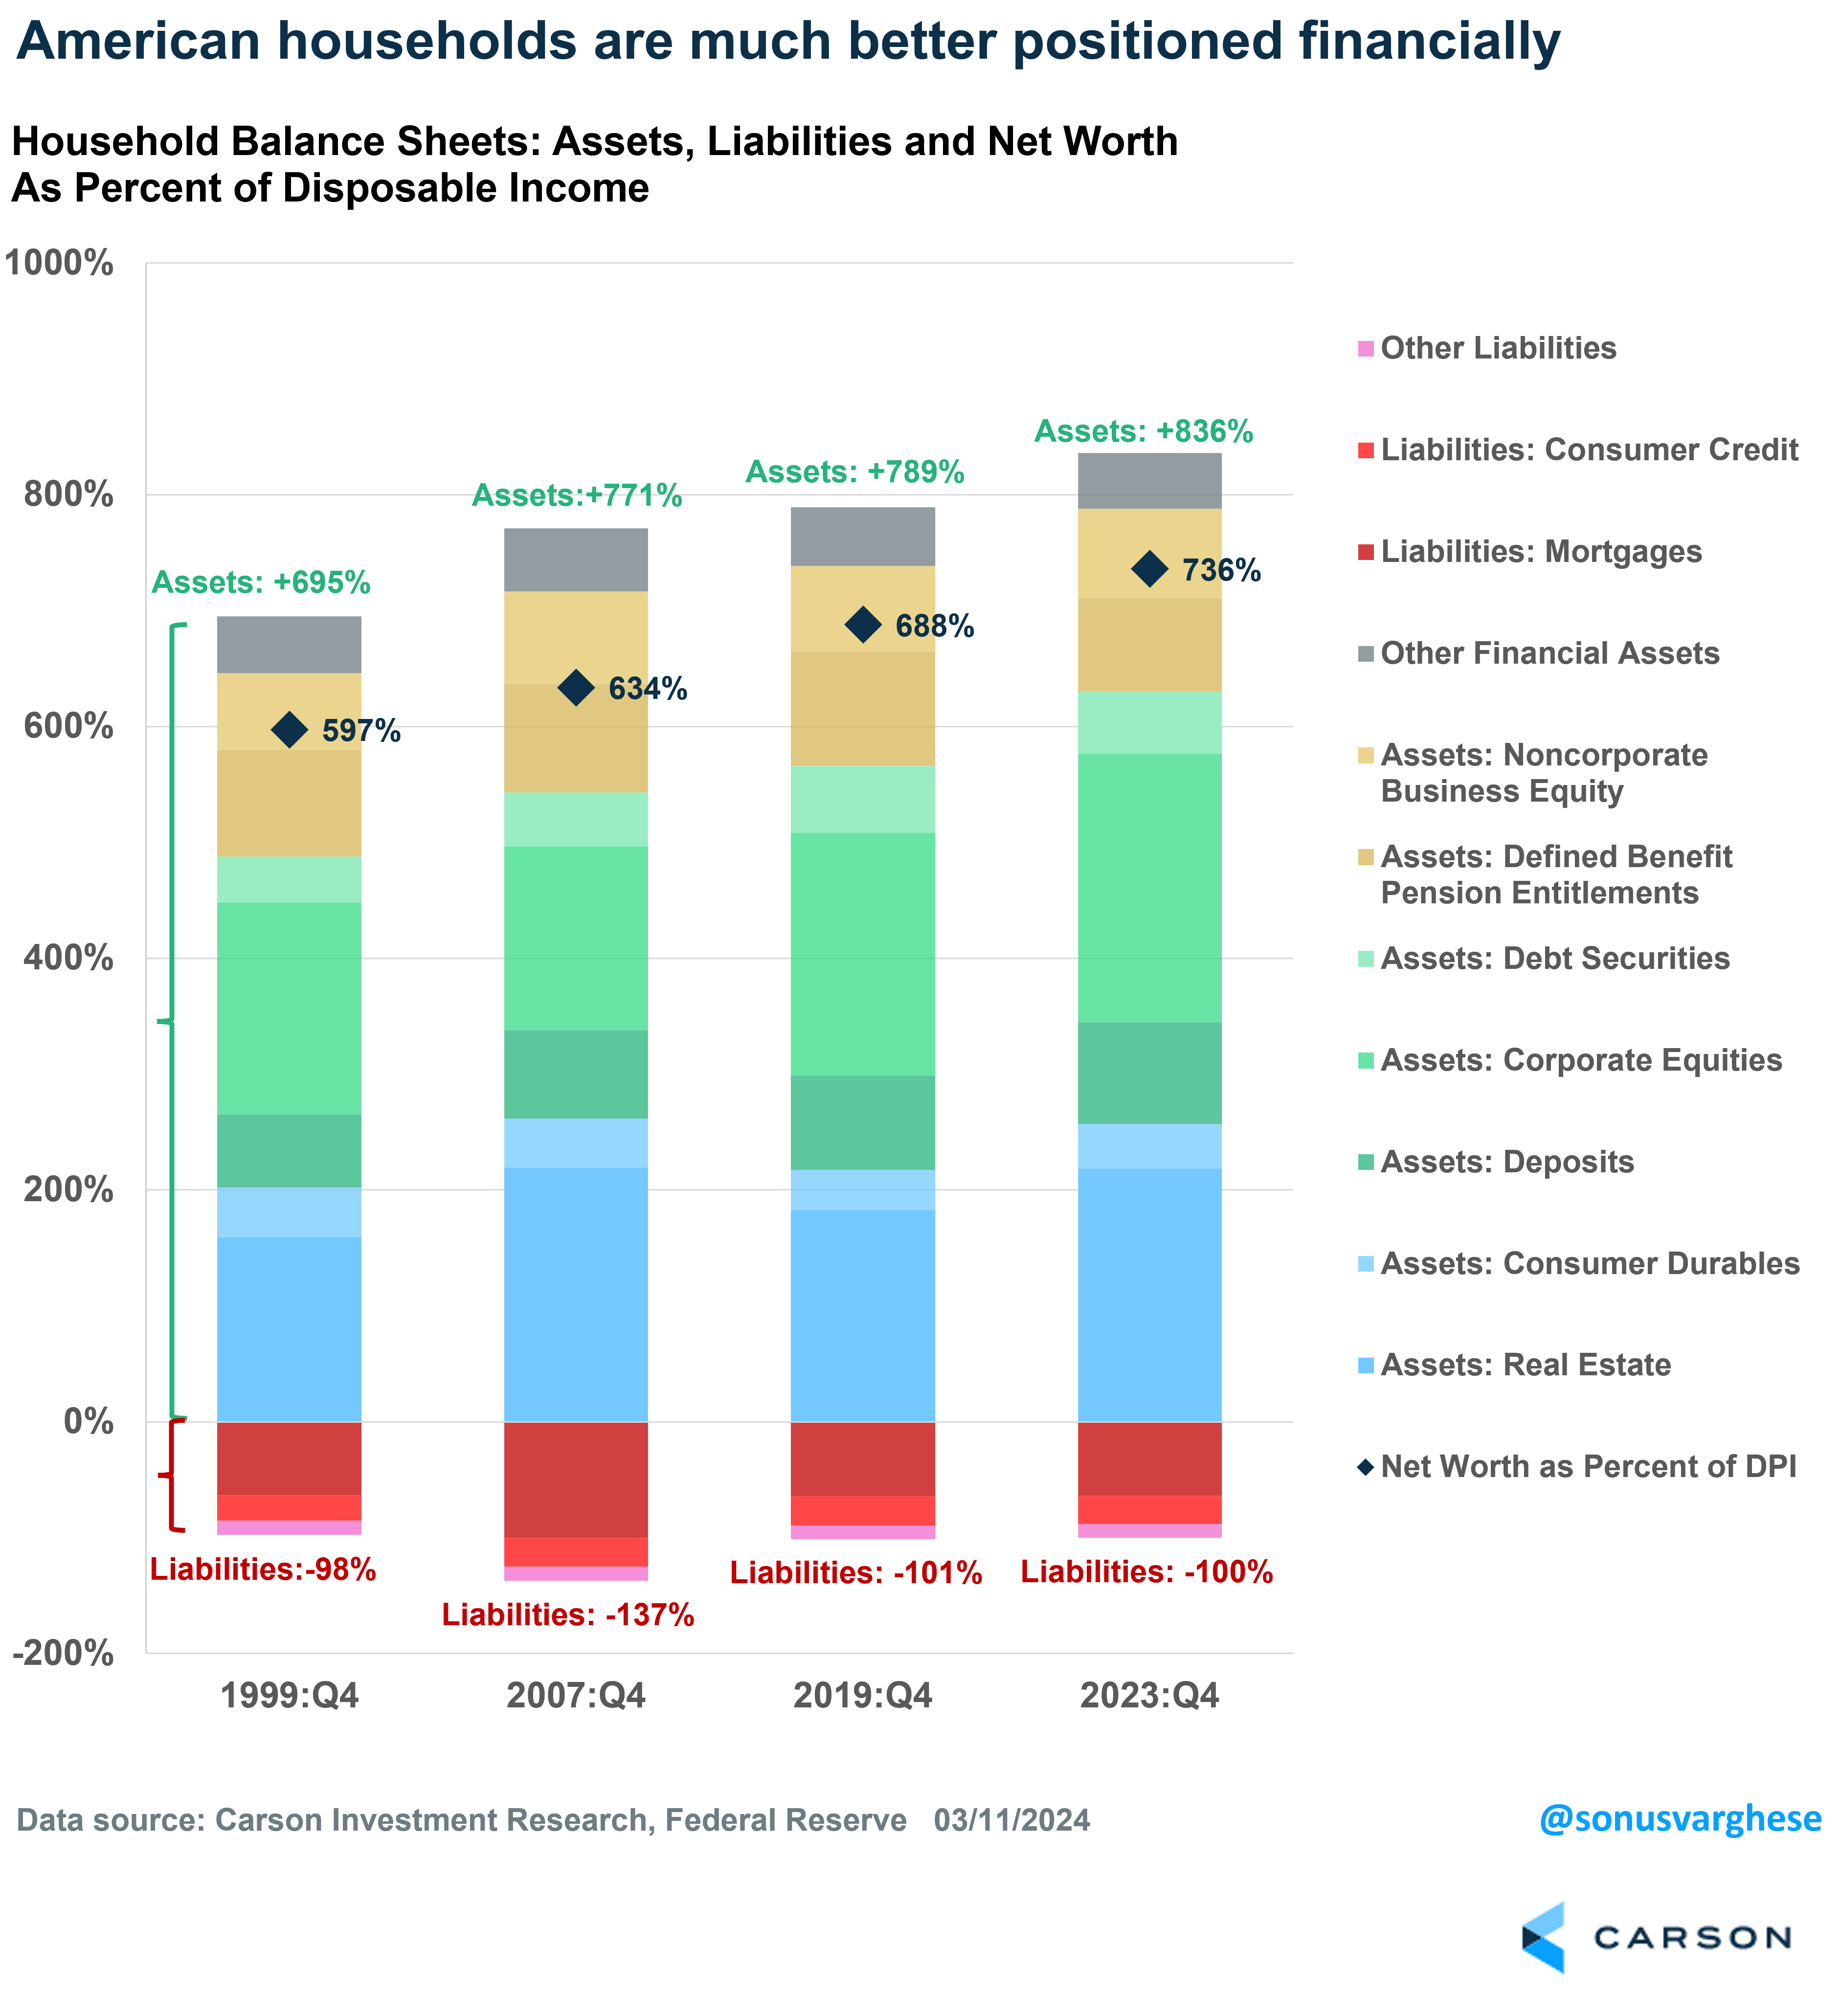
Household Balance Sheets Are Strong
Rising stock prices and home prices have resulted in more wealth for American households. At the same time, liabilities – especially mortgage debt, but also personal loans – have not increased at the same pace, especially relative to disposable income. At the end of 2023, household net worth was 736% of disposable incomes, well above historical levels. That’s on the back of asset values running at 836% of disposable income, even as liabilities stay at 100% of disposable income (in line with what we’ve seen in the past). This is a big reason why the savings rate has fallen since the pandemic. Savings rates averaged 7.4% in 2019, but it’s averaged 4.2% over the past year (through March). In fact, the savings rate has fallen from 5.2% in March 2023 to 3.2% last month. This is not surprising considering net worth is higher. Why save more if you’re worth more?
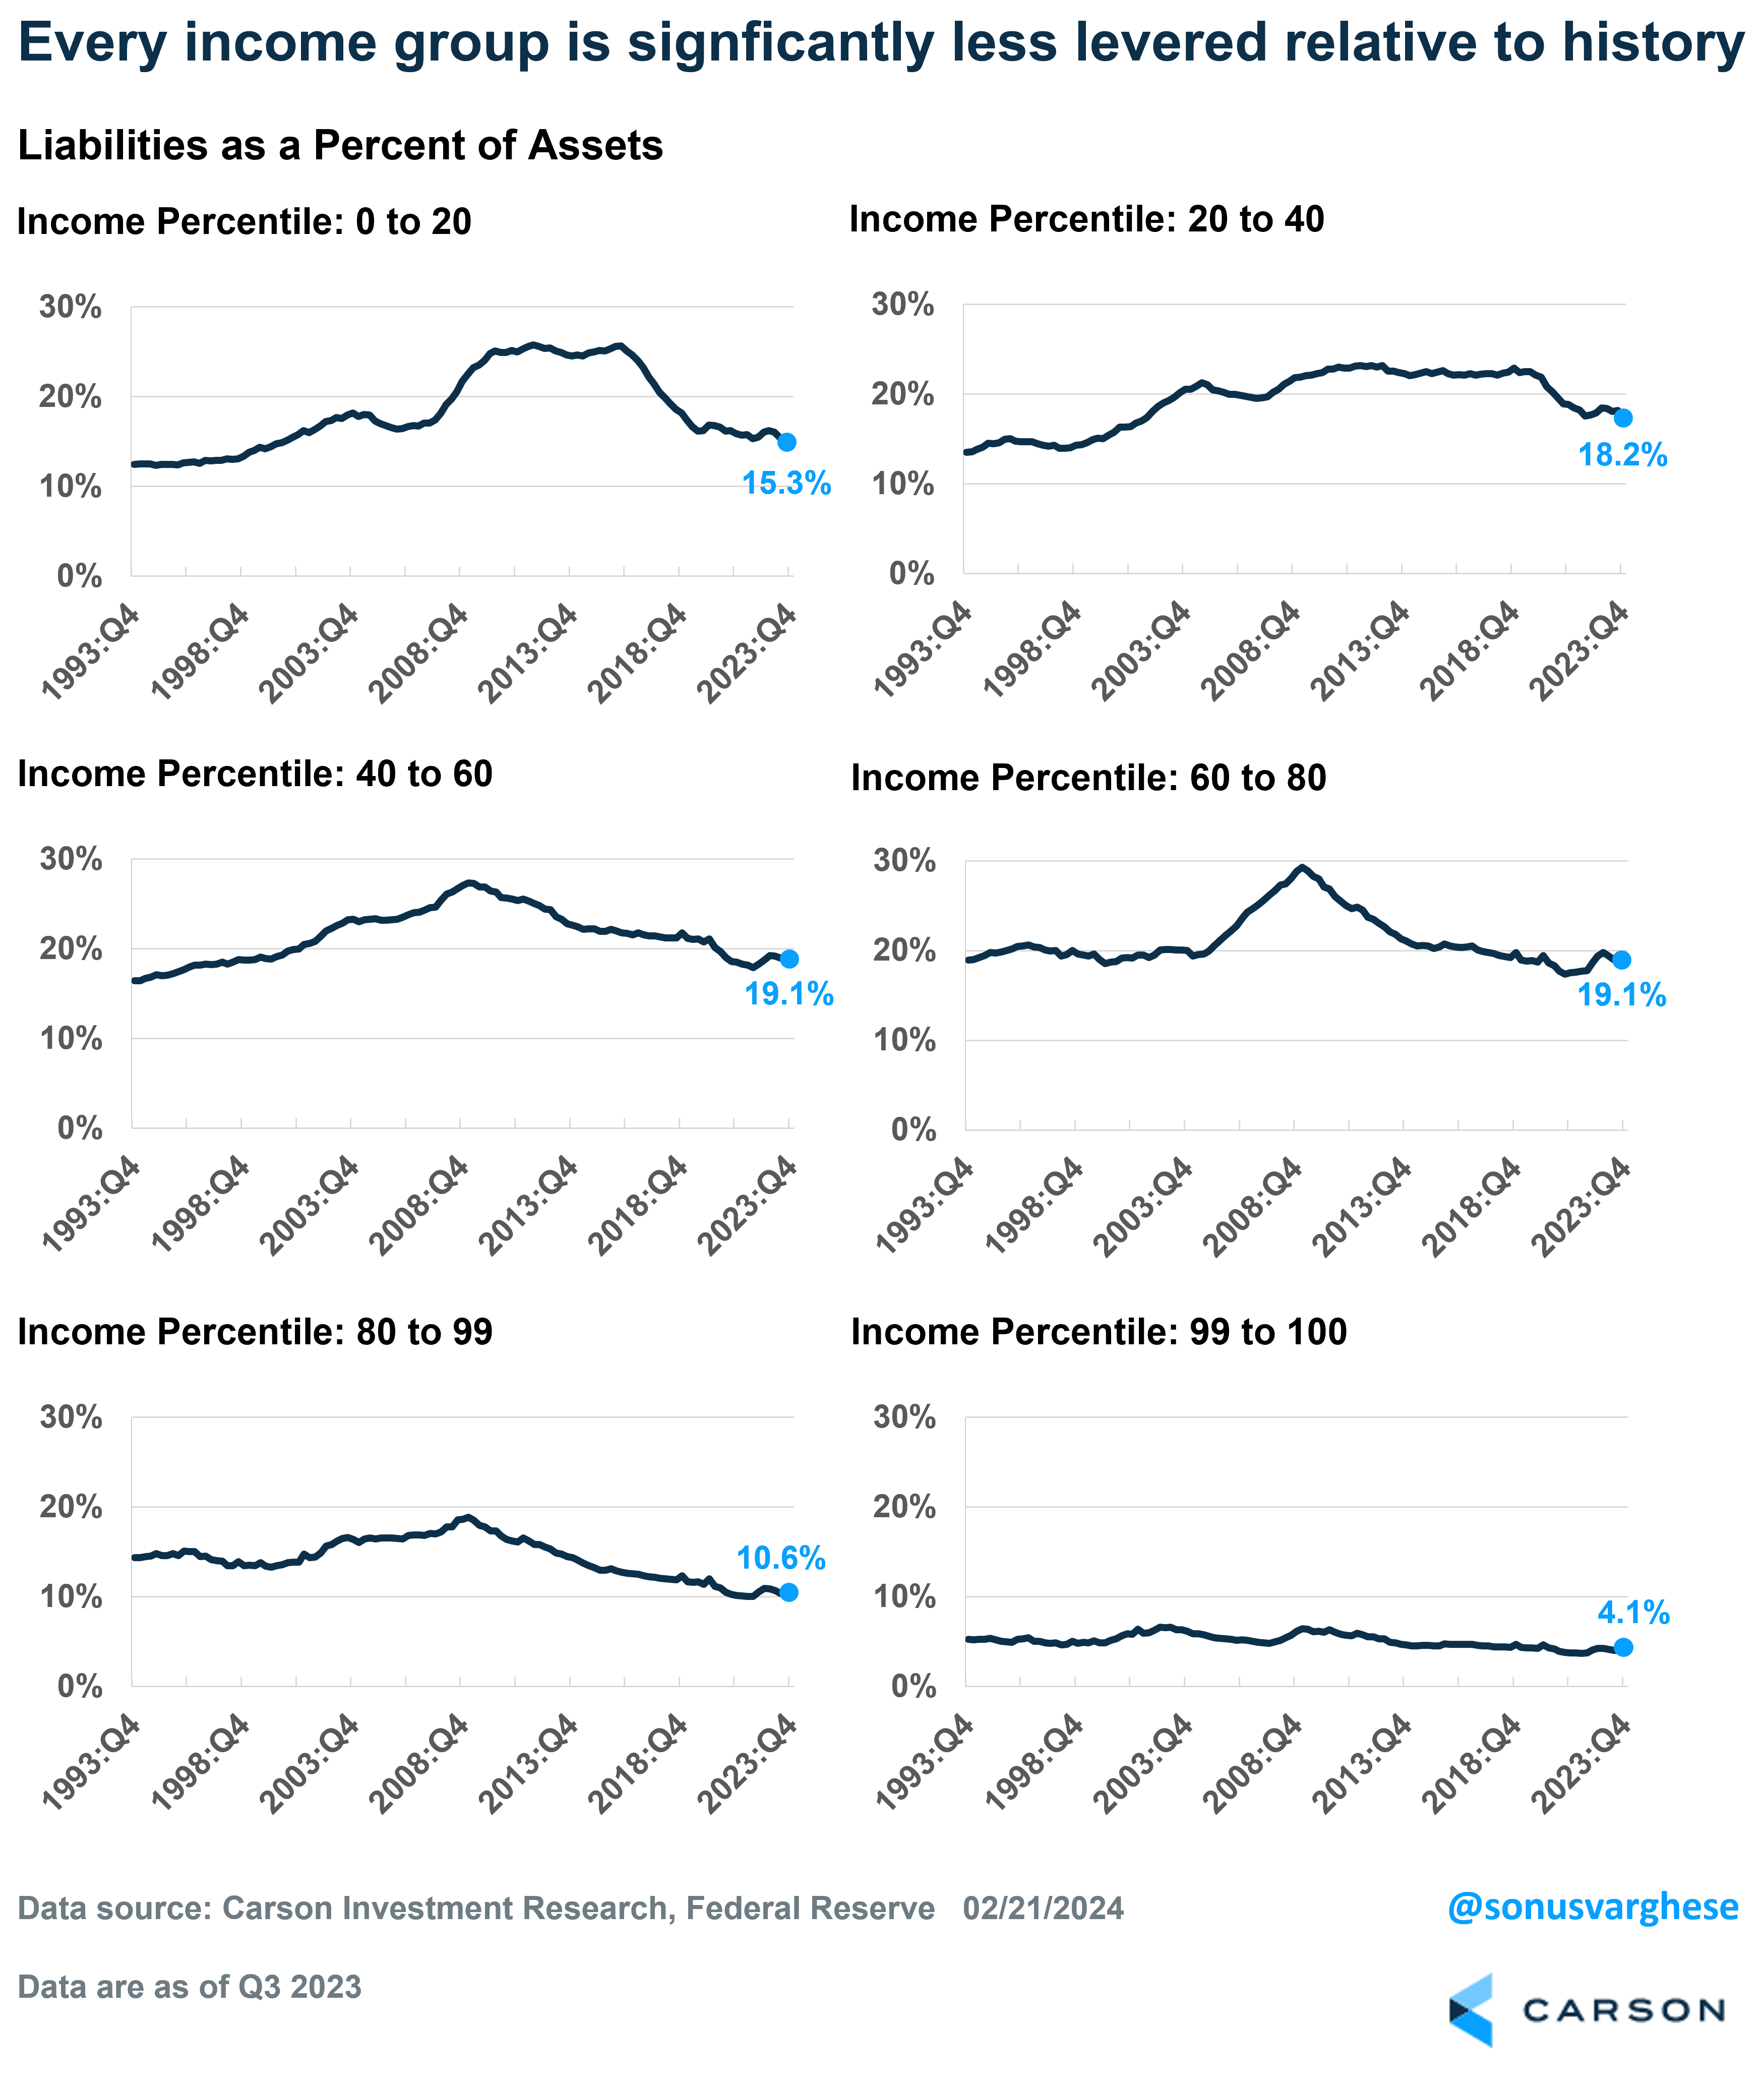
Households Are Far Less Leveraged
The chart above is on an aggregate basis, i.e. across all households in America. A typical question we get is, “How does the picture look outside of the wealthiest groups, considering we have a lot of inequality”. Turns out the picture looks good. Across all income groups, liabilities as a percent of assets are well below what we’ve seen historically. In short, households are significantly less levered than in the past.
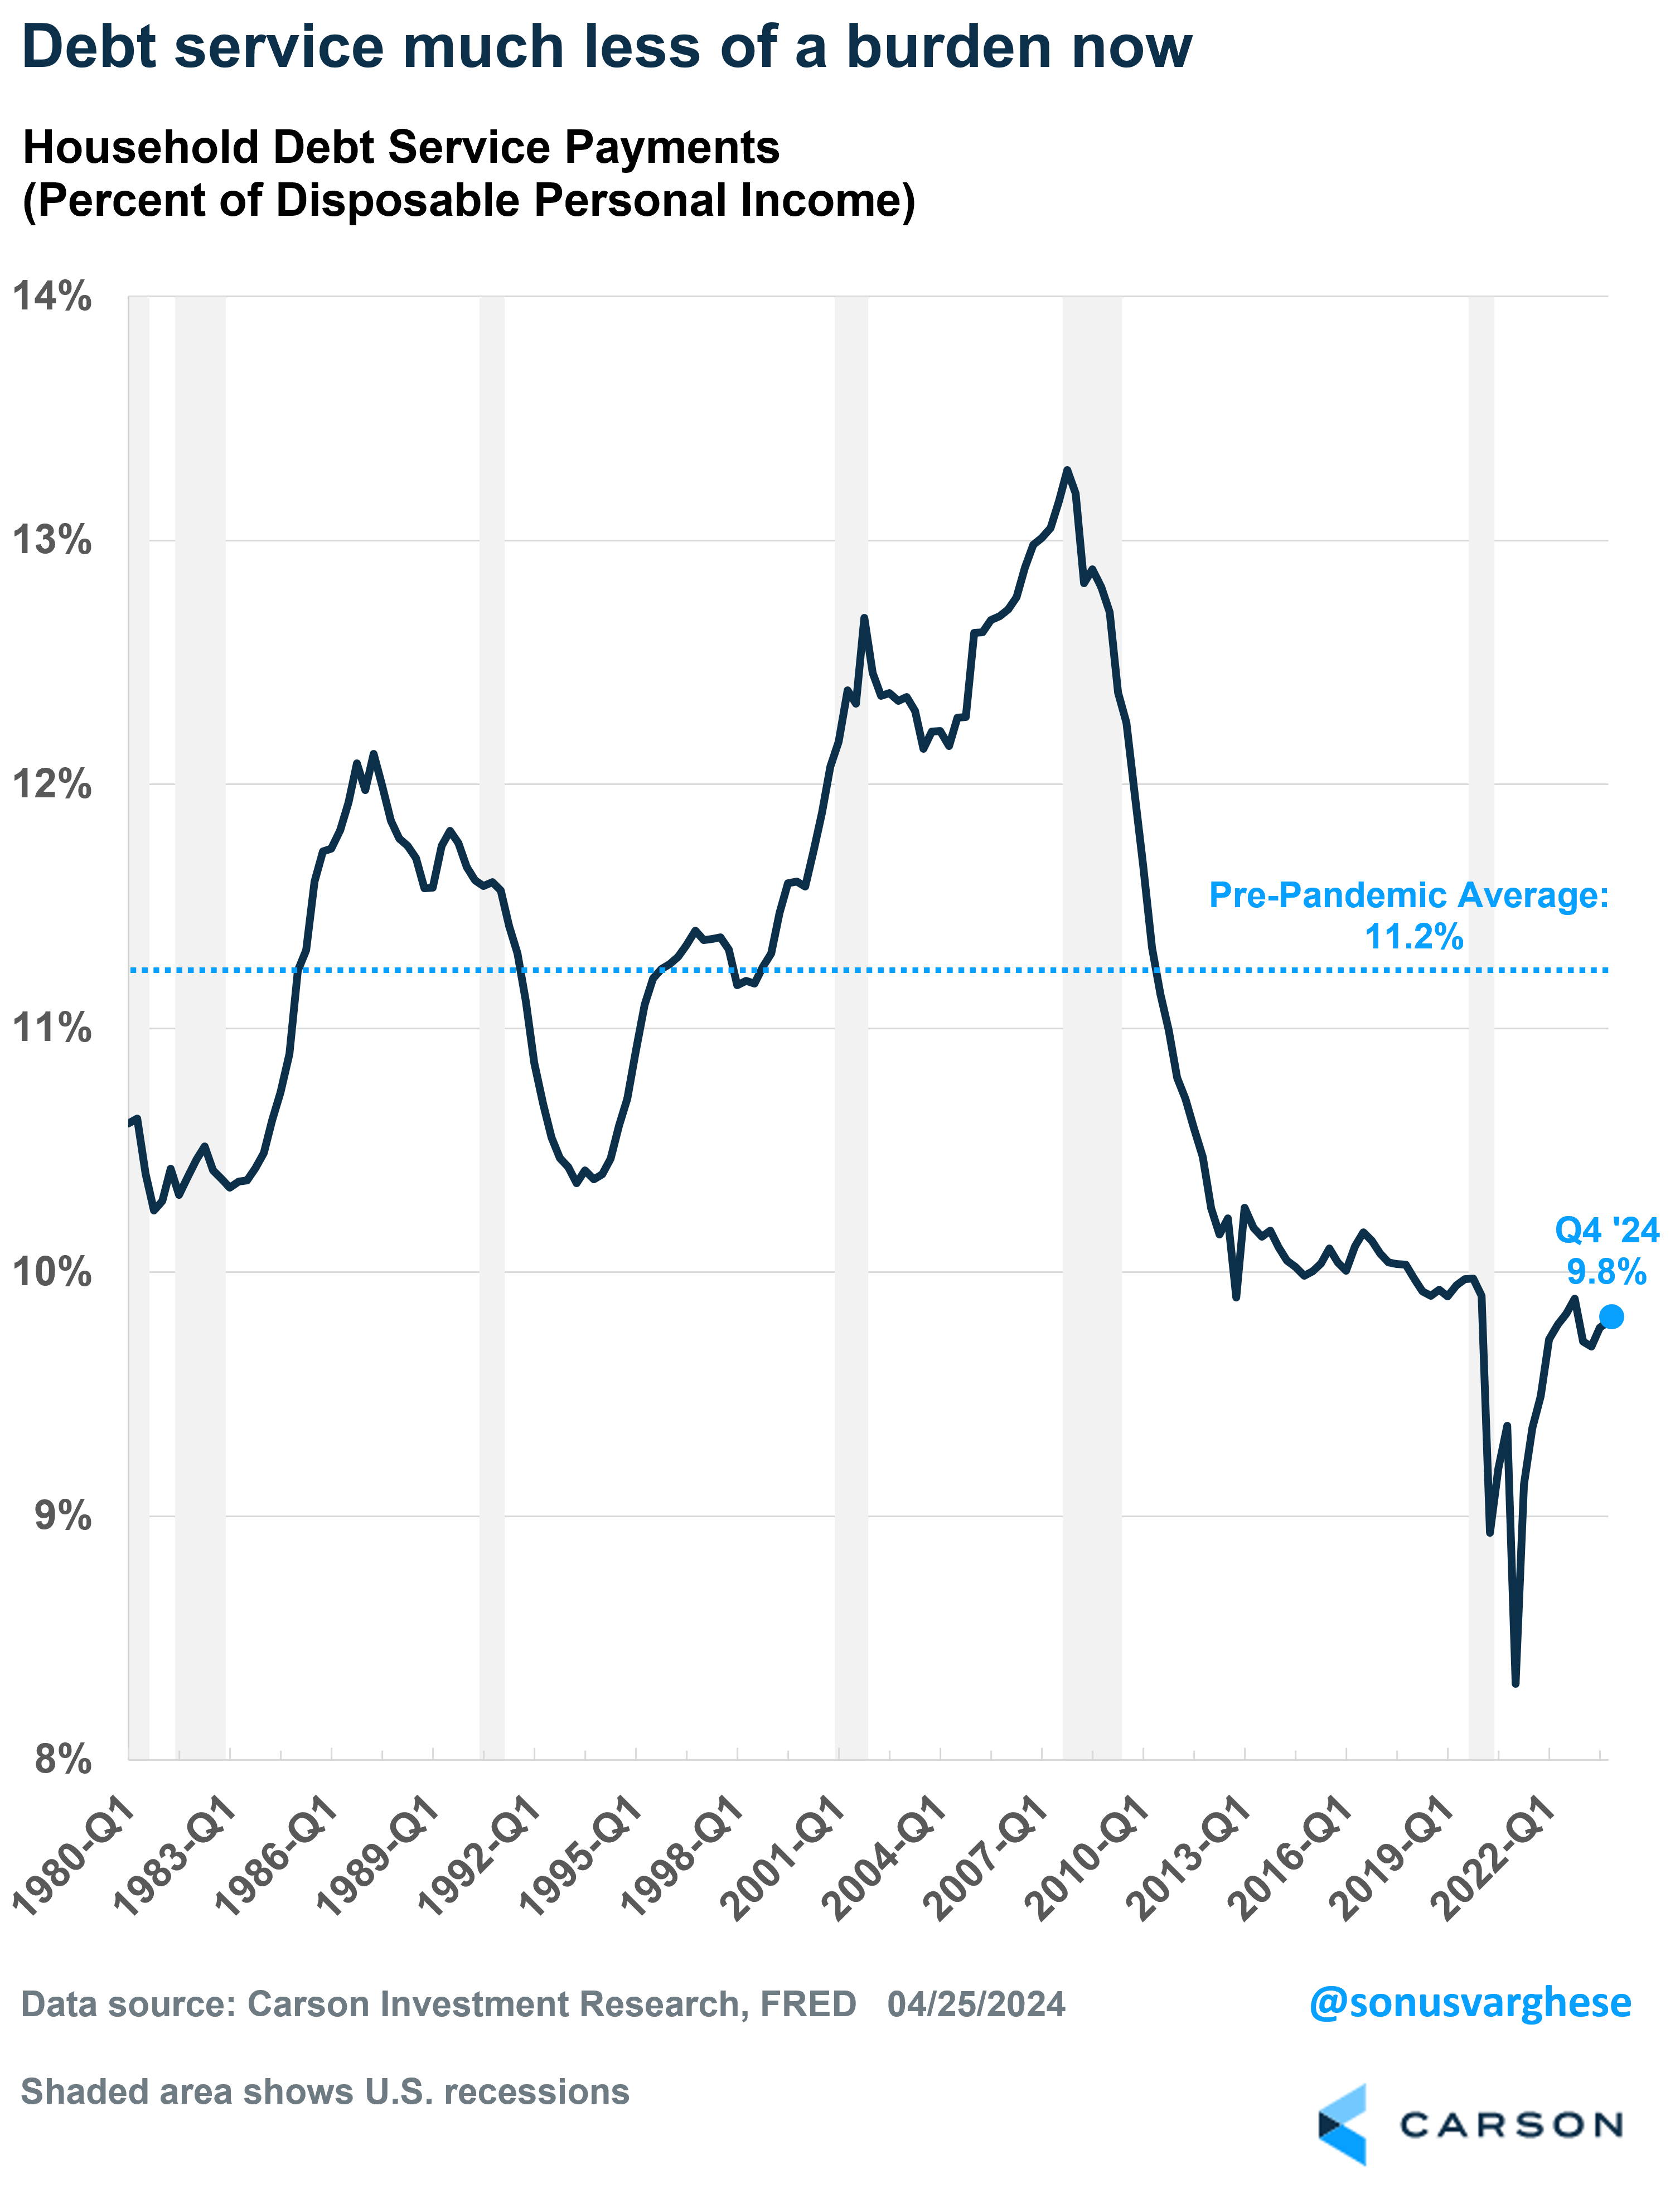
What matters when we talk about household debt is really the proportion of income that goes toward servicing that debt. Household debt service payments are running at 9.8% of disposable income, slightly below pre-pandemic levels and well below the historical average of 11.2%.
The Labor Market Is Strong
The labor market is the entire ballgame as far as the consumer is concerned. If the labor market deteriorates, incomes fall, consumption falls, and the economy is in trouble. But we have the opposite now. Payroll growth has averaged 266,000 in the first quarter and the unemployment rate has remained below 4% for 26 straight months (the longest streak since the late 1960s).
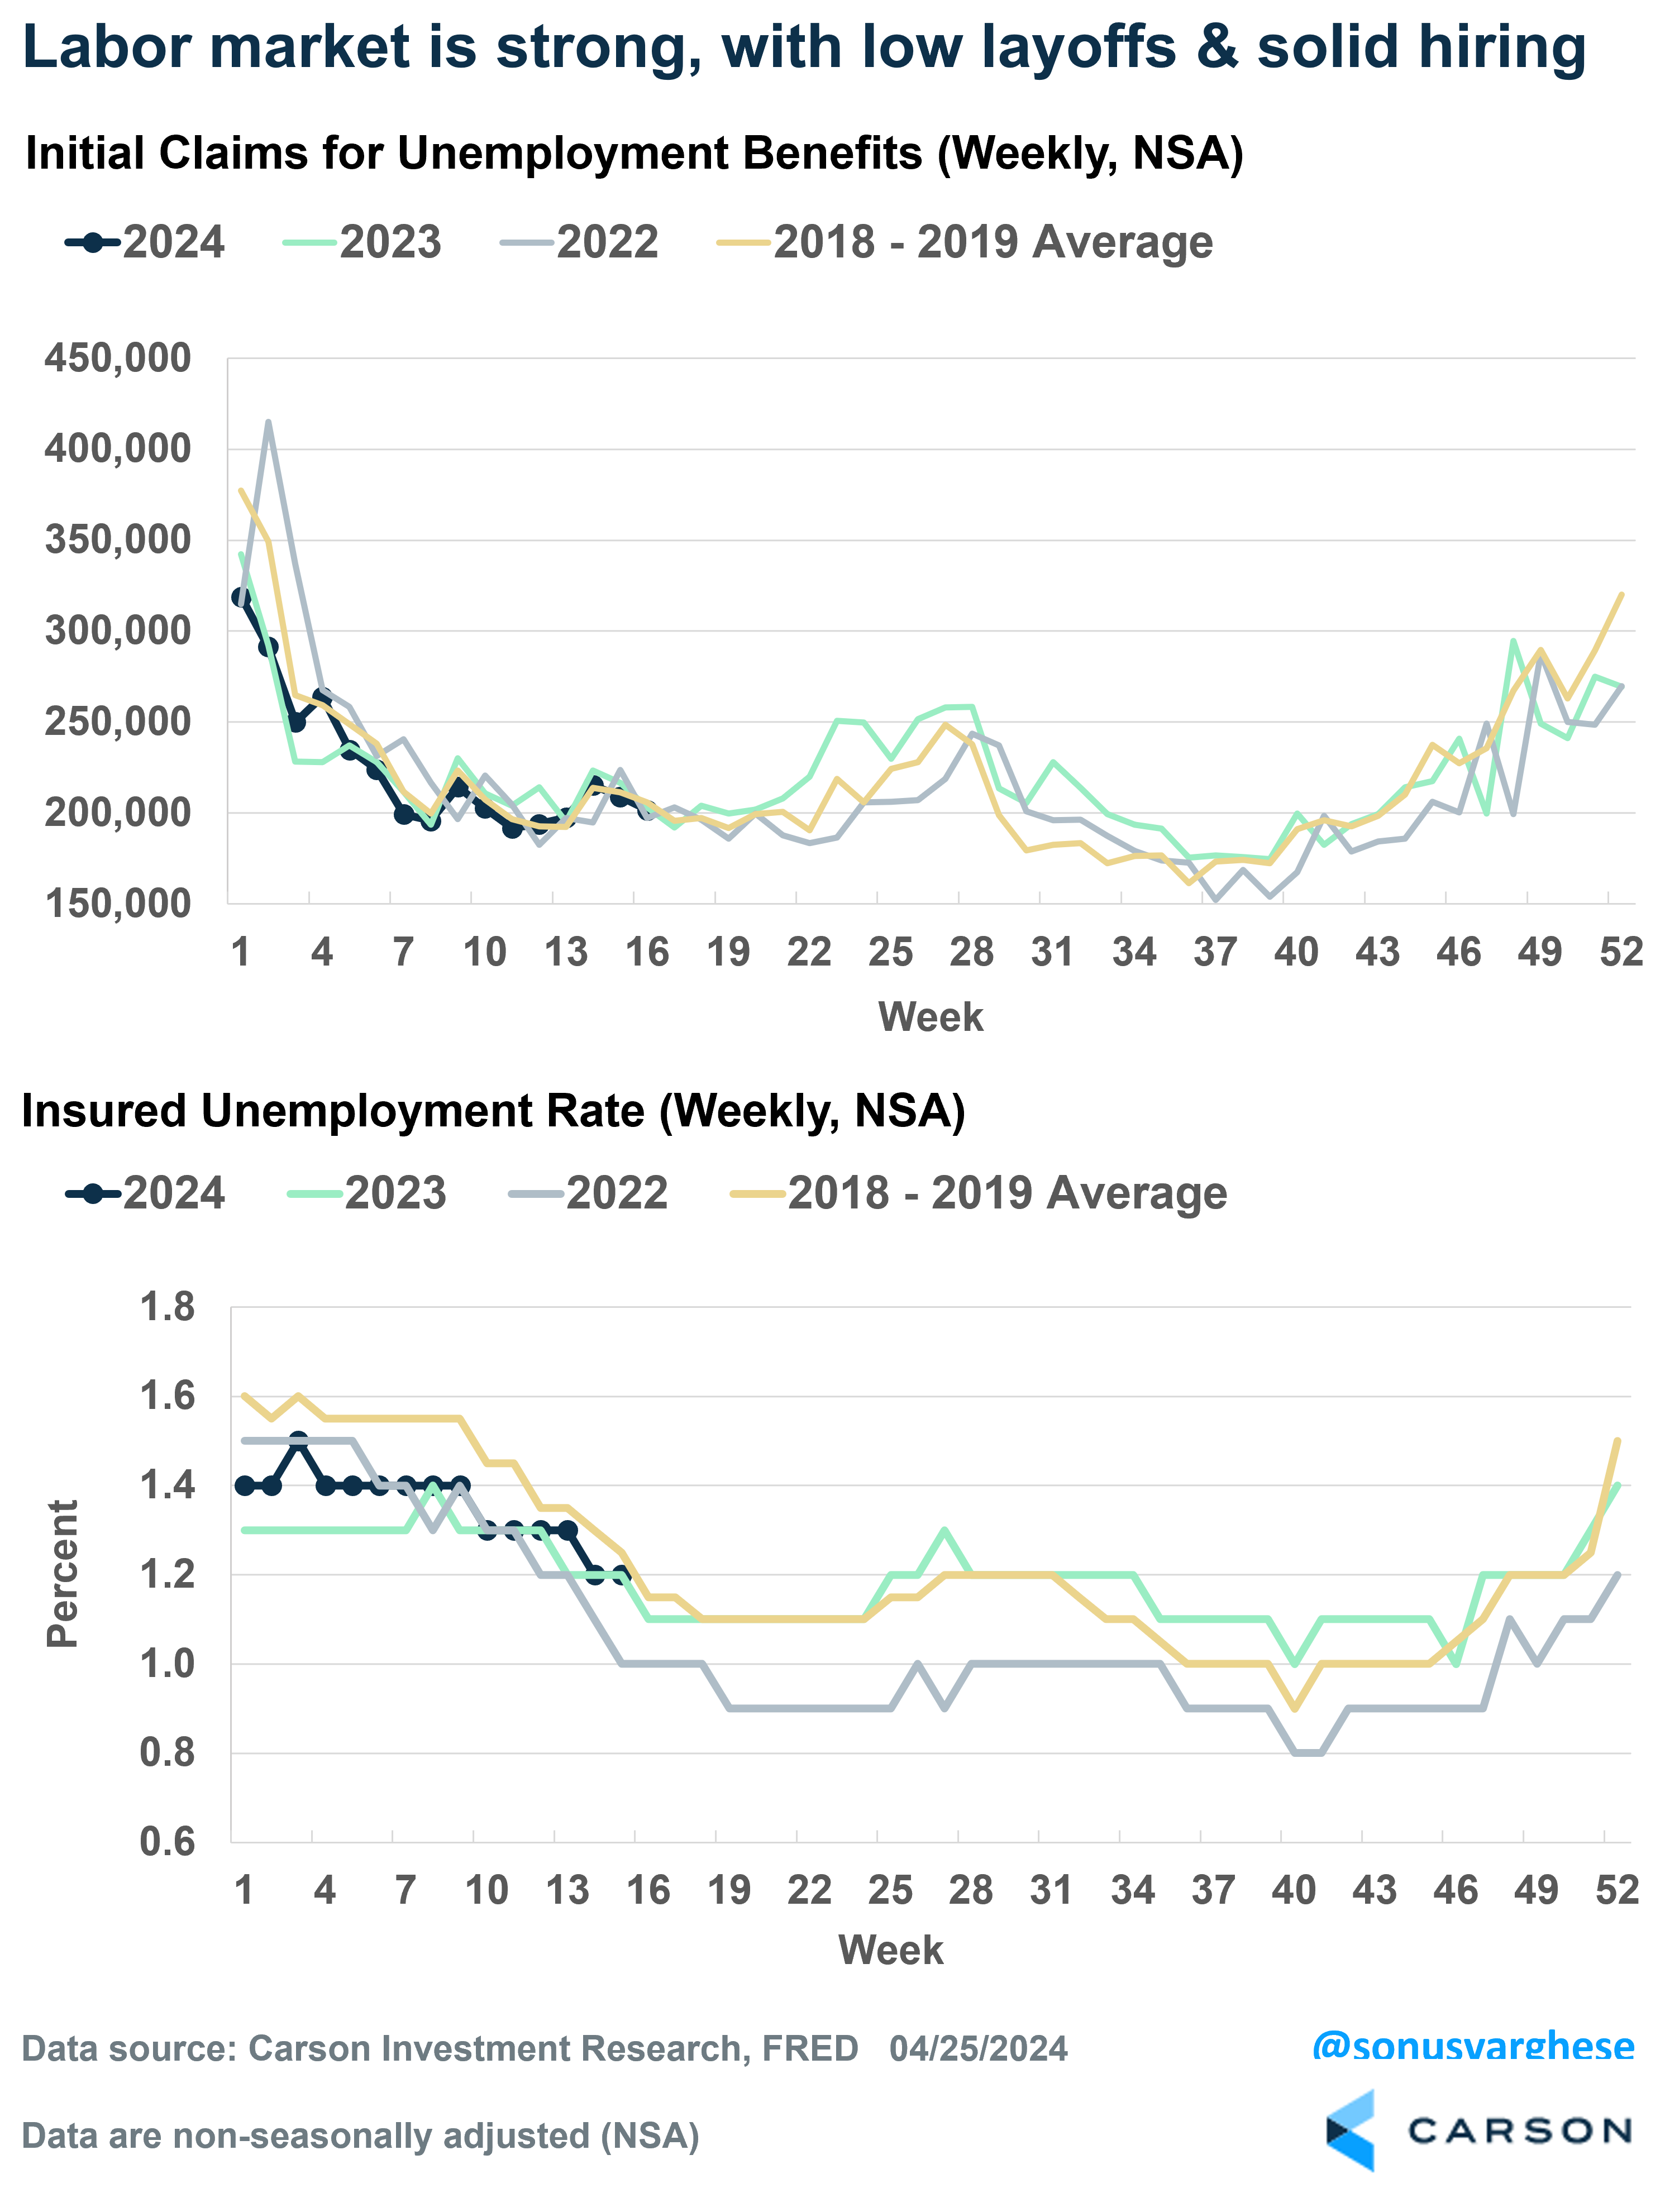
Historically, weekly unemployment claims have been a leading indicator for labor markets. Initial claims for benefits tell you whether layoffs are increasing, while continuing claims for benefits tell you how hard it is for laid off workers to find jobs. Seasonal adjustments due to pandemic-related distortions have been a big problem with claims data lately. To get around this, I compare non-seasonally adjusted data for 2024 to corresponding weekly data in 2023, 2022 and the 2018-2019 average. The top panel in the chart below shows that initial claims continue to run low. They’re comparable to what we saw in 2023, 2022, and in 2018-2019, indicating companies are not laying off too many workers.
Stay on Top of Market Trends
The Carson Investment Research newsletter offers up-to-date market news, analysis and insights. Subscribe today!
"*" indicates required fields
The bottom panel shows continuing claims for benefits normalized by the size of the labor force – this is the “insured unemployment rate.” You can see that it’s about 1.2% now and running higher than in 2022 when the labor market was red hot. That does mean hiring has eased and workers are finding it a little harder to find jobs. Yet, it’s running close to where it was in 2018-2019, indicating that this is still a strong labor market.
Ultimately, here’s what’s important to keep in mind: Consumption makes up 70% of the US economy, and right now consumption is running strong, thanks to…
- Strong labor markets, which are pushing incomes higher to above the pace of inflation
- Higher net worth, which means households can spend more
Ryan and I talk about the economy, what’s driving it, and how it connects to markets, in our Facts vs Feelings podcast. Take a listen to the latest episode.