It shouldn’t be a surprise that the Middle East crisis has sent oil prices soaring, with the impact immediately felt on gasoline and diesel prices. We just got our first batch of inflation data that incorporates this, with the headline consumer price index (CPI) rising 0.9% in March (equivalent to an 11% annualized pace). The CPI index ran at a 5.3% annualized pace over the last three months and 2.6% over the past year.
- Gasoline prices rose 21%, the largest monthly increase since data collection started in 1967.
- Fuel oil (diesel) rose 31%, the largest increase since 2000.
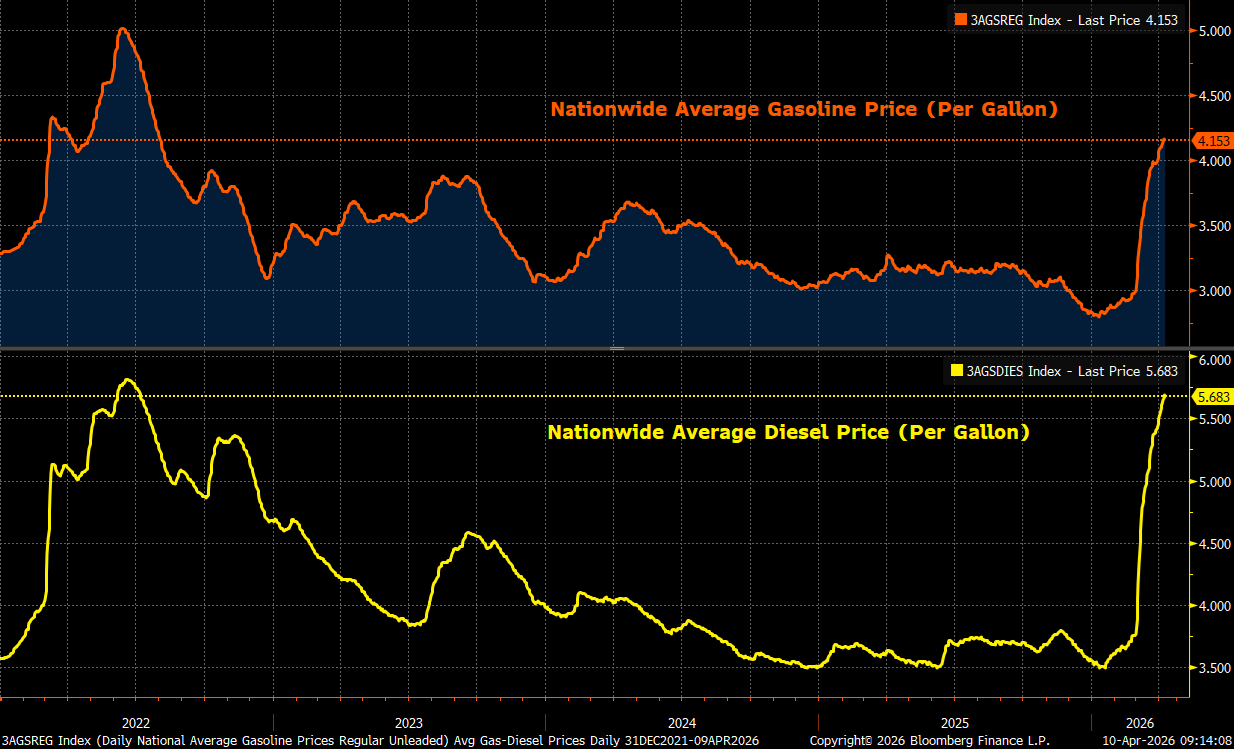
Unfortunately, there’s more to come as this incorporates data only through mid-March. Since then, gasoline and diesel prices have climbed even more, to the highest levels since mid-2022.
- Nationwide average gasoline prices hit $4.15/gallon. It was about $2.80/gallon two months ago.
- Nationwide average diesel prices hit $5.68/gallon, up from about $3.50/gallon two months ago.
In short, there’s more to come on the energy price increase front within official inflation data. Hopefully, a potential ceasefire that holds will send oil prices lower and gasoline/diesel prices as well. Just don’t expect prices to fall as quickly as they rose, an effect economists sometimes call “rockets and feather”— prices go up like rockets but fall like feathers. You can see this from the 2022 episode as well.
The good news is that core CPI, which excludes volatile food and energy, rose just 0.2% in March (equivalent to a 2.4% annualized pace), taking the 12-month increase to 2.6%. A couple of big drivers are
- Continued shelter disinflation, with rental inflation easing to a pace below what we saw even pre-pandemic (2018-2019)
- A big drop in used car prices, which have fallen at an annualized pace of 10% over the last three months
These two categories account for 46% of the core CPI basket, but what is striking is that the three-month annualized pace for core CPI is still running at an elevated 2.9% despite these favorable tailwinds.
Price Pressures Aren’t Isolated to a Few Categories
There’s clearly a lot of underlying pressure on prices, and this was true even prior to the crisis. The Federal Reserve’s preferred inflation metric is the Personal Consumption Expenditures Price Index (PCE), which they switched to targeting back in 2000 for several reasons, including
- PCE covers more categories than CPI
- PCE can be revised whereas CPI can’t be
- PCE accounts for substitution, i.e. households switching from more expensive goods and services to cheaper ones, whereas the CPI basket is fixed (and updated only once a year)
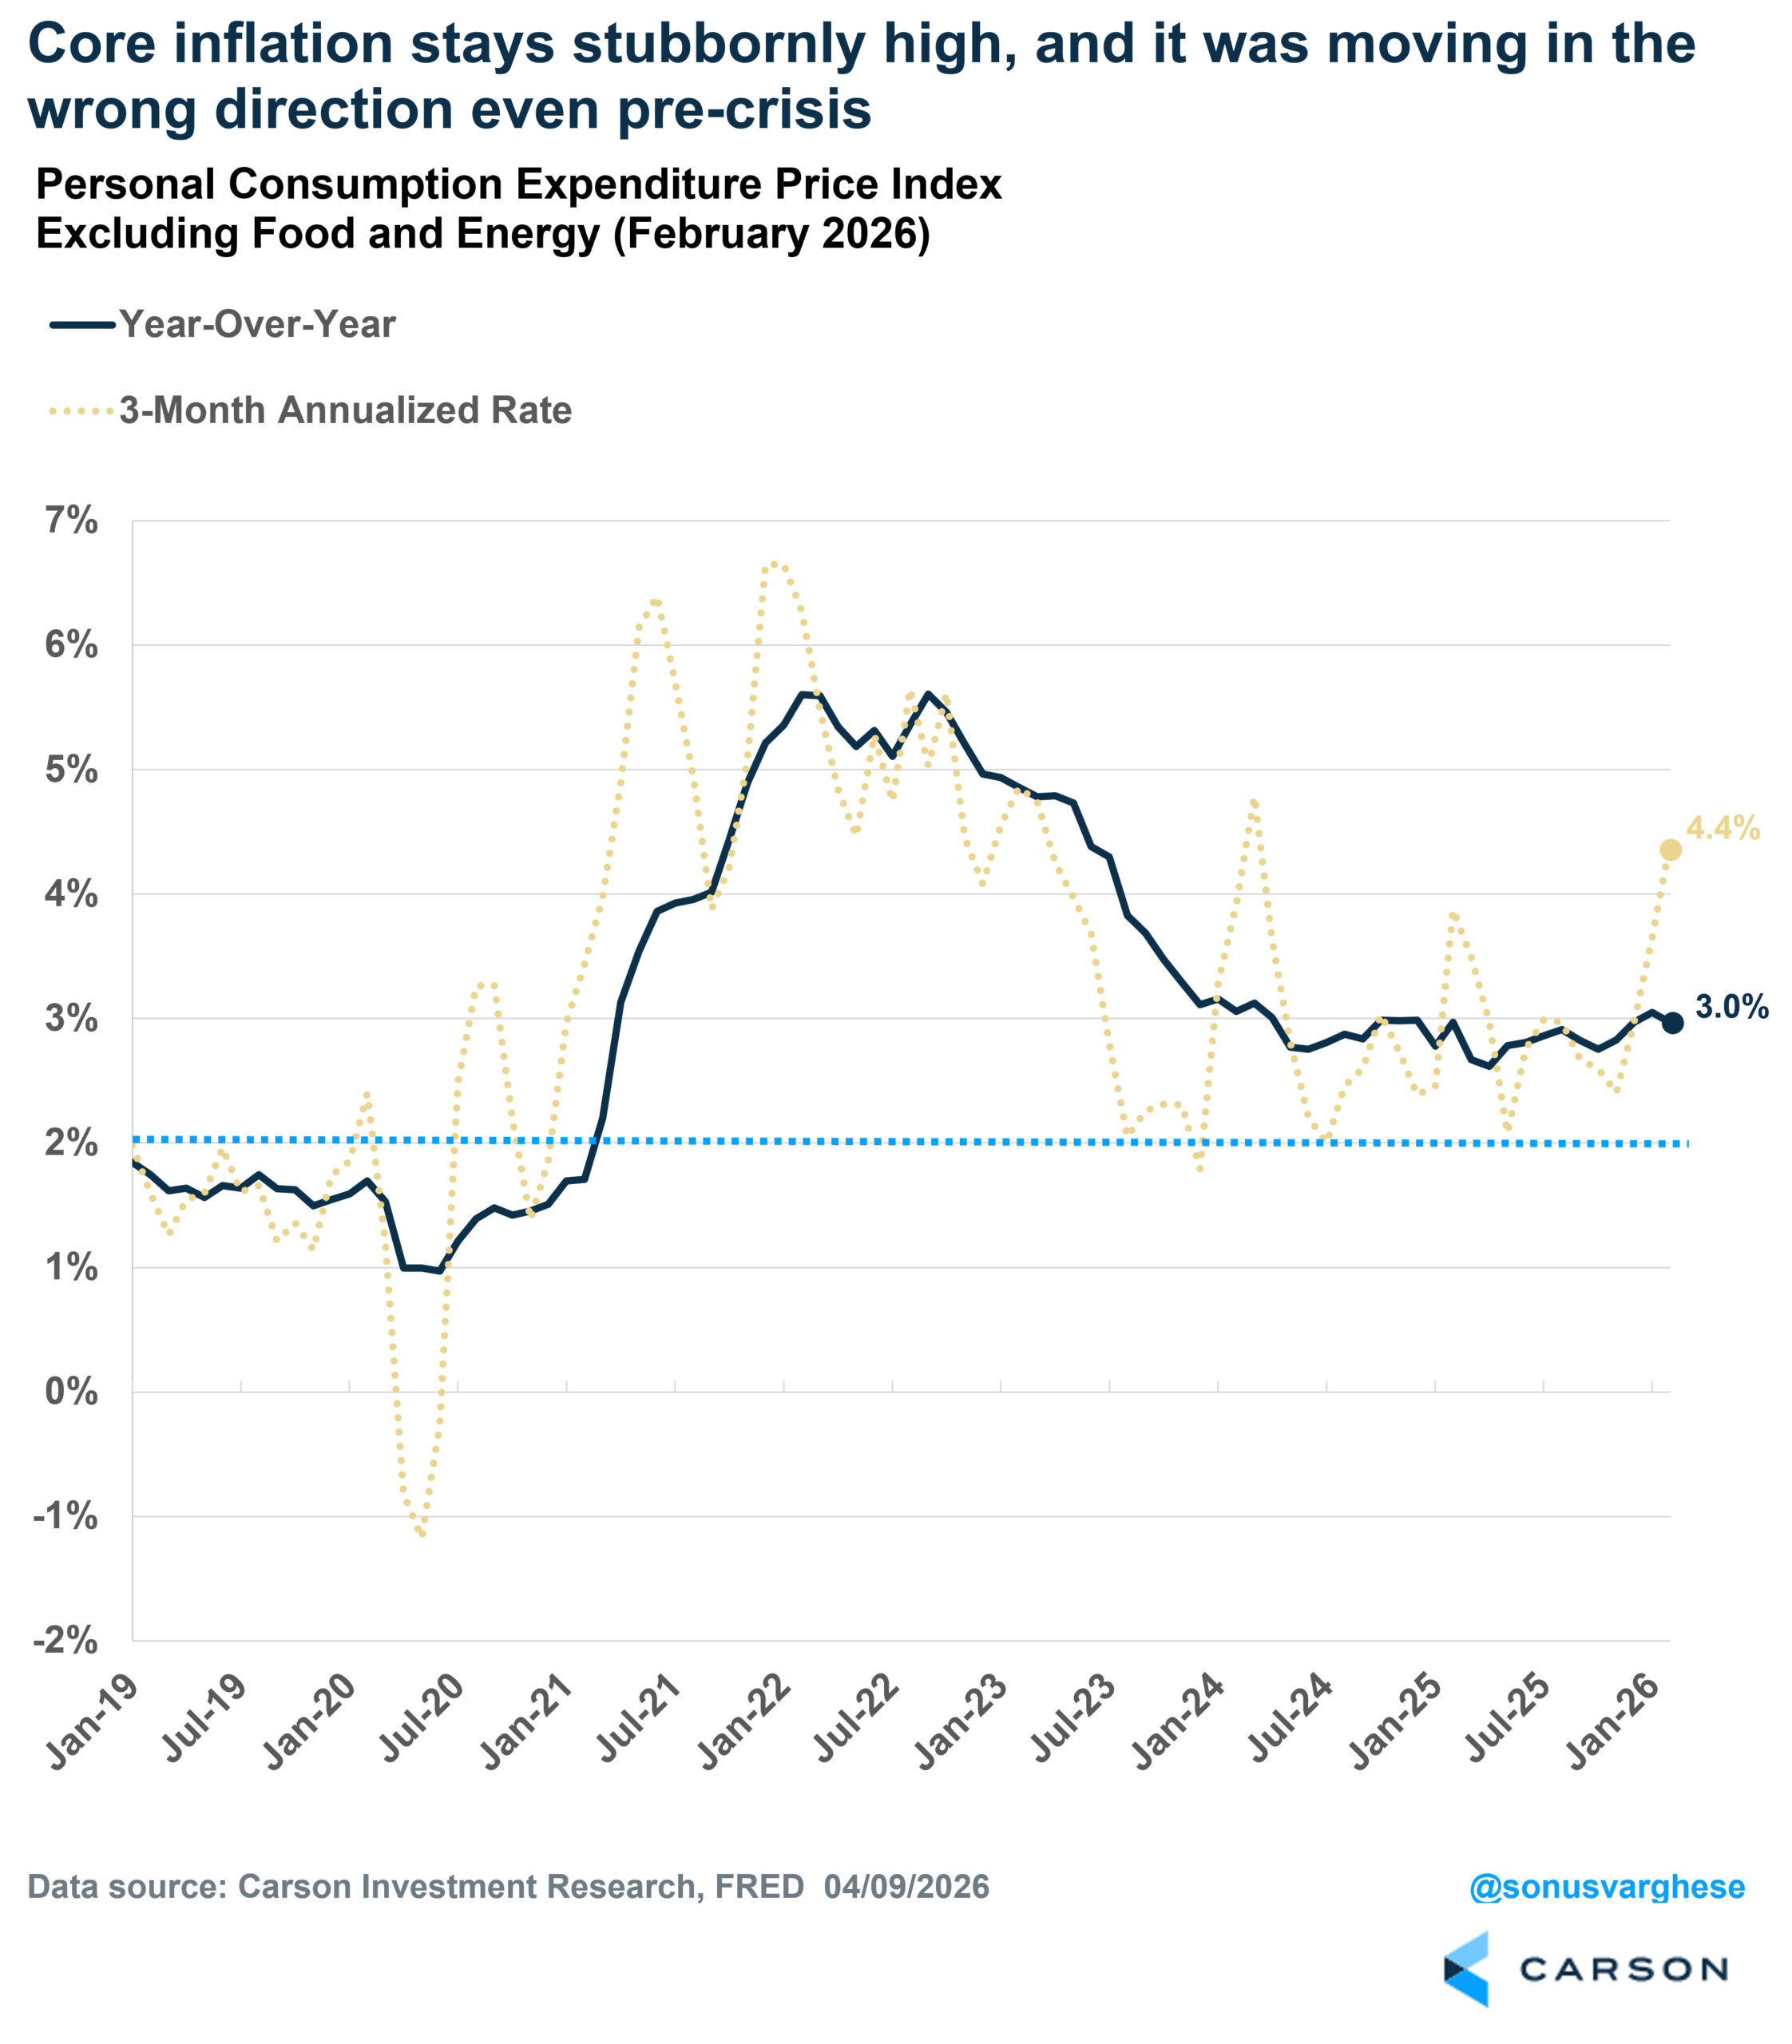
We only have PCE data through February, but that’s an important baseline for what was happening before the Middle East crisis started and it already wasn’t good. Core PCE inflation ran at annualized pace of 4.4% from December through February, the fastest in two years. The index is up 3% over the past year, the 59th straight month over 2.5%. The Fed’s target is 2%.
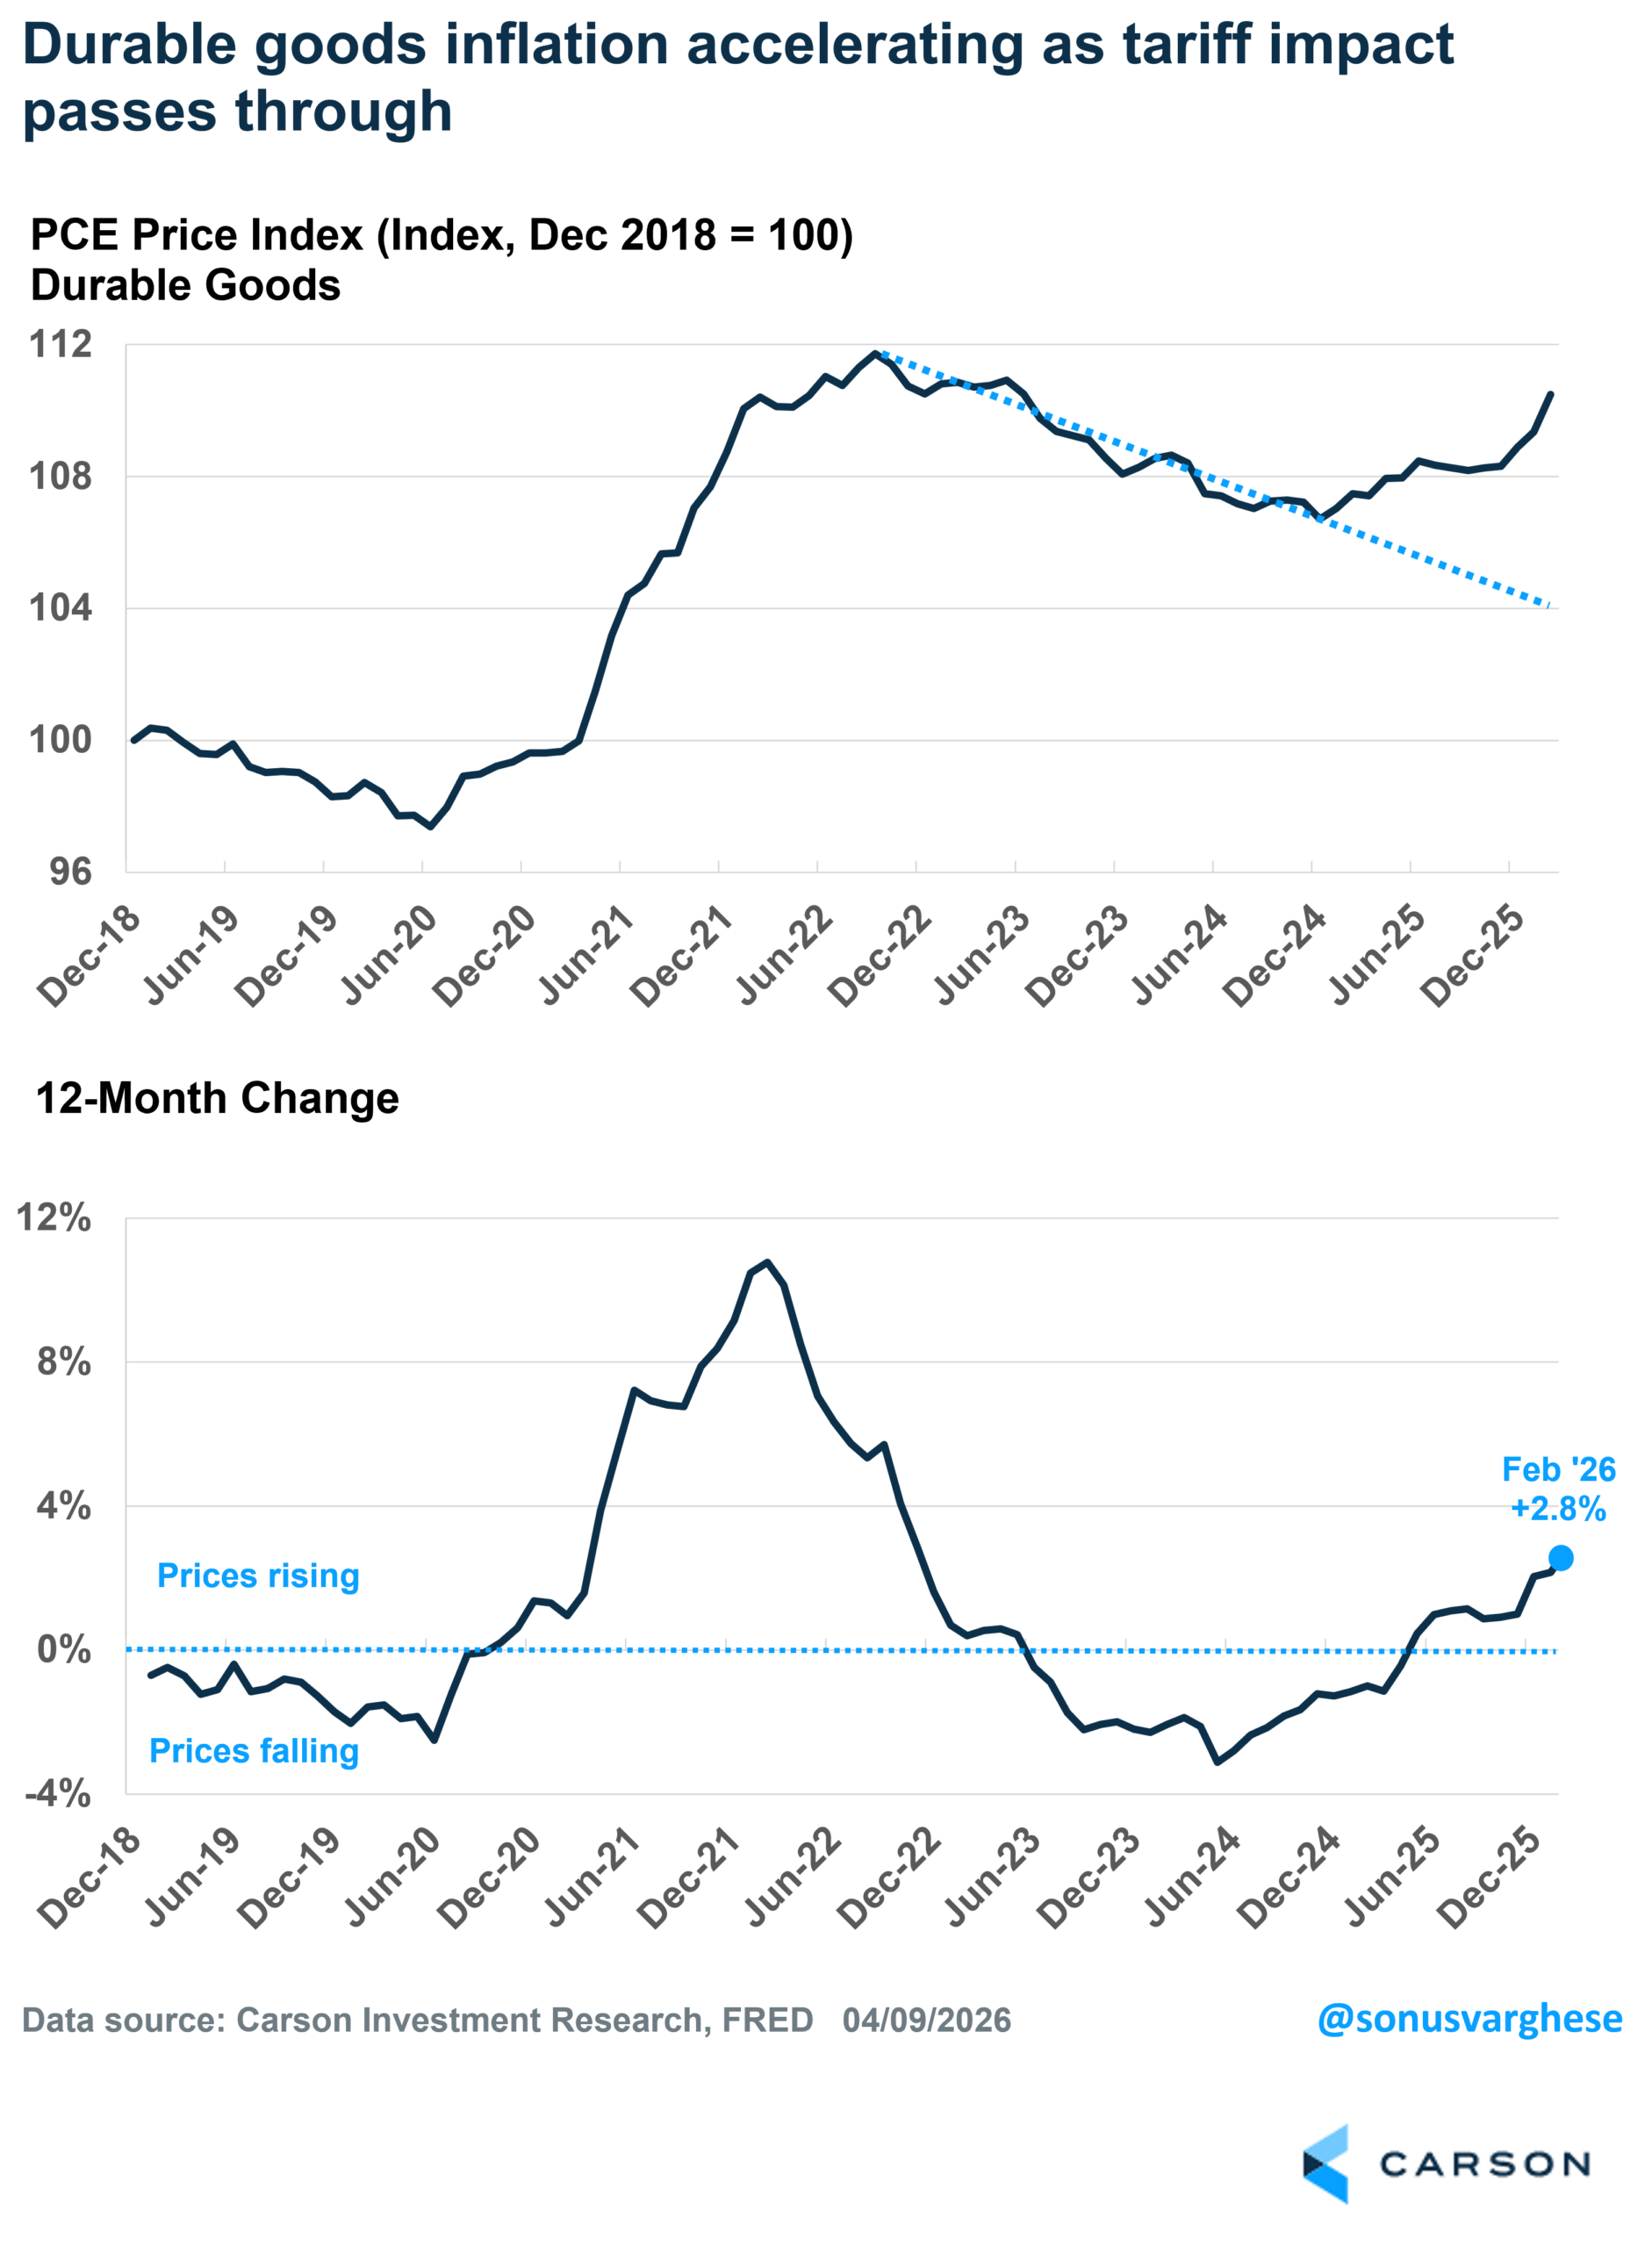
The most obvious culprit for elevated inflation is tariff-impacted goods. Core goods inflation has been accelerating recently and is now up 2.8% over the last year, the fastest pace since November 2022. As you can see below, prices have been moving higher recently, which means the tariff impact is not quite done. Keep in mind that the counter-factual here is that prices would be heading lower if not for tariffs. In fact, core goods prices are now over 6% higher than they would be if prices had continued along their 2023-2024 downtrend.
There are AI-related price pressures as well. The CPI index for computers and software is up 12% year over year through March, a whopping 59% annualized pace for the first quarter. Keep in mind that these goods are mostly exempt from the tariffs.
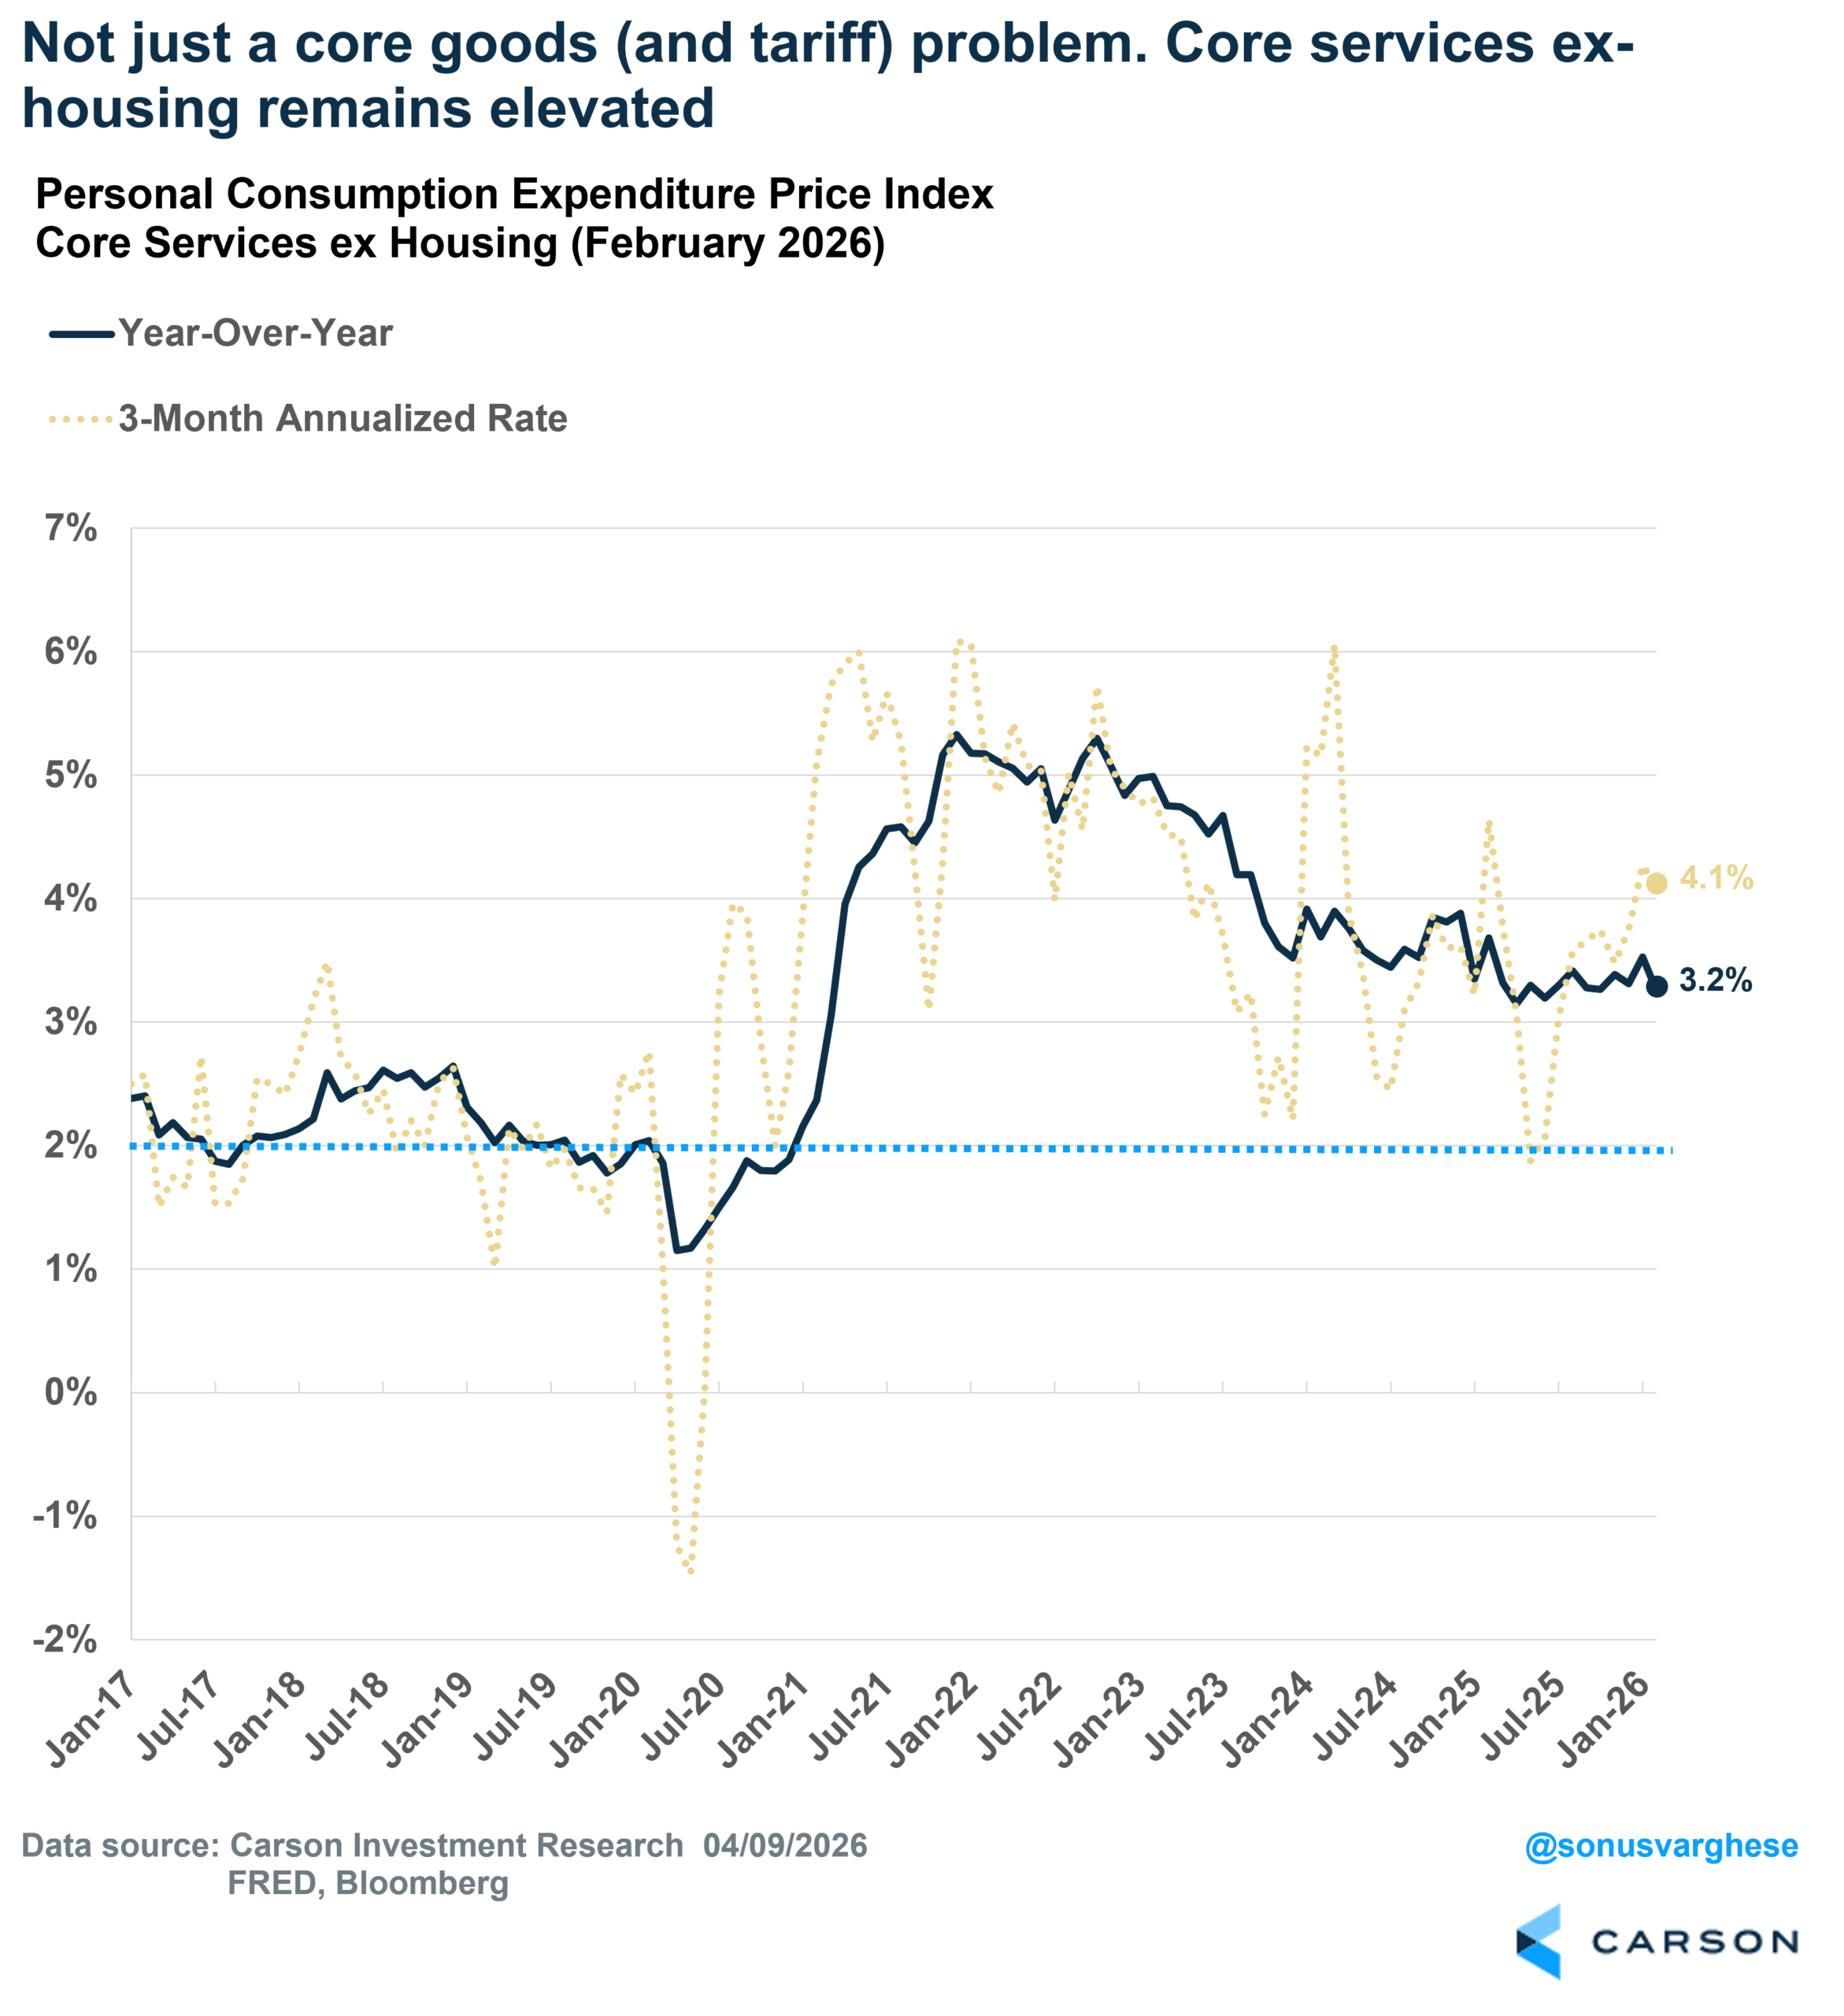
However, the problem isn’t just limited to goods. Even though we’re seeing rental disinflation, core services ex-housing is running hot. The three-month annualized pace is 4.1%. The index is up 3.2% over the past year, the 60th straight month with a 3%+ reading (the 2017-2019 average was 2.2% for reference).
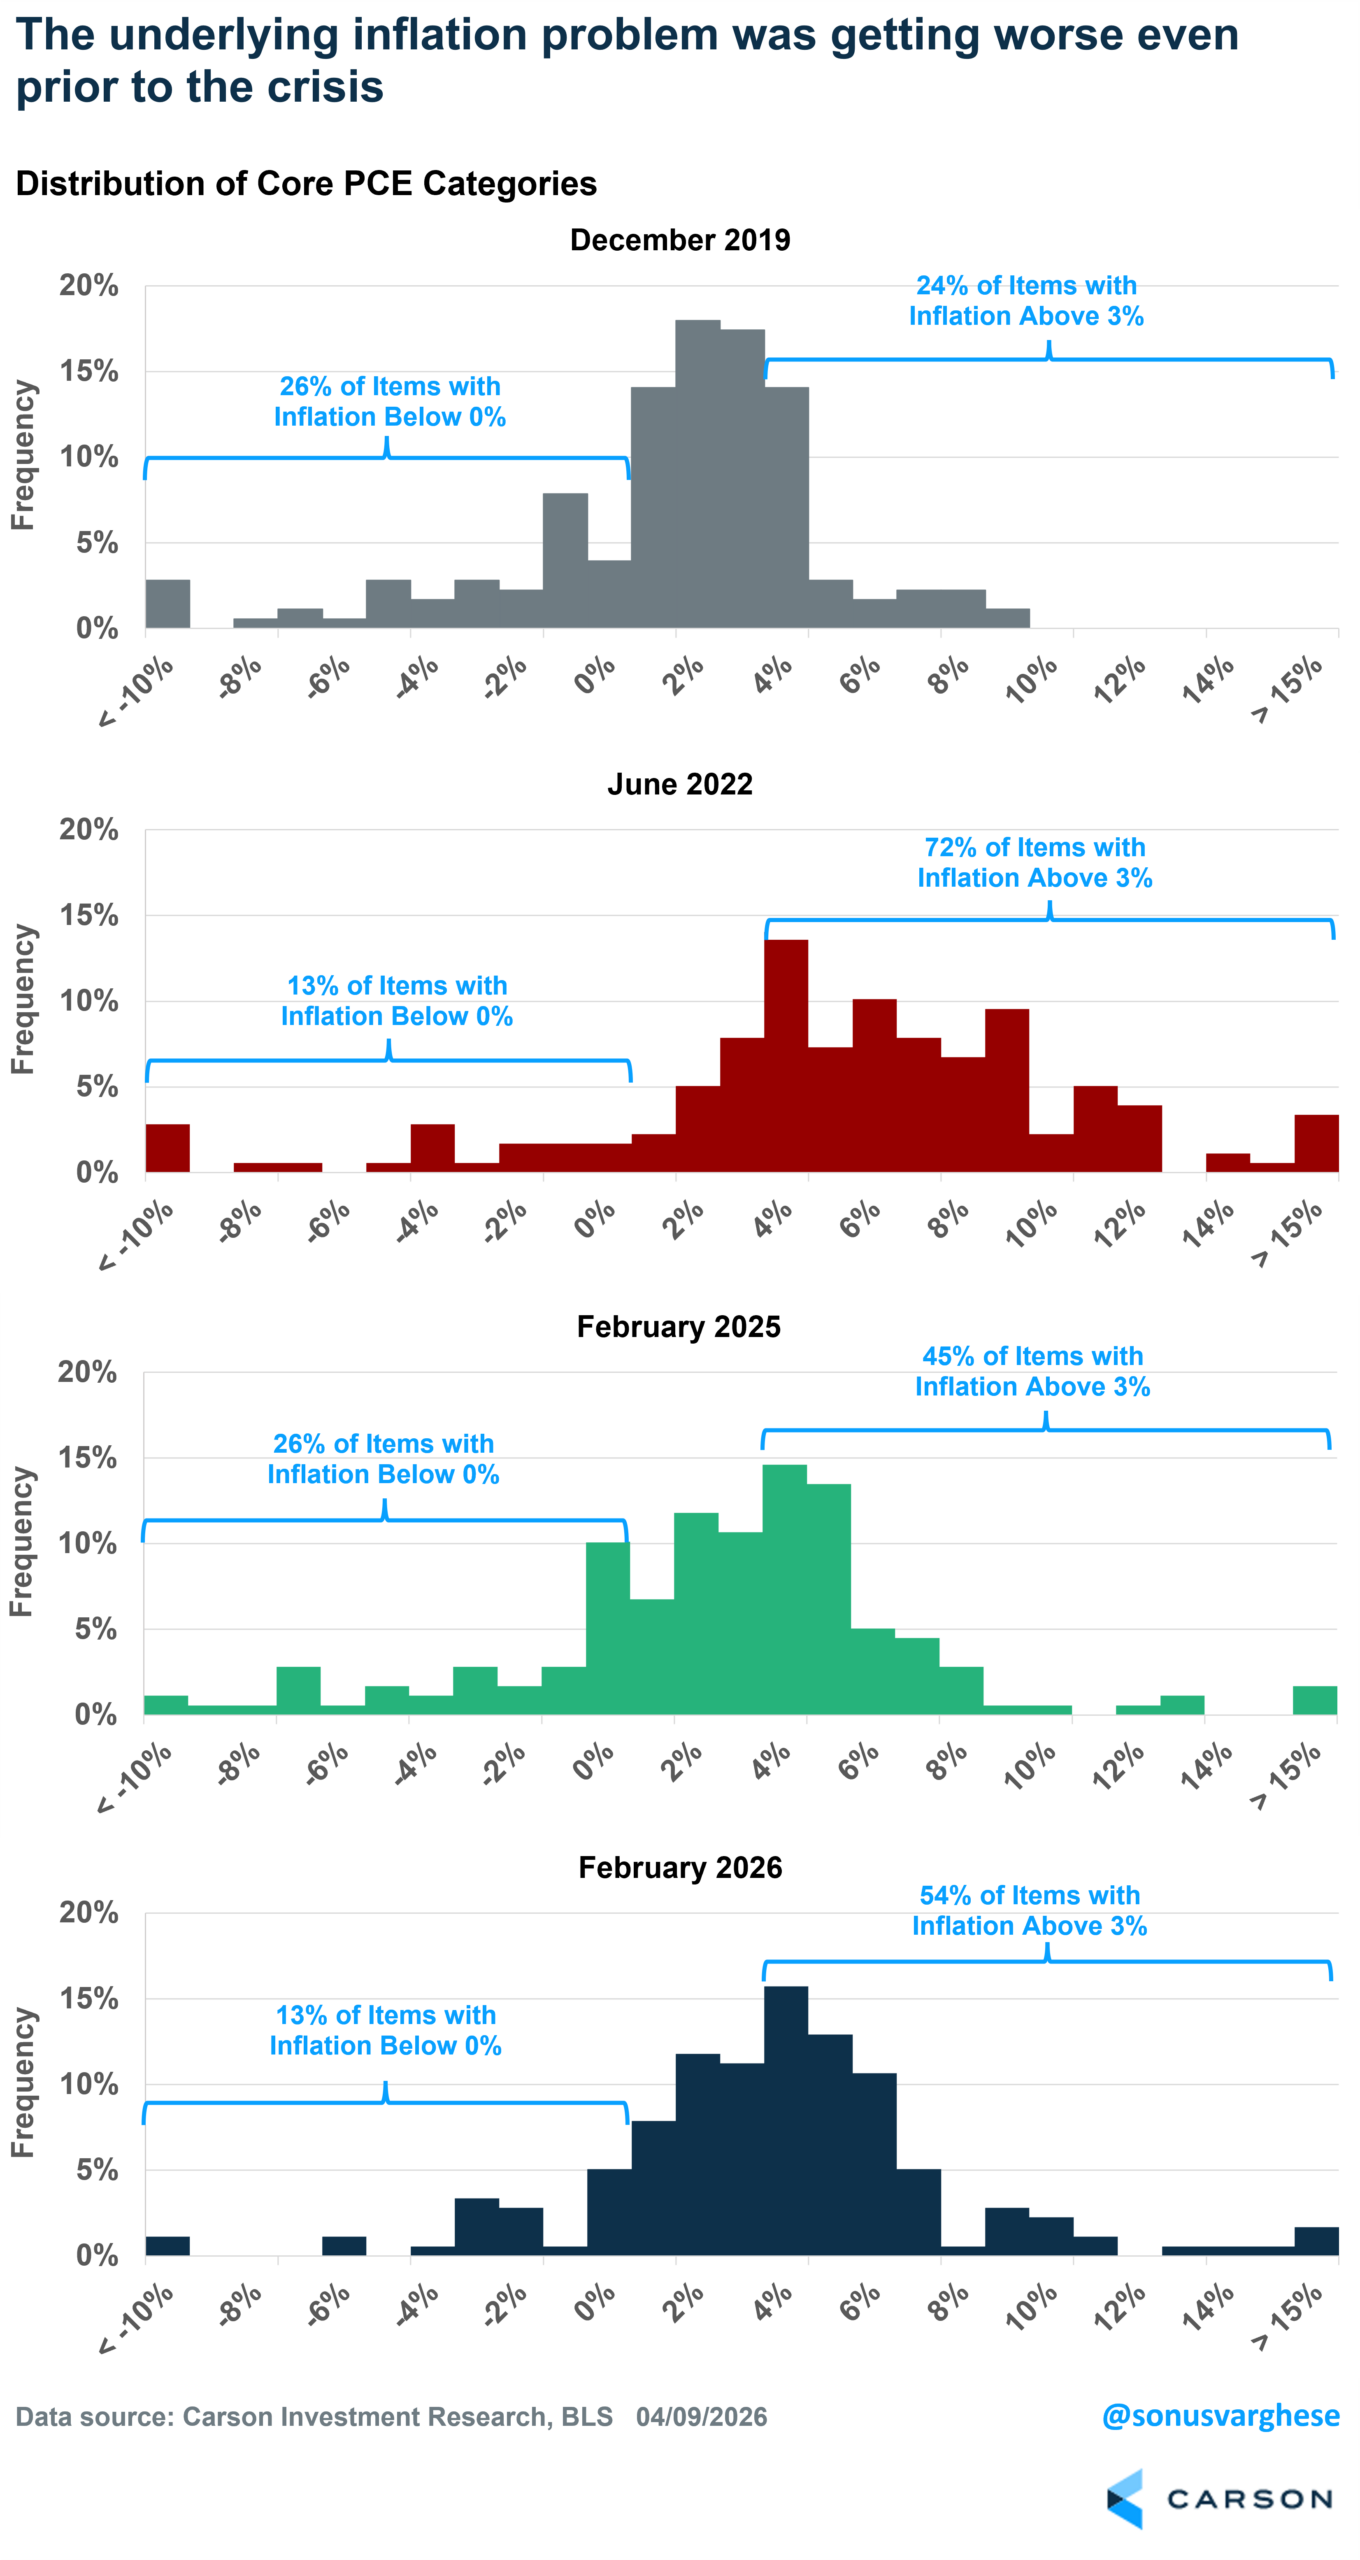
Here’s another way to capture all of this. I looked at 178 items within the core PCE basket and calculated the distribution of year-over-year inflation at four different times. You can see how inflation really broadened out in June 2022 relative to December 2019. Up until last year the distribution was narrowing, but things were still not quite “normal”. And over the past year, things have gotten even worse. Here’s a look at the proportion of items with over 3% inflation rates (with over 4% in parenthesis):
- December 2019: 24% with 3%+ inflation (10% with 4%+ inflation)
- June 2022: 72% (58%)
- February 2025: 45% (30%)
- February 2026 54% (39%)
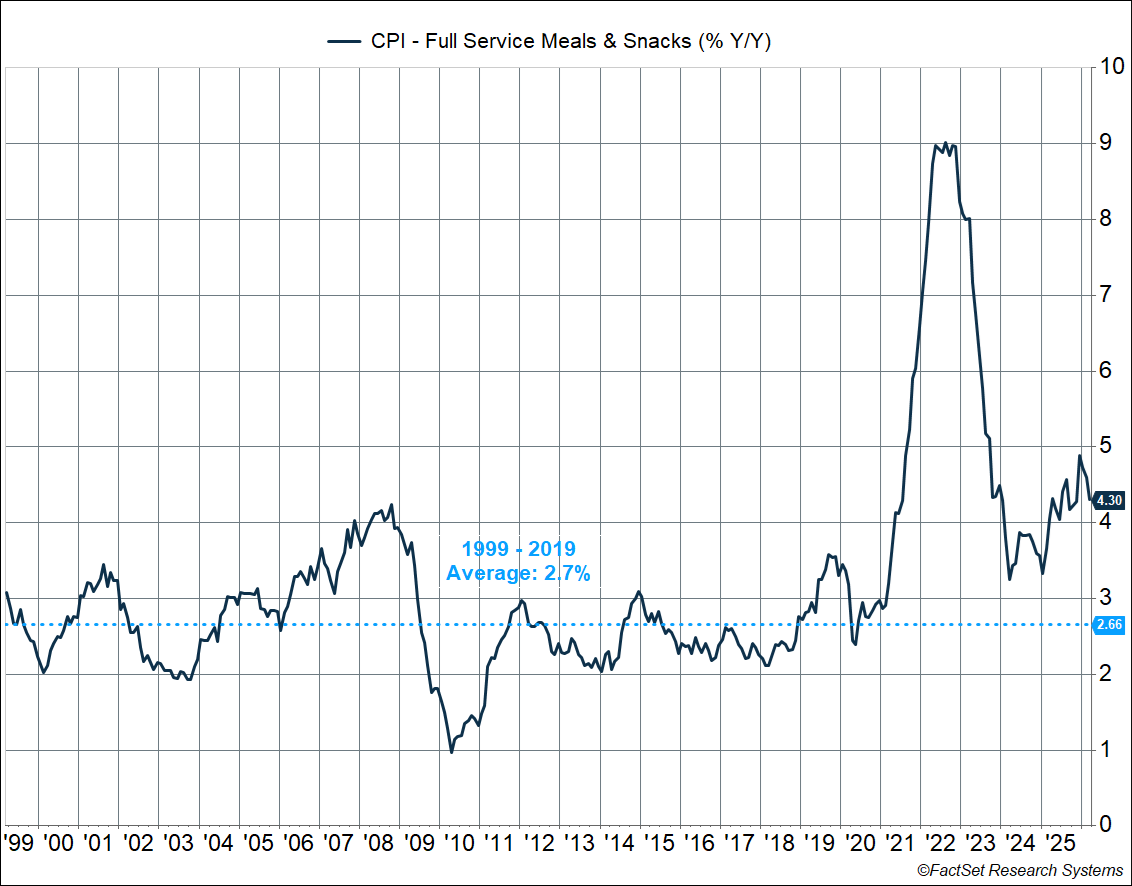
One of our favorite things to keep an eye on is CPI for “full services meals and snacks,” primarily seated restaurants, to gauge underlying inflationary pressure. That’s because it combines several inflation drivers including:
- Food inflation, and even energy prices (including transportation)
- Rent of restaurant premises
- Worker wages
Inflation for seated dining restaurants is up 4.3% year over year as of March. That’s a faster pace than anything we saw between the late 1990s and 2020. This is partly because of higher food prices (which is not going to be helped by rising diesel prices). It could also be because everyone’s buying $25 burgers at a restaurant, instead of at McDonalds, but that also implies people are able to do that. The obvious implication here is that the labor market (and wage growth) may not be as weak as headline payroll data suggest. (I discussed this in a blog earlier this week.)

Stay on Top of Market Trends
The Carson Investment Research newsletter offers up-to-date market news, analysis and insights. Subscribe today!
"*" indicates required fields
The Fed Has a Problem That Is Only Getting Worse
Inflation has already run hot over the past 5+ years, whichever metric you use:
- Headline CPI averaged a 4.5% annual pace since 2021(through March 2026)
- Headline PCE averaged a 4.0% annual pace since 2021 (through February 2026)
On top of that, we were clearly a long way from normal on the inflation front even before the crisis.
In fact, it’s interesting that tariff-impacted goods inflation has accelerated since the Fed cut rates by another 0.75%-points in Q4. They clearly underestimated the pass-through impact of tariffs and the extent of services inflation, even as they overestimated risks to the labor market (the unemployment rate has fallen from 4.6% in November to 4.26% in March).
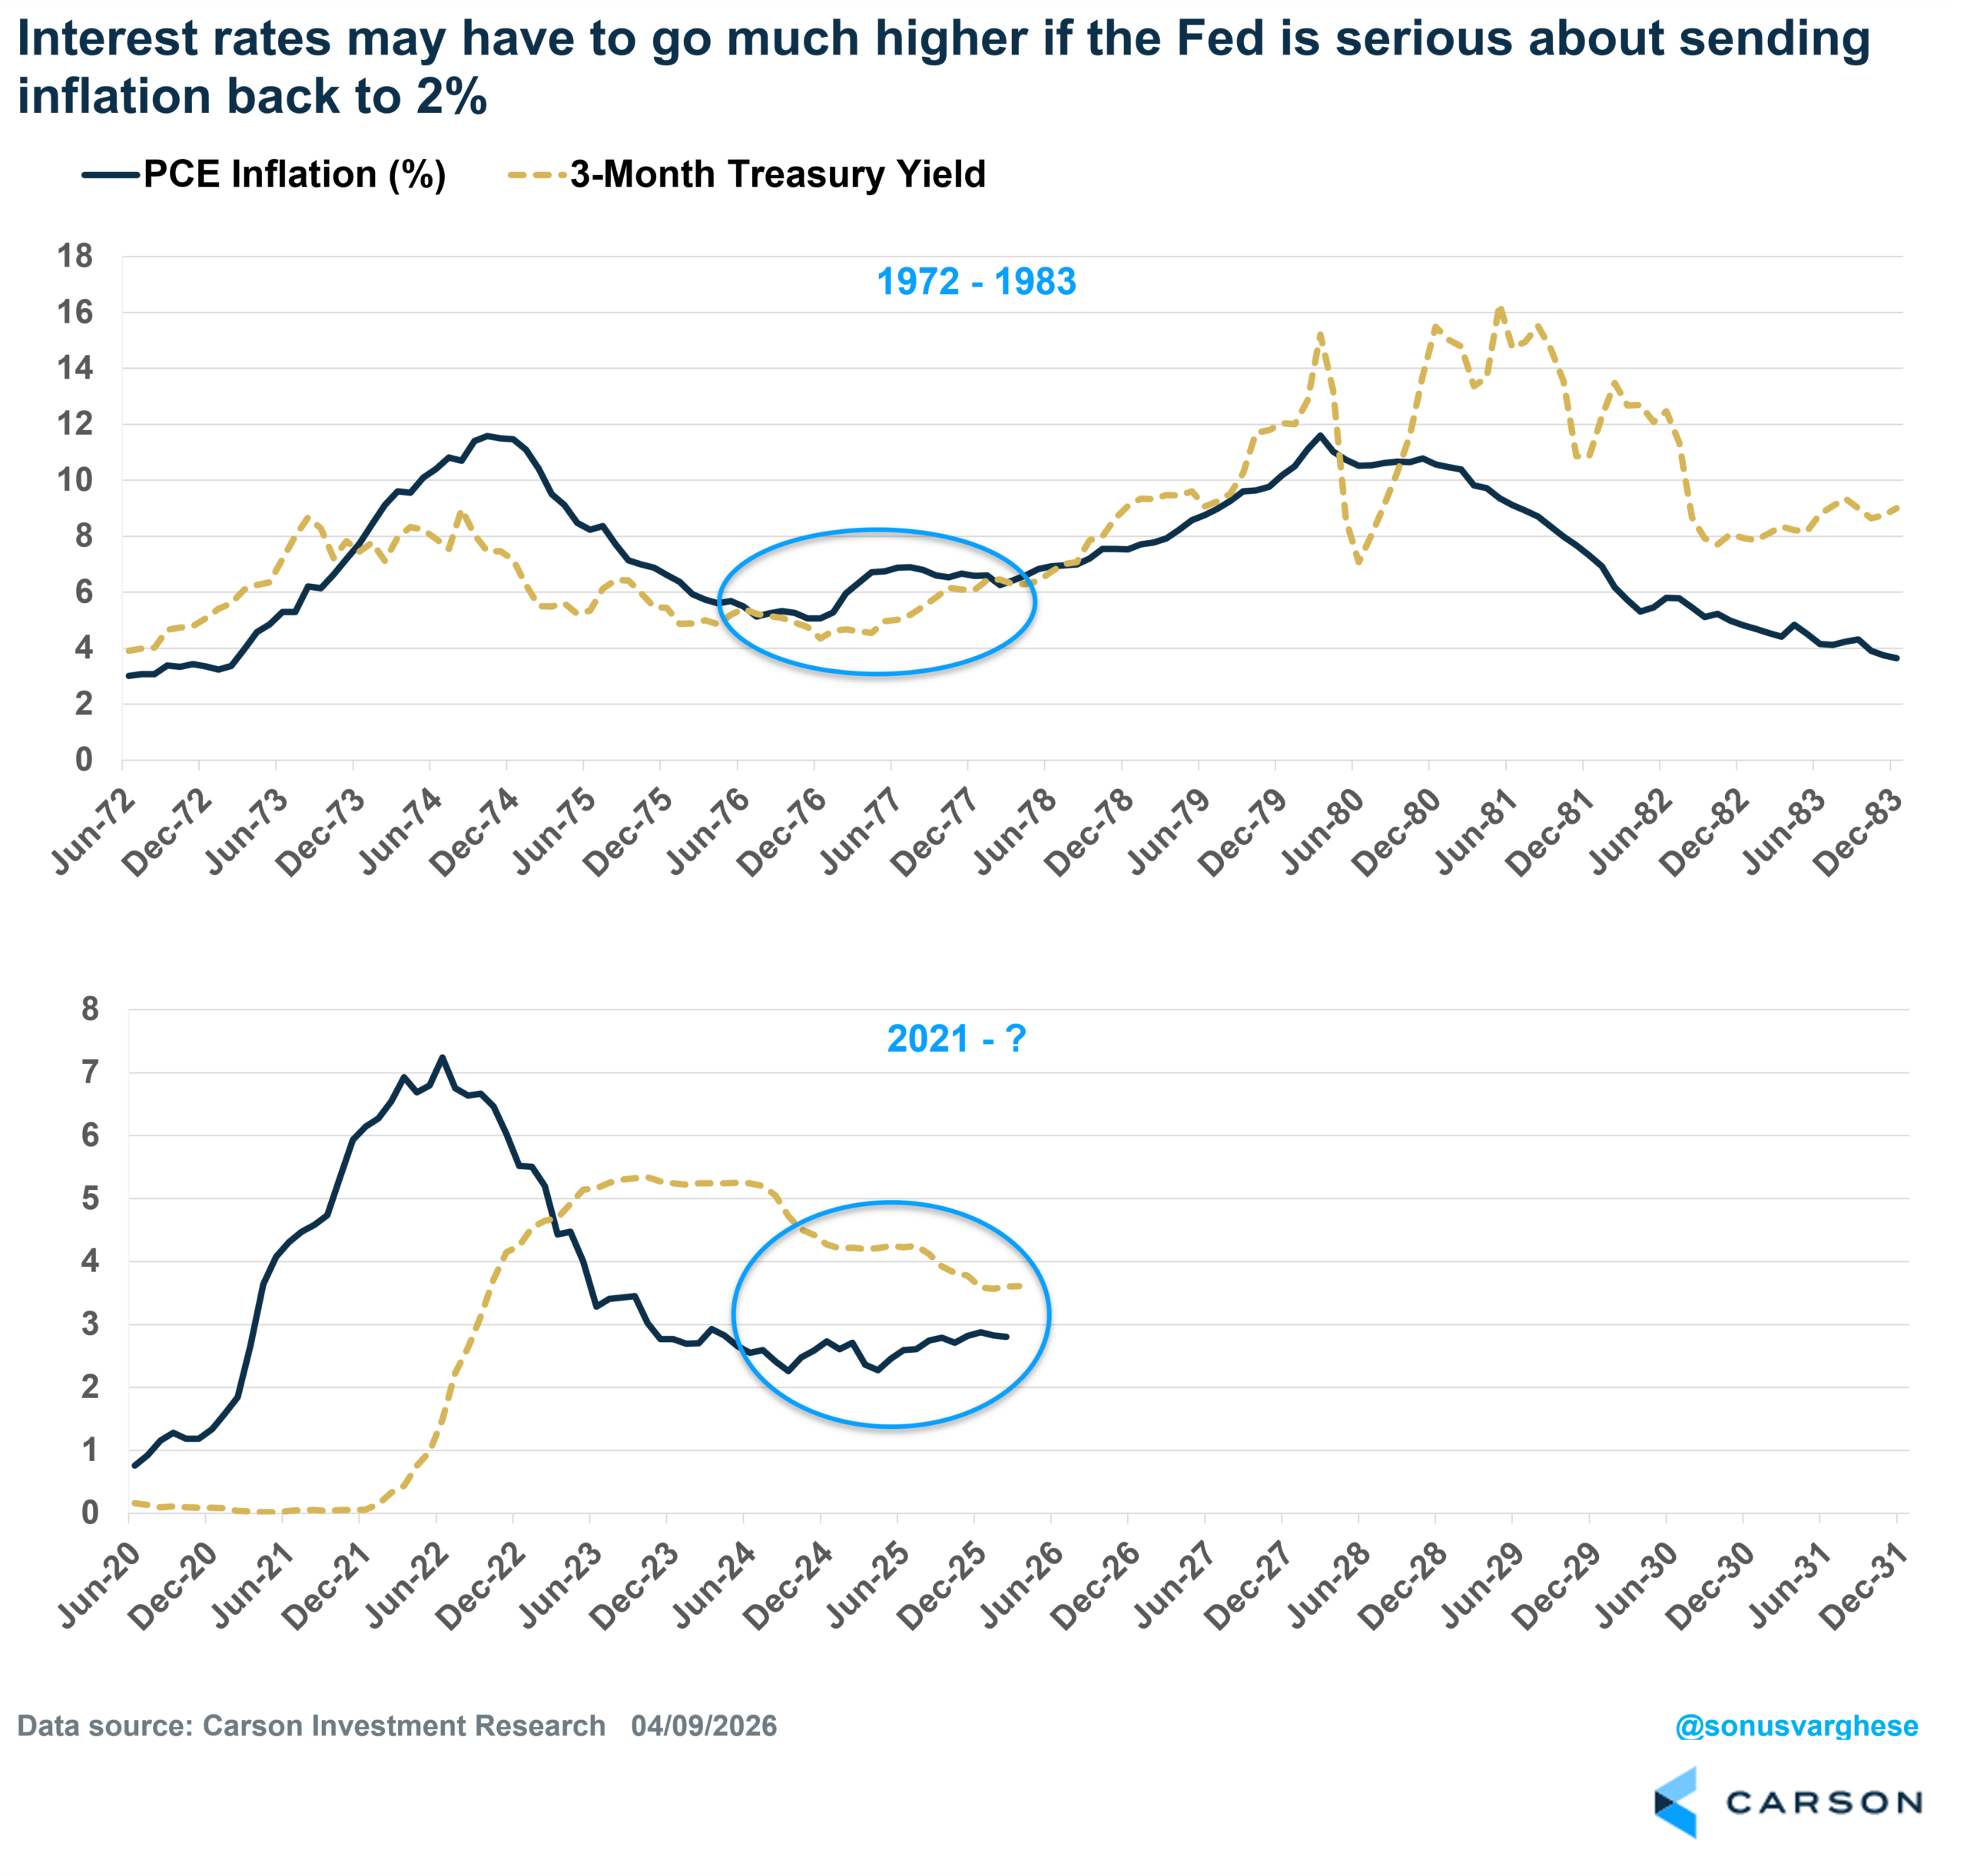
The unfortunate parallels to the 1970s are increasing right now.
- Inflation spiked in 1973-74 amid a food and energy price shock (and subsequent lifting of price controls).
- The Fed started to tighten policy in 1973, which eventually sent the economy into a recession.
- However, the Fed eased policy in late 1974, and took interest rates much lower.
- Inflation pulled back from the big spike, falling from a peak of almost 12% (using PCE) to around 5-6%, but it didn’t pull lower as the Fed took its foot off the brakes.
- Eventually, we got a second inflation spike amid another food and energy price shock in 1978-79, which sent inflation back to 12%.
- Fed Chair Paul Volcker came in and raised rates to over 15% to ultimately crush inflation, in the process sending the economy into a big recession
This sounds eerily familiar, especially the first few steps. The levels of inflation and rates are lower than in the 1970s, but that doesn’t mean we don’t have a problem.
- We got the big post-Covid inflation spike in 2021-22, which took PCE inflation to over 7%.
- The Fed raised rates to over 5%, but pulled them down to around 3.5% as inflation eased.
- Inflation now remains stubbornly around 3%, just as we face another inflation spike.
I’ve shown the 1970s and 2020s inflation episodes in the chart below (using headline PCE inflation), along with the three-month Treasury yield (using this as a proxy for policy rates). As you can see in the bottom panel, the gap between rates (yellow line) and inflation (dark blue line) is shrinking, even as inflation remains elevated. In other words, the fact that the Fed is easing rates even as inflation remains elevated means policy is getting more dovish even if rates stay the same.
The Fed does have another option: raise the inflation target from 2% to 3%. But that’s a slippery slope and Fed officials may be very reluctant to do that, as it’s a pretty surefire way of losing credibility with markets. Right now, markets do expect inflation to head back to 2%, but they also expect the Fed to keep rates higher for longer and even increase them after 2028, which is why the 10-year yield is sitting around 4.3%, about 0.7%-points above the current policy rate of 3.6%.
Over the last few years we’ve repeatedly discussed (in blogs and outlooks) the fact that we believe we’re in a higher inflation regime, with more inflation volatility. That has implications for traditional portfolio construction, including the diversification potential for bonds but also within the equity basket (which we believe should be more diversified now as it’s not obvious who the winners and losers may be). And the longer the Fed waits to tackle inflation, the larger the larger the eventual pivot they may have to make, and that’s going to create more volatility in markets. Just don’t be surprised when it happens.
For more content by Sonu Varghese, Chief Macro Strategist, click here.
8869900.1. – 10APR26A