“The only place success comes before work is in the dictionary.” Vince Lombardi
First things first, February maybe just started, but it has already seen a great deal of volatility around tariffs. The big question I have is, Should we be surprised? It turns out that February in a post-election year is actually the worst month of the year on average, so maybe we are simply due for some volatility? Perhaps.
Hear me out. Maybe it is quite common for the honeymoon period after the election from November – January to be just peaches, but then February comes and reality hits. Or maybe around February is when a President comes out with some of the more controversial policies? Just get them out of the way early and move forward? Whatever the exact reason, the S&P 500 has been down 1.3% on average in post-election years and whether it is higher has been a coinflip, so some volatility or weakness now shouldn’t be a surprise.

Taking this a step further, since 1950, over the past decade, and over the past two decades, the month of February has once again one of the worst months of the year for stocks.

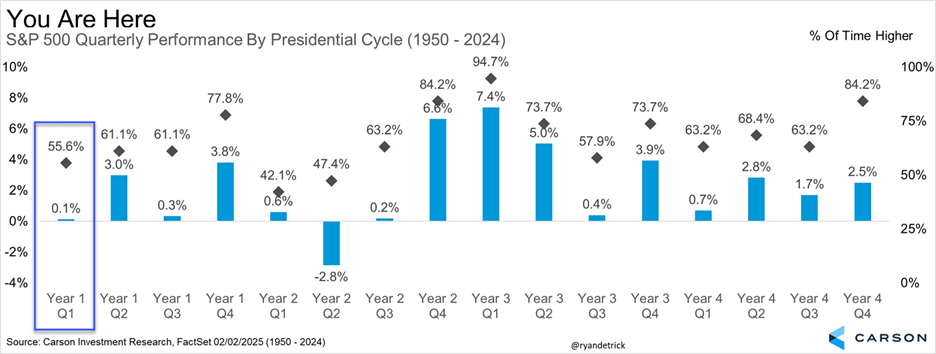
Breaking things down by the full four-year presidential cycle shows the first quarter of a post-election year is one of the worst in the entire four year cycle. Yes, January got off to a nice start, but the calendar isn’t doing anyone any favors right now.
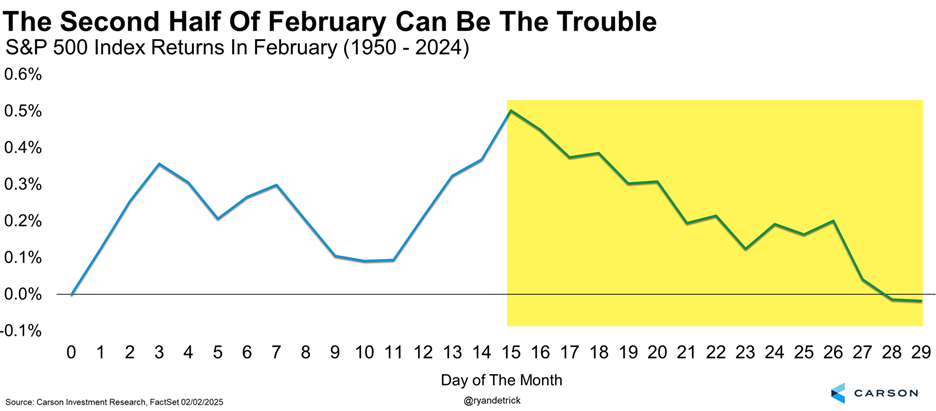
Lastly, the second half of February is historically the banana peel part of the month.
The Super Bowl Indicator
Now with the serious part out of the way, let’s get to the fun part of this blog.
First things first, don’t ever invest based on who wins the Super Bowl. Or what color Taylor Swift will wear at the big game, or the coin toss, or how bad the refs will be (who are we kidding, we know they want the Chiefs to win). With that out of the way, it is Super Bowl season, and that means it is time to talk about the always popular Super Bowl Indicator!
Stay on Top of Market Trends
The Carson Investment Research newsletter offers up-to-date market news, analysis and insights. Subscribe today!
"*" indicates required fields
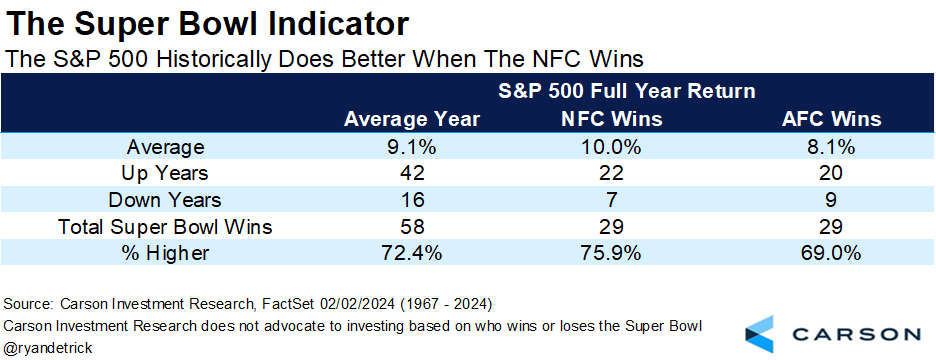
The Super Bowl Indicator suggests stocks rise for the full year when the Super Bowl winner has come from the original National Football League (now the NFC), but when an original American Football League (now the AFC) team has won, stocks fall. Of course, this is totally random, but it turns out that when looking at the previous 58 Super Bowls, stocks do better when an NFC team wins the big game.
This fun indicator was originally discovered in 1978 by Leonard Kopett, a sportswriter for the New York Times. Up until that point, the indicator had never been wrong.
We like to make it a little simpler and break it down by how stocks do when the NFC wins versus the AFC, ignoring the history of the franchises. As our first table shows, the S&P 500 gained 10% on average during the full year when an NFC team has won versus 8.1% when an AFC team has won. Interestingly, the AFC and NFC have each won 29 Super Bowls.
So, it is clear-cut that investors want the Eagles to ground the Chiefs and win, right? Maybe not, as stocks have gained over the full year 12 of the past 13 times when a team from the AFC won the championship, going back 21 years. In fact, the only time stocks were lower was in 2015, when the full year ended down -0.7%, so virtually flat.

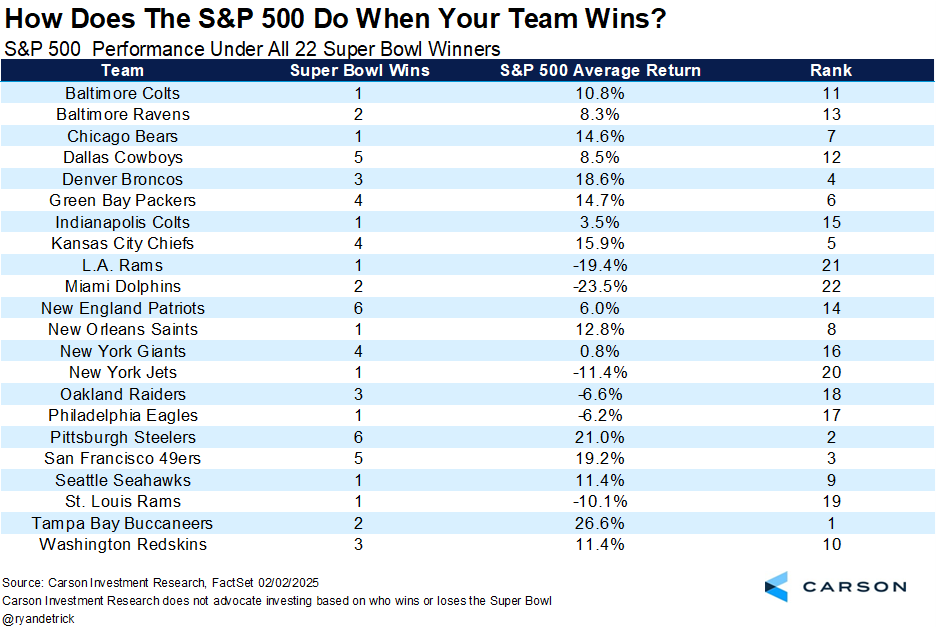
By my math, there have been 58 Super Bowls and 22 different winners. I broke things up by franchise and city. For instance, Baltimore has won three championships, but one for the Colts and two for the Ravens. So I differentiated the two. Then the Colts won one in Indy, so I broke that out as well. Either way, I still don’t see my Bengals on here, but I expect that to change next year! Remember, Joe Burrow is the only man who can beat Patrick Mahomes and Josh Allen with a 5-3 record against them combined and a winning record against both, but I digress.
Getting to the two teams in it this year, the Chiefs have won it all four times and stocks gained 15.9%, while the Eagles have won it all only once and stocks fell about six percent back in 2018.
It might not matter who wins, but by how much they win. That’s right, the larger the size of the win, the better stocks do. (Let’s have another disclosure that nearly everything I’m saying here isn’t in any way, shape, or form related to what stocks actually do.)
That’s right, when it is a single digit win in the Super Bowl, the S&P 500 is up less than 7% on average and higher about 62.5% of the time. A double-digit win? Things jump to about 11% and 79%. And wouldn’t you know it, when the final score is three touchdowns or more, the S&P 500 gained 13.6% for the year and is higher about 85% of the time.
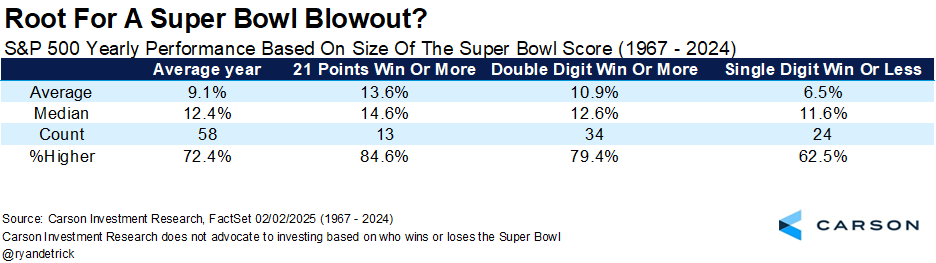
Here’s a list of all the big blowouts and what happened to stocks those years. Not too bad, huh?

Who should you root for? Personally, I can’t stand either team, but I guess I’ll just say when Philly wins a Super Bowl or World Series really bad things tend to happen. I’m honestly still not sure I can root for Mahomes and his ref buddies handing him another trophy even knowing this, but it is worth at least knowing.

Here are 12 other takeaways I noticed while slicing and dicing the data:
- The NFC and AFC have won 29 Super Bowls each.
- The past three Super Bowls have been decided by 3 points each, the closest three Super Bowls have ever been in a row (and small enough for a well-timed flag to make the difference).
- The Steelers and Pats have won the most at six, but the 49ers sit at five and the Chiefs could match them with a win.
- As great as Peyton Manning was, he only won two Super Bowls. His brother also won two. Odds are their kids will win a few more. Or maybe a nephew. (We’re looking at you Arch.) Omaha, Omaha!
- The Lions, Browns, Jags, and Texans have still never made the Super Bowl. I tried to tell all my Lions friends it wasn’t happening!
- The NFC won 13 in a row from 1985 (Bears) until 1997 (Packers).
- The Bills made the Super Bowl four consecutive years, losing each time.
- The highest scoring game was 75 total points in 1995 between the 49ers and Chargers.
- The lowest scoring game was only 16 points in 2019 when the Pats beat the Rams.
- The closest ever was a one-point win for the Giants over the Bills in 1993 (the Scott Norwood game).
- Three years ago my Bengals were hosed with a horrific holding call in the endzone at the end of the game to literally hand the Rams the game. The script is real my friends.
- In 1990 the 49ers beat the Broncos by 45 for the largest win ever.
So, there you have it, your complete breakdown for the big game. I’m saying the Eagles, as I can’t believe the NFL would rig another game for the Chiefs with the whole country watching! Have fun and here’s to moving President’s Day to the day after the Super Bowl, one thing we all can agree on!
For more content by Ryan Detrick, Chief Market Strategist click here.
7606187-0225-A