
“I’ve missed more than 9,000 shots in my career. I’ve lost almost 300 games. Twenty-six times, I’ve been trusted to take the game winning shot and missed. I’ve failed over and over and over again in my life. And that is why I succeed.” -Michael Jordan
One of the big knocks we keep hearing about this bull market is that it is being led by only a few names. I was on Fox Business with Charles Payne yesterday and the guest before me was spouting off the same stats we’ve been hearing for months now. It has been widely reported that the largest two stocks in the S&P 500 (Microsoft and Apple) represent close to 40% of the rally this year and the FAANG names (Meta (formerly Facebook), Amazon, Apple, Nvidia, and Alphabet (formerly Google) account for about 80% of the year-to-date gains.
Here’s what they don’t tell you, this is perfectly normal. You will always have the best stocks account for most of the gains. I compare this to the Chicago Bulls when they won six championships. Just because they had the best player of all-time, do those trophies not count the same? You want your best players to score most of the points. Steph Curry just dropped 50 in game 7 of a series and I’m pretty sure they advanced to the next round, even though he scored most of his team’s points.
Stay on Top of Market Trends
The Carson Investment Research newsletter offers up-to-date market news, analysis and insights. Subscribe today!
"*" indicates required fields
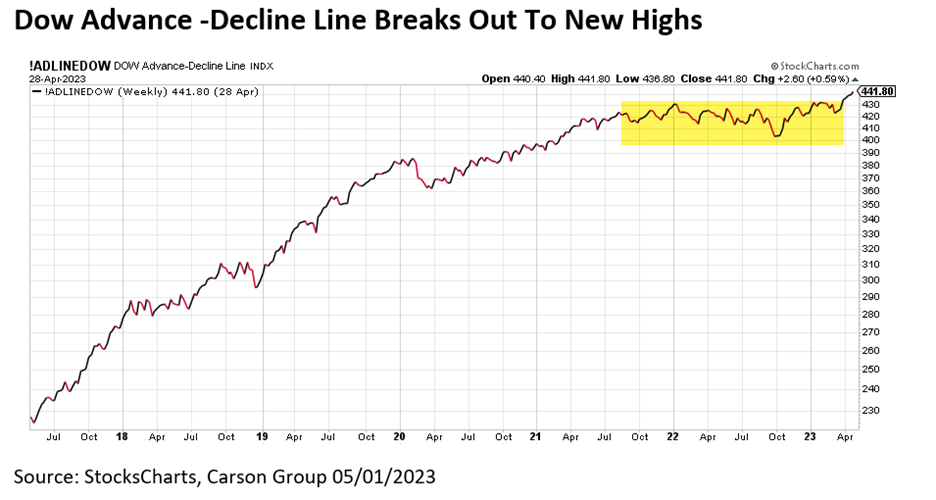
Again, your leaders are your leaders and they will count for much of the gains, but the truth is many stocks are going higher. What’s the easiest way to show that it isn’t just a few stocks that are going higher? I like to use advance-decline (A/D) lines for this purpose. An A/D line is simply a cumulative total of how many stocks went up or down each day. Throughout history, we’ve seen A/D lines break out to new highs before the indexes, while they also breakdown well ahead of actual price. This is one of the best ways to see what is really happening under the surface.
Well, the Dow A/D line recently broke out to new highs after consolidating for more than a year. With the Dow itself about 6% away from new highs, this is a clue that the nearly 125-year-old index will probably be following the A/D line to new highs sooner than later.
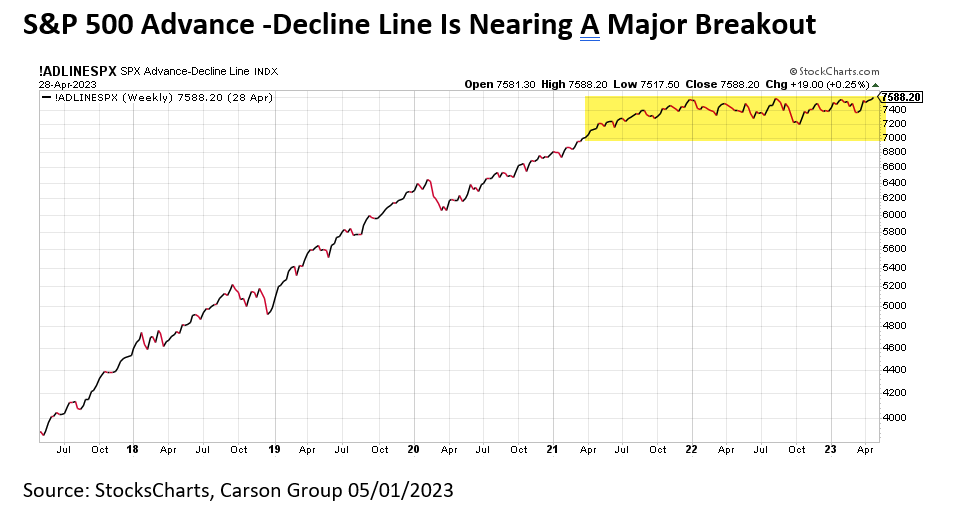
Turning to the S&P 500 A/D line we see another potentially bullish scenario. This one hasn’t quite broken out to new highs, but it is extremely close. Take note how this has trended sideways for the duration of the recent bear market, implying the tailwind for a bull market wasn’t happening. Well, should this breakout (like we expect), it very well could suggest continued strength the rest of 2023 and potentially further.
Watch my interview with Charles Payne below. I’m a huge fan of Charles and I always have so much fun chatting with him!
