
“Americans will always do the right thing – after exhausting all other possibilities.” -Winston Churchill
With Super Tuesday now in the books, the fact that we have a presidential election coming this November is getting very real. Although we aren’t going to predict who will be our next president, we are going to share many of our favorite charts and tables to know this election year.
Without further ado, here are 16 charts to know this election year.
Stay on Top of Market Trends
The Carson Investment Research newsletter offers up-to-date market news, analysis and insights. Subscribe today!
"*" indicates required fields
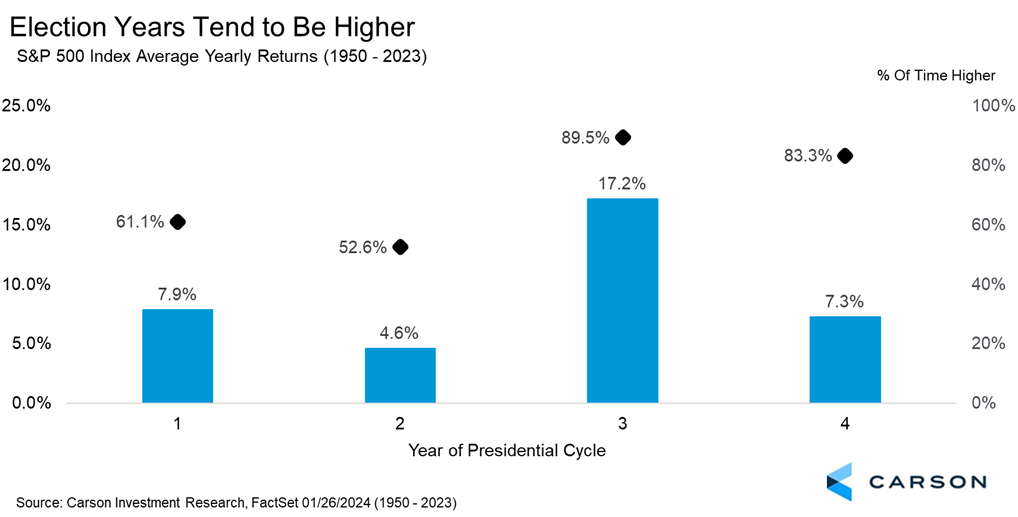
The best year for stocks is a pre-election year (like 2023), while midterm years (like 2022) are the worst. Election years gain 7.3% on average, but are higher a very impressive 83.3% of the time.
“I don’t make jokes. I watch the government and report the facts.” -Will Rogers
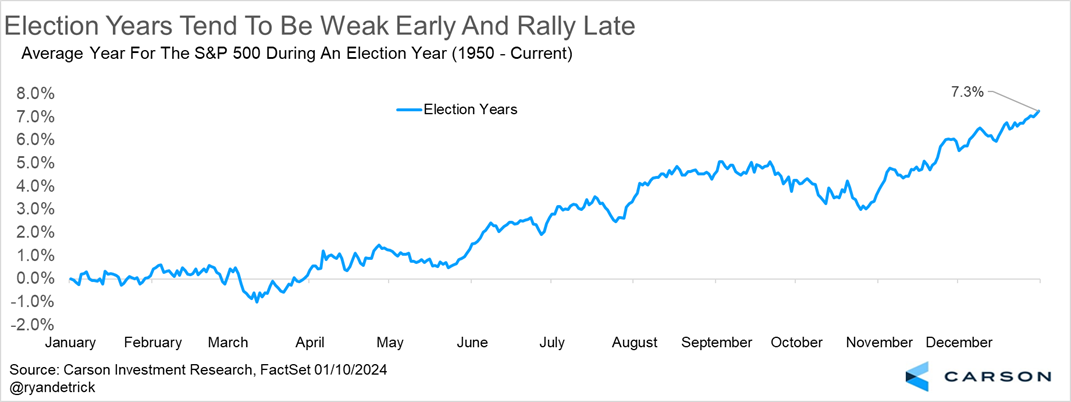
Be aware the majority of that 7.3% gain tends to happen later in the year, as stocks are historically down for the year in March of an election year. After solid mid-year gains, the S&P 500 has stalled, on average, in the immediate pre-election months when uncertainty is at its highest, before rallying after the election into the end of the year as markets gain clarity on what they have to work with, both in the White House and in Congress. But gains are steadier throughout the year (after a slow first quarter) when a president is up for re-election (see below).
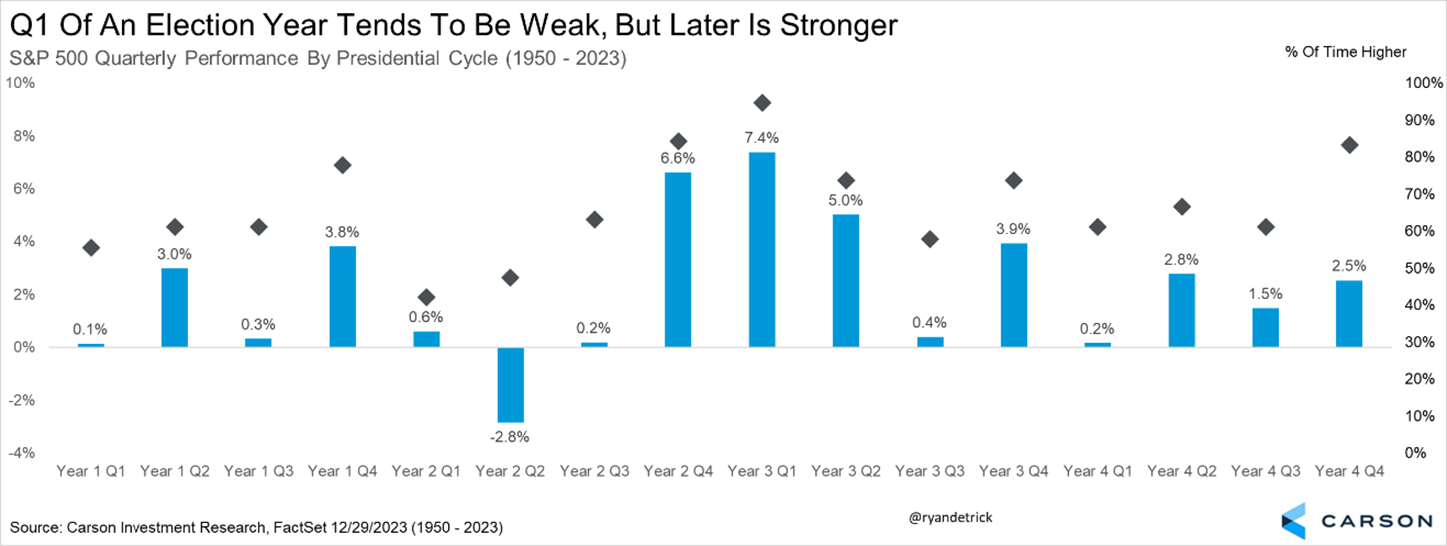
Breaking down the four-year presidential cycle by quarters shows the first quarter of an election year usually isn’t very strong, while the best quarters are the fourth quarter of a midterm year and early in a pre-election year, exactly how things played out this time.
“The problem with political jokes is they get elected.” -Henry Cate VI
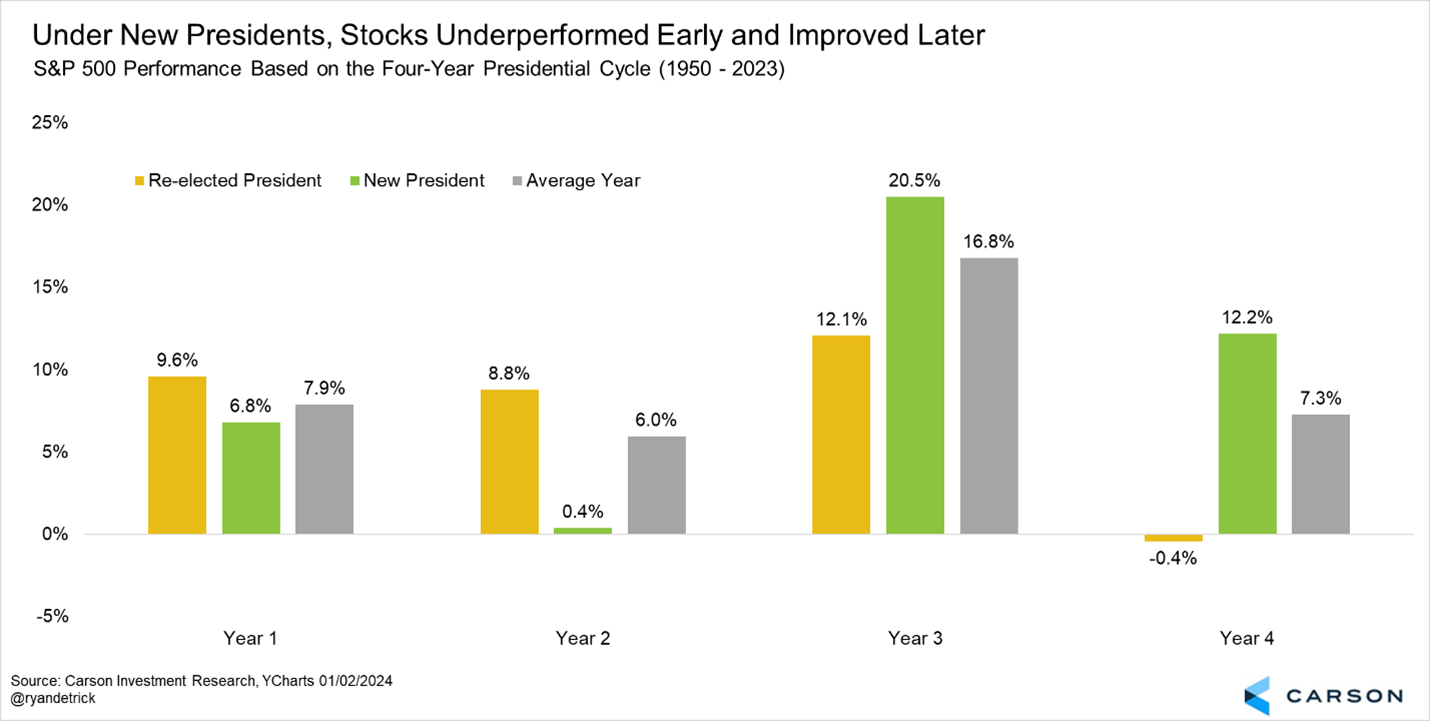
Historically, stocks have done much better in a pre-election year under a president in their first term (up more than 20% on average), while midterm years for a new president do much worse (virtually flat). That played out this time, with stocks down big in 2022 and bouncing back big in 2023. What matters now is election years, which have seen stocks do much better when a president is up for re-election versus a lame duck president.
Breaking this down more showed that stocks gained during an election year the past 10 times when the president was up for re-election. Not to be outdone, pre-election years have been higher nine of the past 10 times a president was up for re-election.
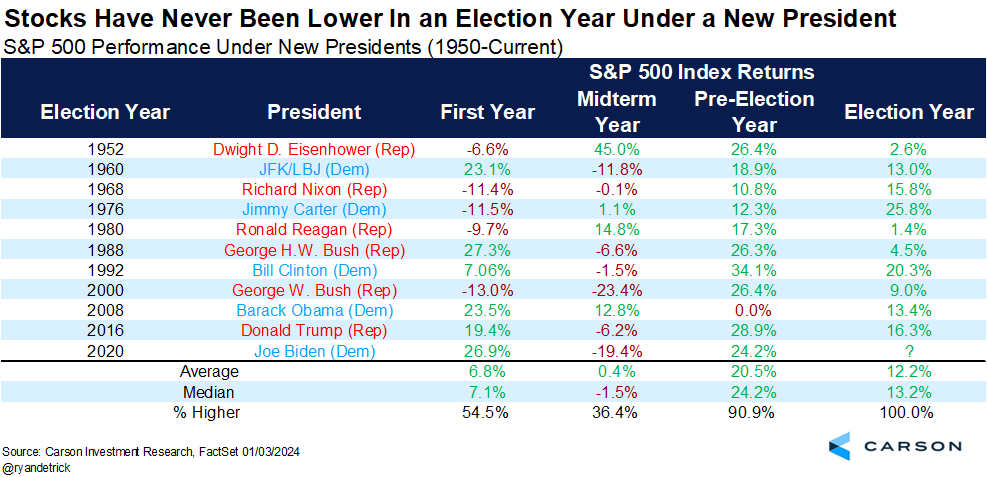
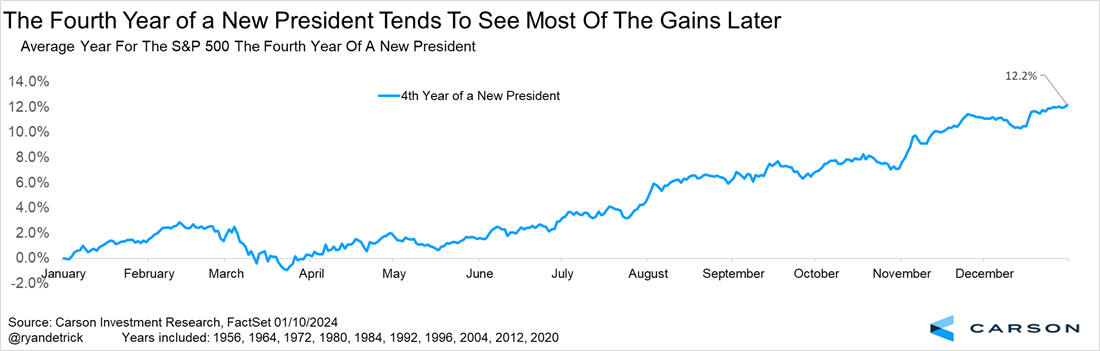
The majority of those 12.2% gains an election year of a first-term president indeed tended to happen later in the year though, as we show below.
“George Washington was the only president who didn’t blame the previous administration.” -Source unknown
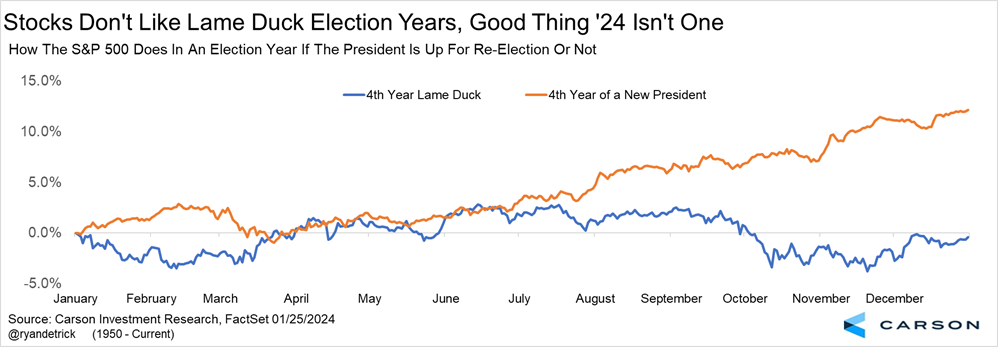
Here’s another way to show how election years do based on whether the president is up for re-election or we have a lame duck president. It’s pretty clear things go better when a president is up for re-election.
“The best argument against democracy is a five-minute conversation with the average voter.” -Winston Churchill
Interestingly, a negative return in a midterm year (like we saw in 2022) has been followed by a higher pre-election and election year every single time. That is 17 out of the past 17 pre-election and election years higher after a negative midterm year. Do you really think this will be the year this amazing streak ends? We don’t and are looking for 18 out of 18.
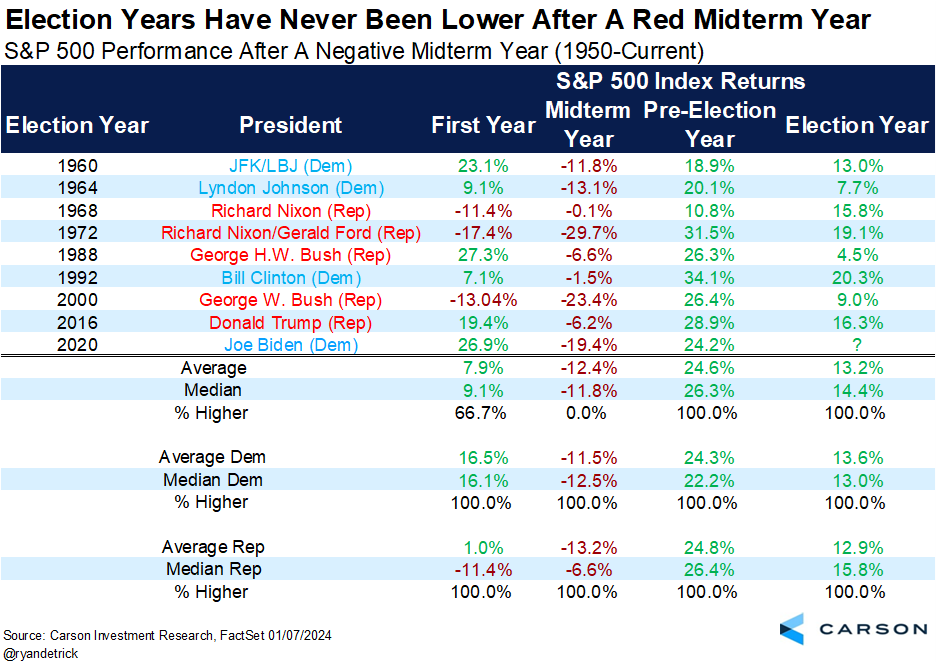
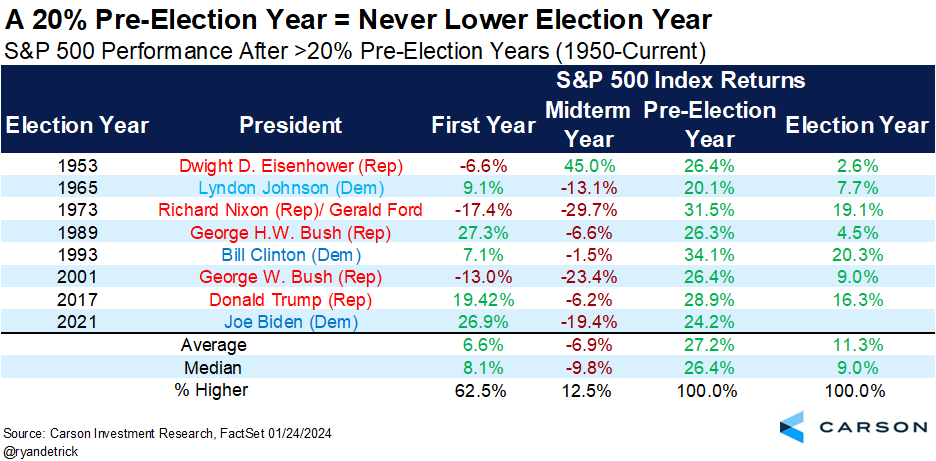
Another angle on this is after a 20% gain in a pre-election year, we’ve had a higher election year the past seven times going back to 1950. Also, look at how normal it is to have red in a midterm year, then a big bounce the following year. If this tendency continues to play out, it’ll be more good news for 2024.
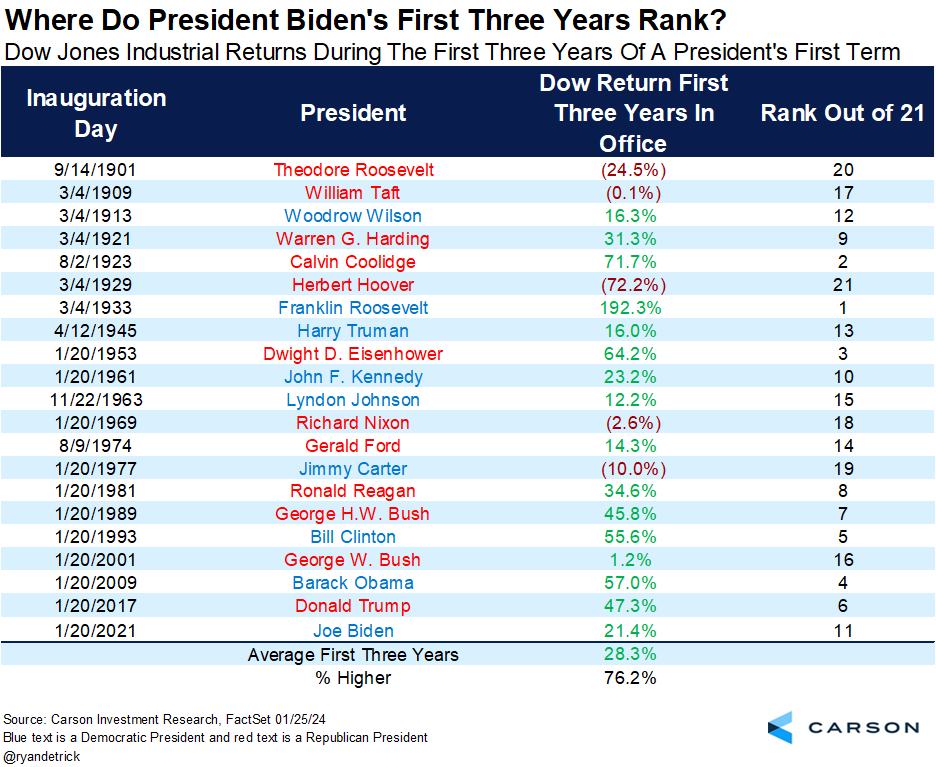
How have stocks done under President Biden? Don’t shoot the messenger here, but the Dow was up 21.4% his first three years in office, which ranks 11th out of the past 21 Presidents using Dow data back to 1900.
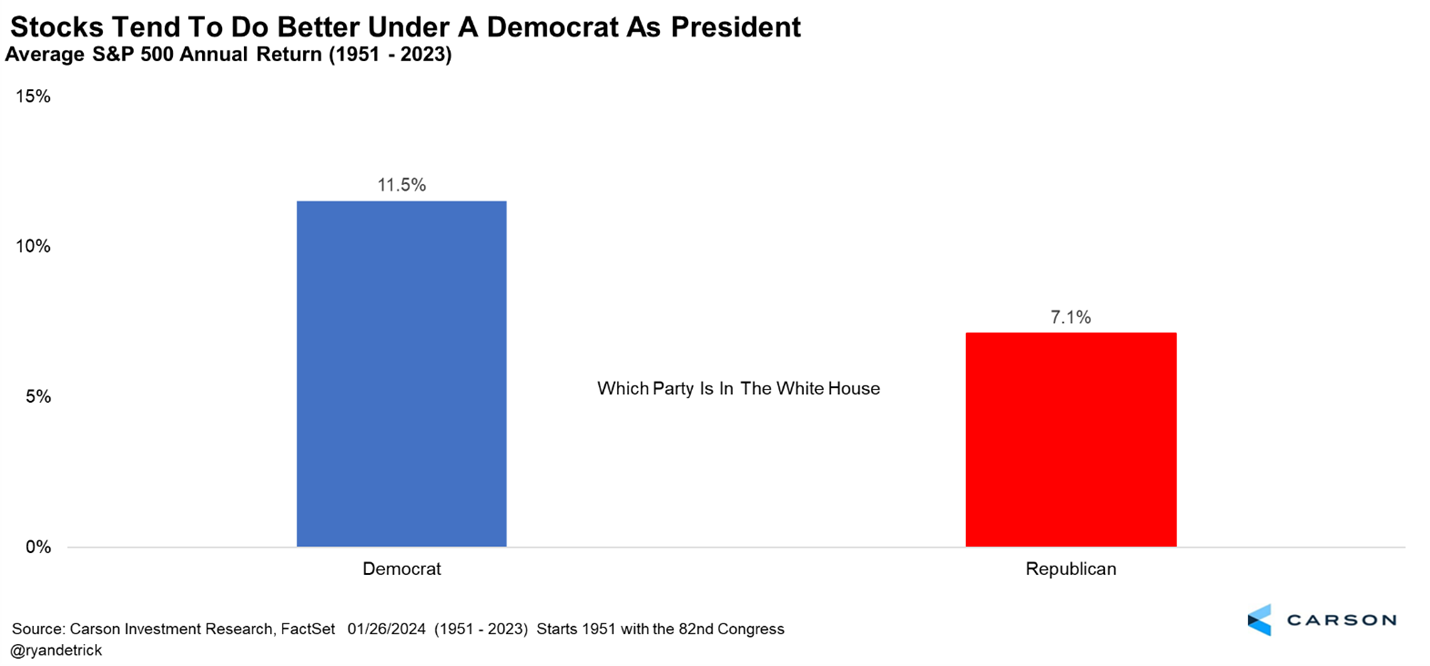
Another popular question is how stocks do based on which party is in the White House. Now is when people might want to throw something at me, but it is what it is. Historically, stocks have done better with a Democratic president versus a Republican in power. As with many of these numbers, we would take this with a grain of salt. Despite the tendency to view the president as responsible for the economy, the president alone often has a relatively small impact compared to broader economic forces. Do you think the fact that 10 of the last 11 recessions started under a Republican president is because a Republican was in the White House? We don’t.
“If the opposite of ‘pro’ is ‘con’, then the opposite of progress must be Congress.” -Sam Stovall
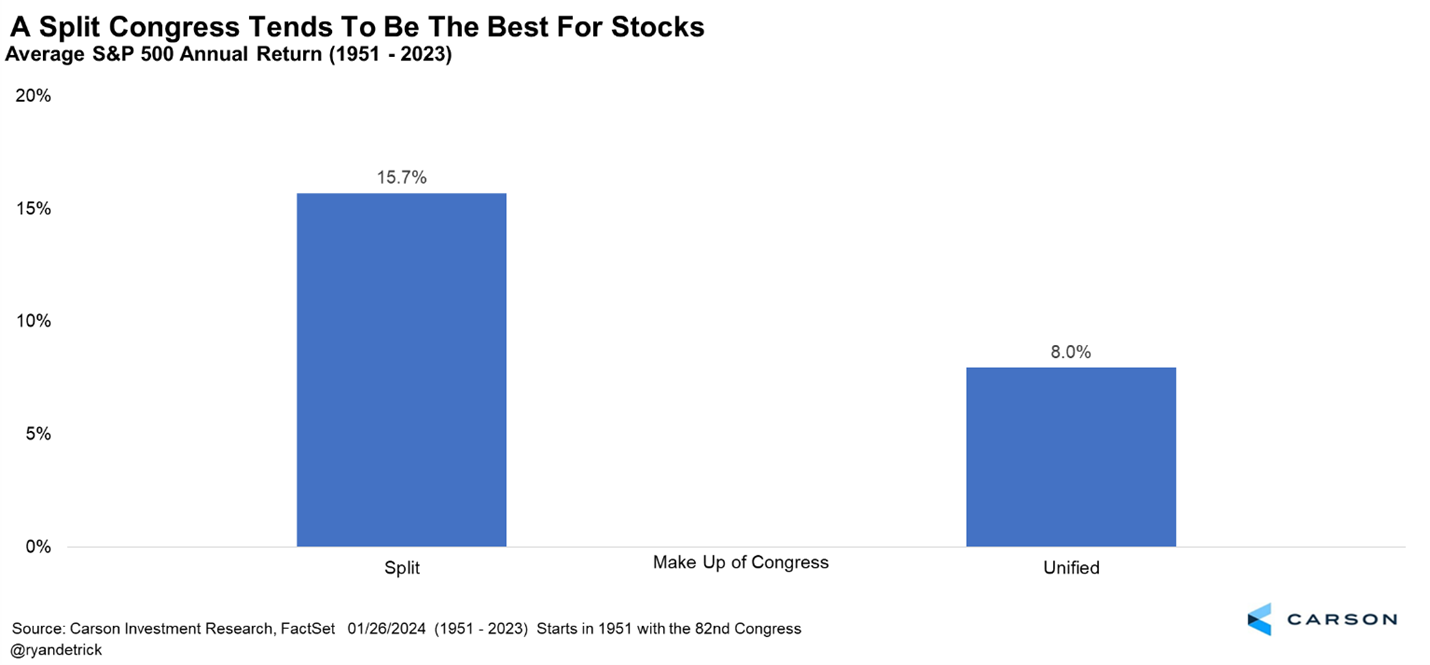
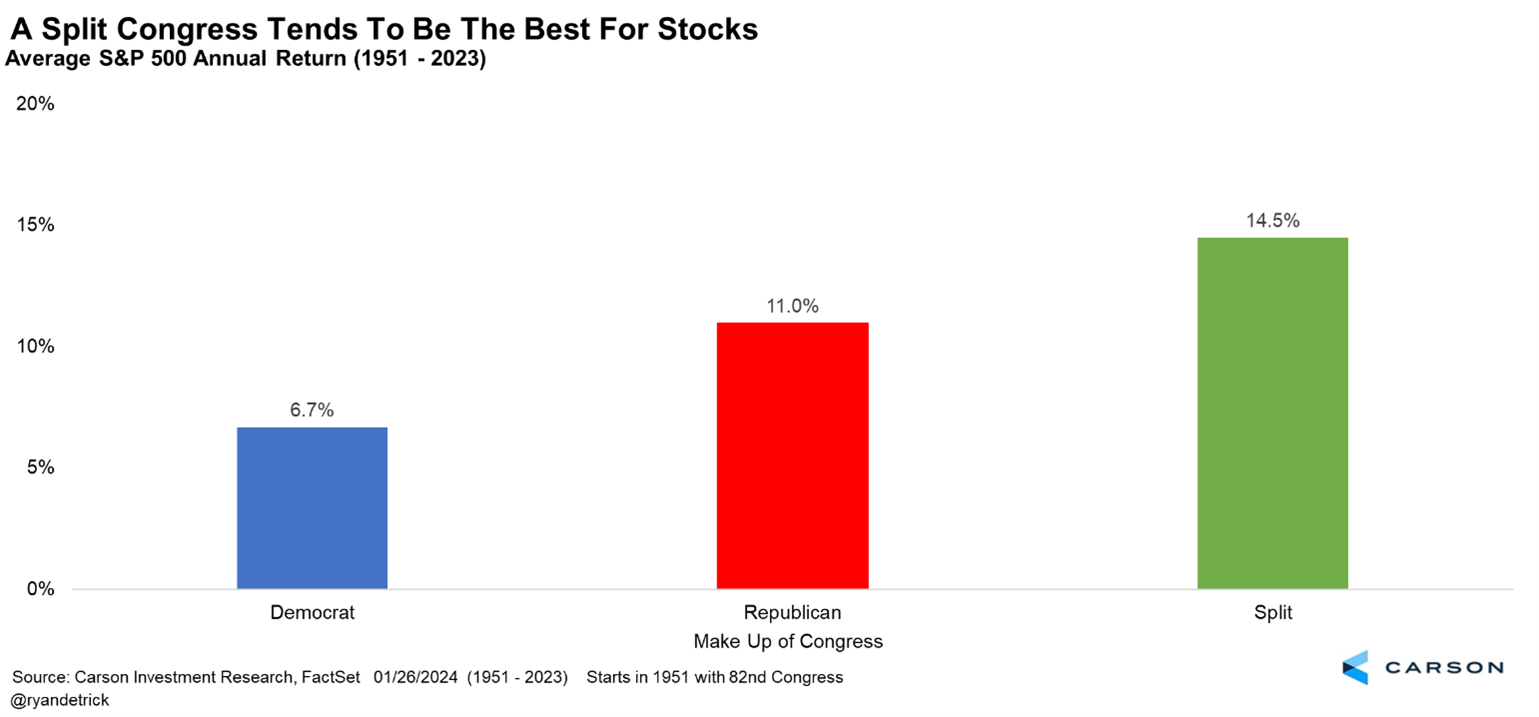
Who is in the White House can matter, but we’ve found the make-up of Congress might matter more. In fact, a split Congress has been much better for investors, as stocks incredibly have gained the past 13 times we’ve had a divided Congress! Maybe the best Washington is one that can’t get anything done? Or maybe it’s that what does get done requires compromise and common cause and is not just political overspending to reward constituents. Those checks and balances the founders put in place might be even more important than we realized.
Speaking of which, let’s not forget what friend of Carson Investment Research Sam Stovall once told us. If the opposite of ‘pro’ is ‘con,’ then the opposite of progress must be Congress! That’s a joke you can use all year now.
Here are all the possible scenarios based on the White House and make-up of Congress.
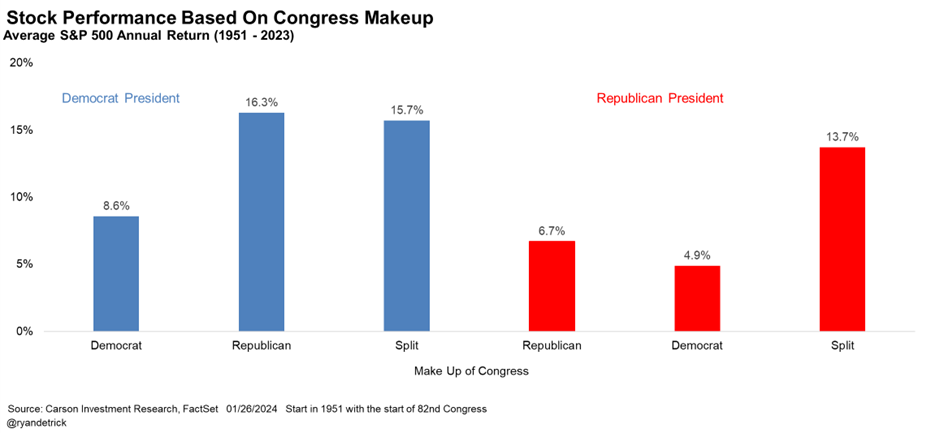
The way we like to put it, it isn’t about red or blue; it’s about green, as you can see below.
“If voting made any difference, they wouldn’t let us do it.” -Mark Twain
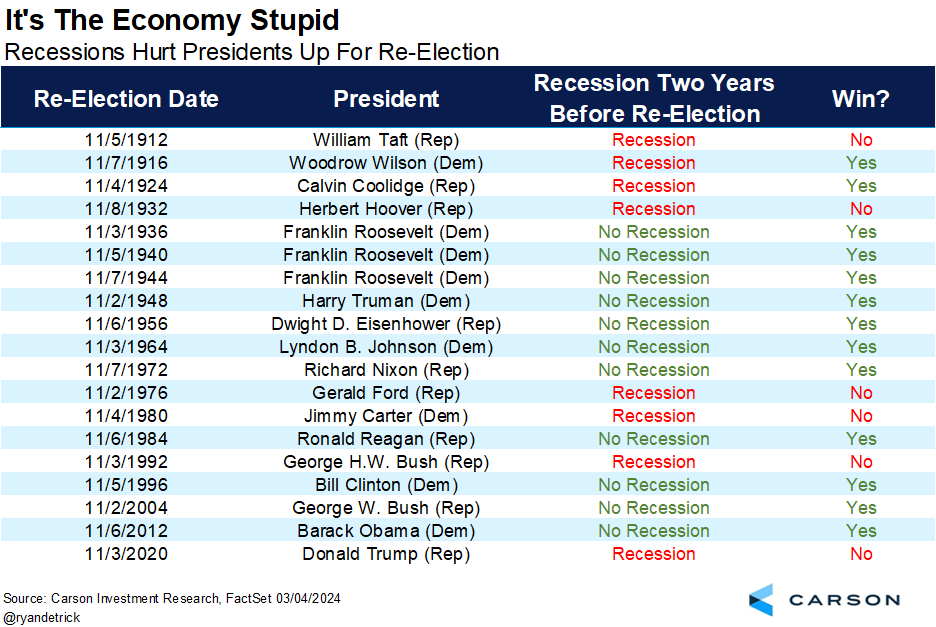
How investors feel going to the polls always matters, as we’ve found that if there was a recession in the two years before an election then a president up for reelection usually loses. And if there was no recession, they would usually win. In fact, this has worked every time since Calvin Coolidge way back in 1924, who was reelected despite a recession in the previous two years. But then Coolidge had only become president in August 1923 when President Warren Harding died unexpectedly, and the economy was already rebounding at that point.
“Bipartisan usually means larger than usual deception is being carried out.” -George Carlin
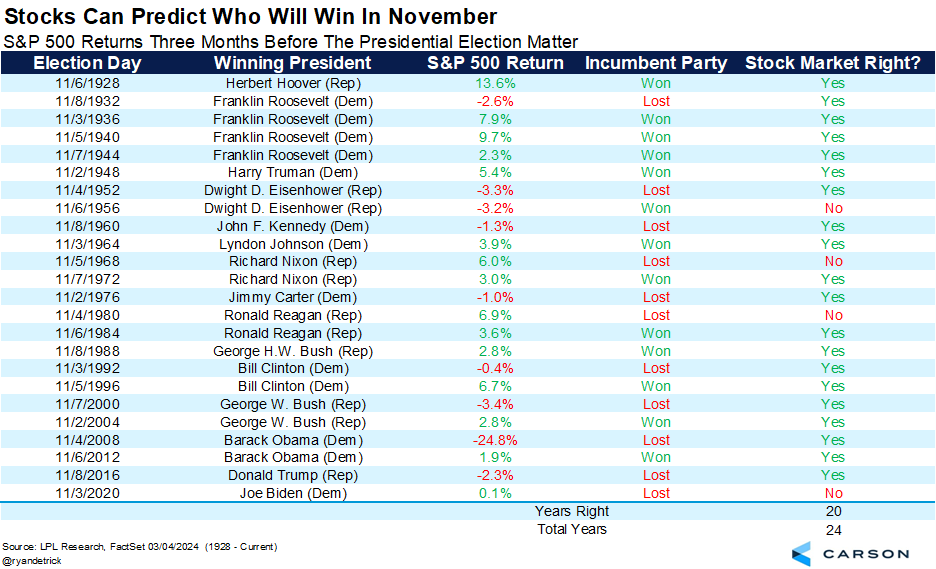
Lastly, how stocks do the three months before an election also has some predictive ability. If stocks are up, the incumbent party usually wins and if they are down, the incumbent party usually loses. This didn’t work in 2020, but it has worked 20 out of the last 24 elections.
“In America, anyone can become president. That’s the problem.” -George Carlin
In conclusion, we’ve seen many investors let their pollical beliefs get in the way of their investment choices, to their detriment many times. Some people didn’t like President Obama, but if they let that dictate how they invested they missed big gains. Likewise, some people didn’t like President Trump, but if they got out of the market because of it they also missed big gains. And currently President Biden’s approval rating is quite low, but stocks have soared and are at all-time highs. The bottom line is a strong economy is what will drive stock gains, not who is or isn’t in the White House.
For more on the latest out of Washington, Sonu Varghese, VP, Global Macro Strategist, and I were joined by Libby Cantrill of PIMCO last week to discuss it all. Libby is amazing and you’ll love this conversation.
For more of Ryan’s thoughts click here.
02144349-0324-A
