
Omaha in May brings value investors from around the world to the ‘Woodstock of Capitalism,’ a chance to listen to Warren Buffett opine on life and his latest investments. The event serves as a good reminder to take time to step back and look at the long term. After an April swoon, a May rebound, and a nearly complete earnings season, now is as good a time as any to review the current valuation picture.
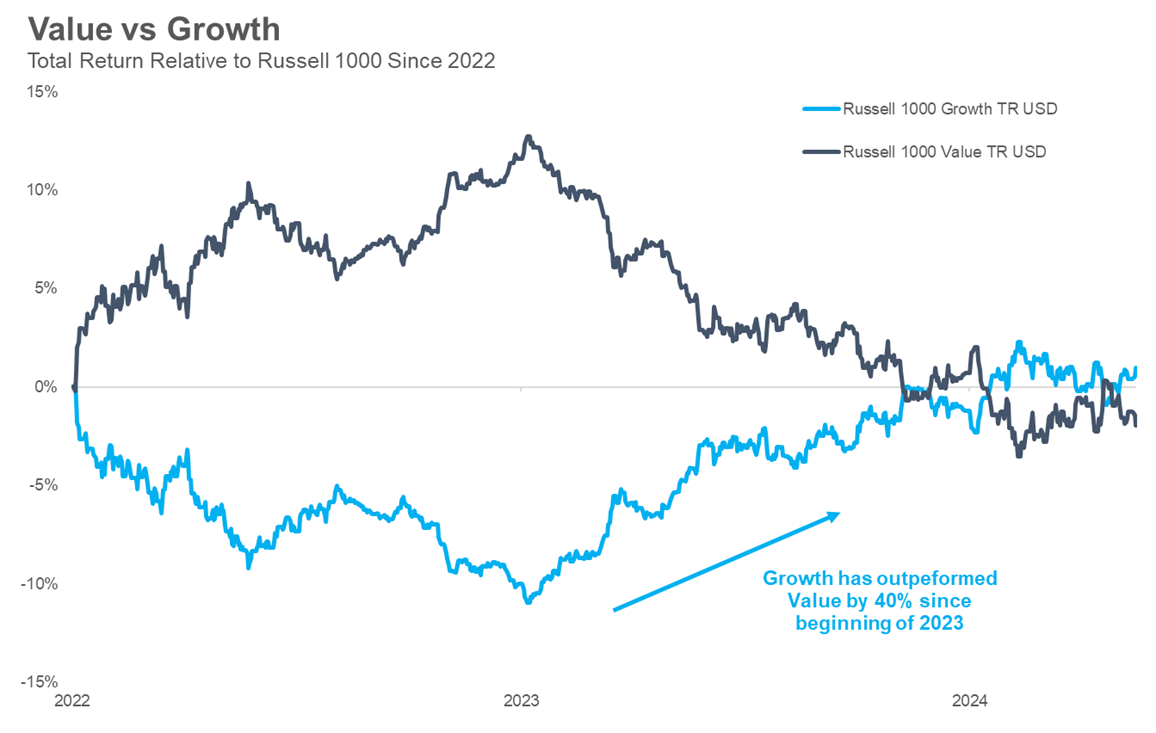
Resurgent interest rates have not been enough to slow the equity rally in 2024, as growth stocks have led the way once again, building on strength in 2023 on the back of AI hype and strong earnings results. Under the surface, we are seeing signs of waning strength in growth stocks and a broadening of participation in value stocks. For example, Nvidia (which reports earnings after the bell today) has added more than 4.5% to the year-to-date return of growth stocks just by itself, versus the largest contributor to value’s year-to-date return at only 0.5% (yes, it’s Warren Buffett’s Berkshire Hathaway) — much more balanced. This strength in the top growth names is nothing new but has pushed valuations to new highs relative to the rest of the market, where we are seeing a number of attractive opportunities.
Source: Carson Investment Research, Morningstar 5/16/2024
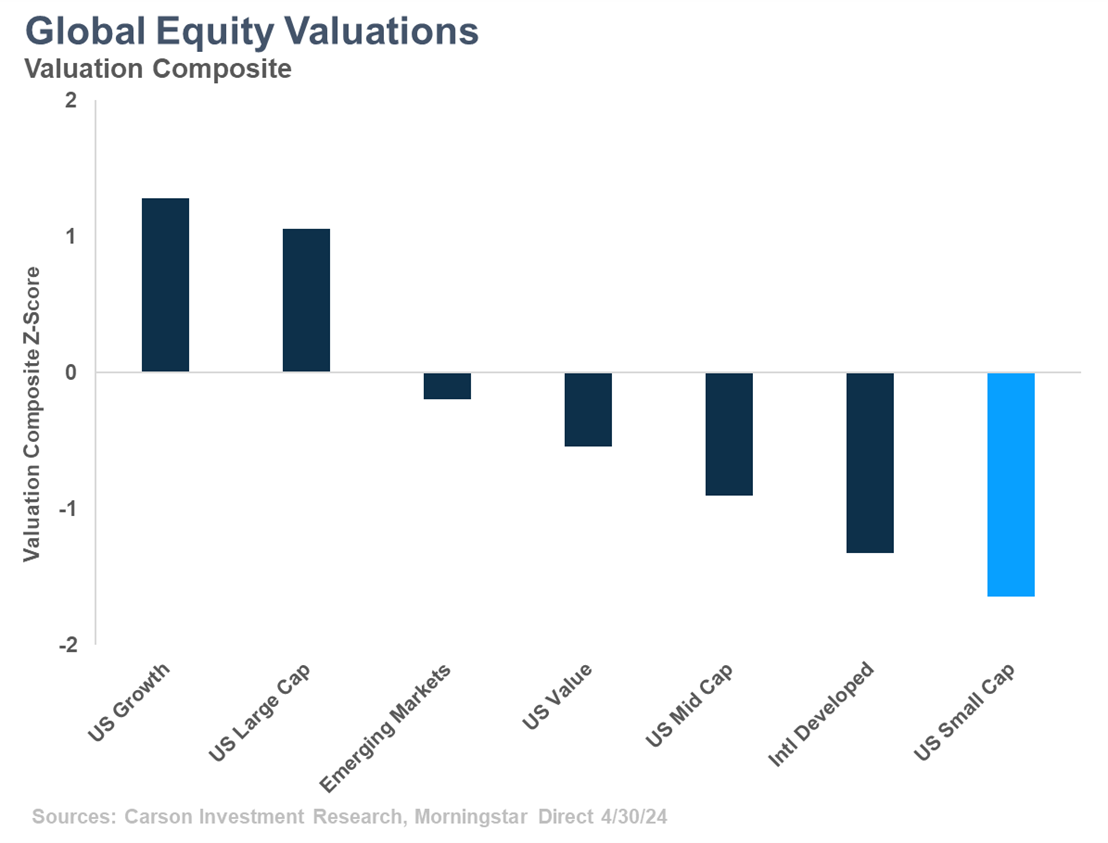
Below is a look at the valuations of the major equity asset classes around the world relative to the entire global stock market. Hopefully not a new chart, but as a reminder we use a composite of metrics to measure valuations and then look at the difference to their own history by displaying it in units of standard deviations (called a “z-score”). The story here has been similar for a number of years. (We talk about valuations not being a timing mechanism for a reason!) US Large cap stocks, dominated by large growth names, command a higher valuation relative to the global market than they normally have in their history. On the flip side, the remainder of the US market – value stocks, mid-caps, and small caps — all trade cheaper than they have historically, in some cases meaningfully so. US small caps trade nearly two standard deviations below where they have traded historically (on average). Put another way, US small caps have only been cheaper than they are today only 6% of the time! It should be mentioned that developed international markets also look attractive using this metric. We have seen some positive momentum in areas like Japan, but remain neutral as we observe the relative economic and price performance of these markets.
US vs International: Comparing Apples to Apples
This comparison uses as much history and as many valuation metrics as we can find in order to provide an unbiased view on where markets currently trade. As country, sector, and security weights change over time they will have an impact on these indices, but history should still be a reliable guide for comparison. That being said, we are often asked whether comparing domestic to foreign markets is “apples to apples” given the differences in sector and style weights, especially with technology’s prominence in US large cap indices.
Source: Carson Investment Research, Morningstar 5/21/2024
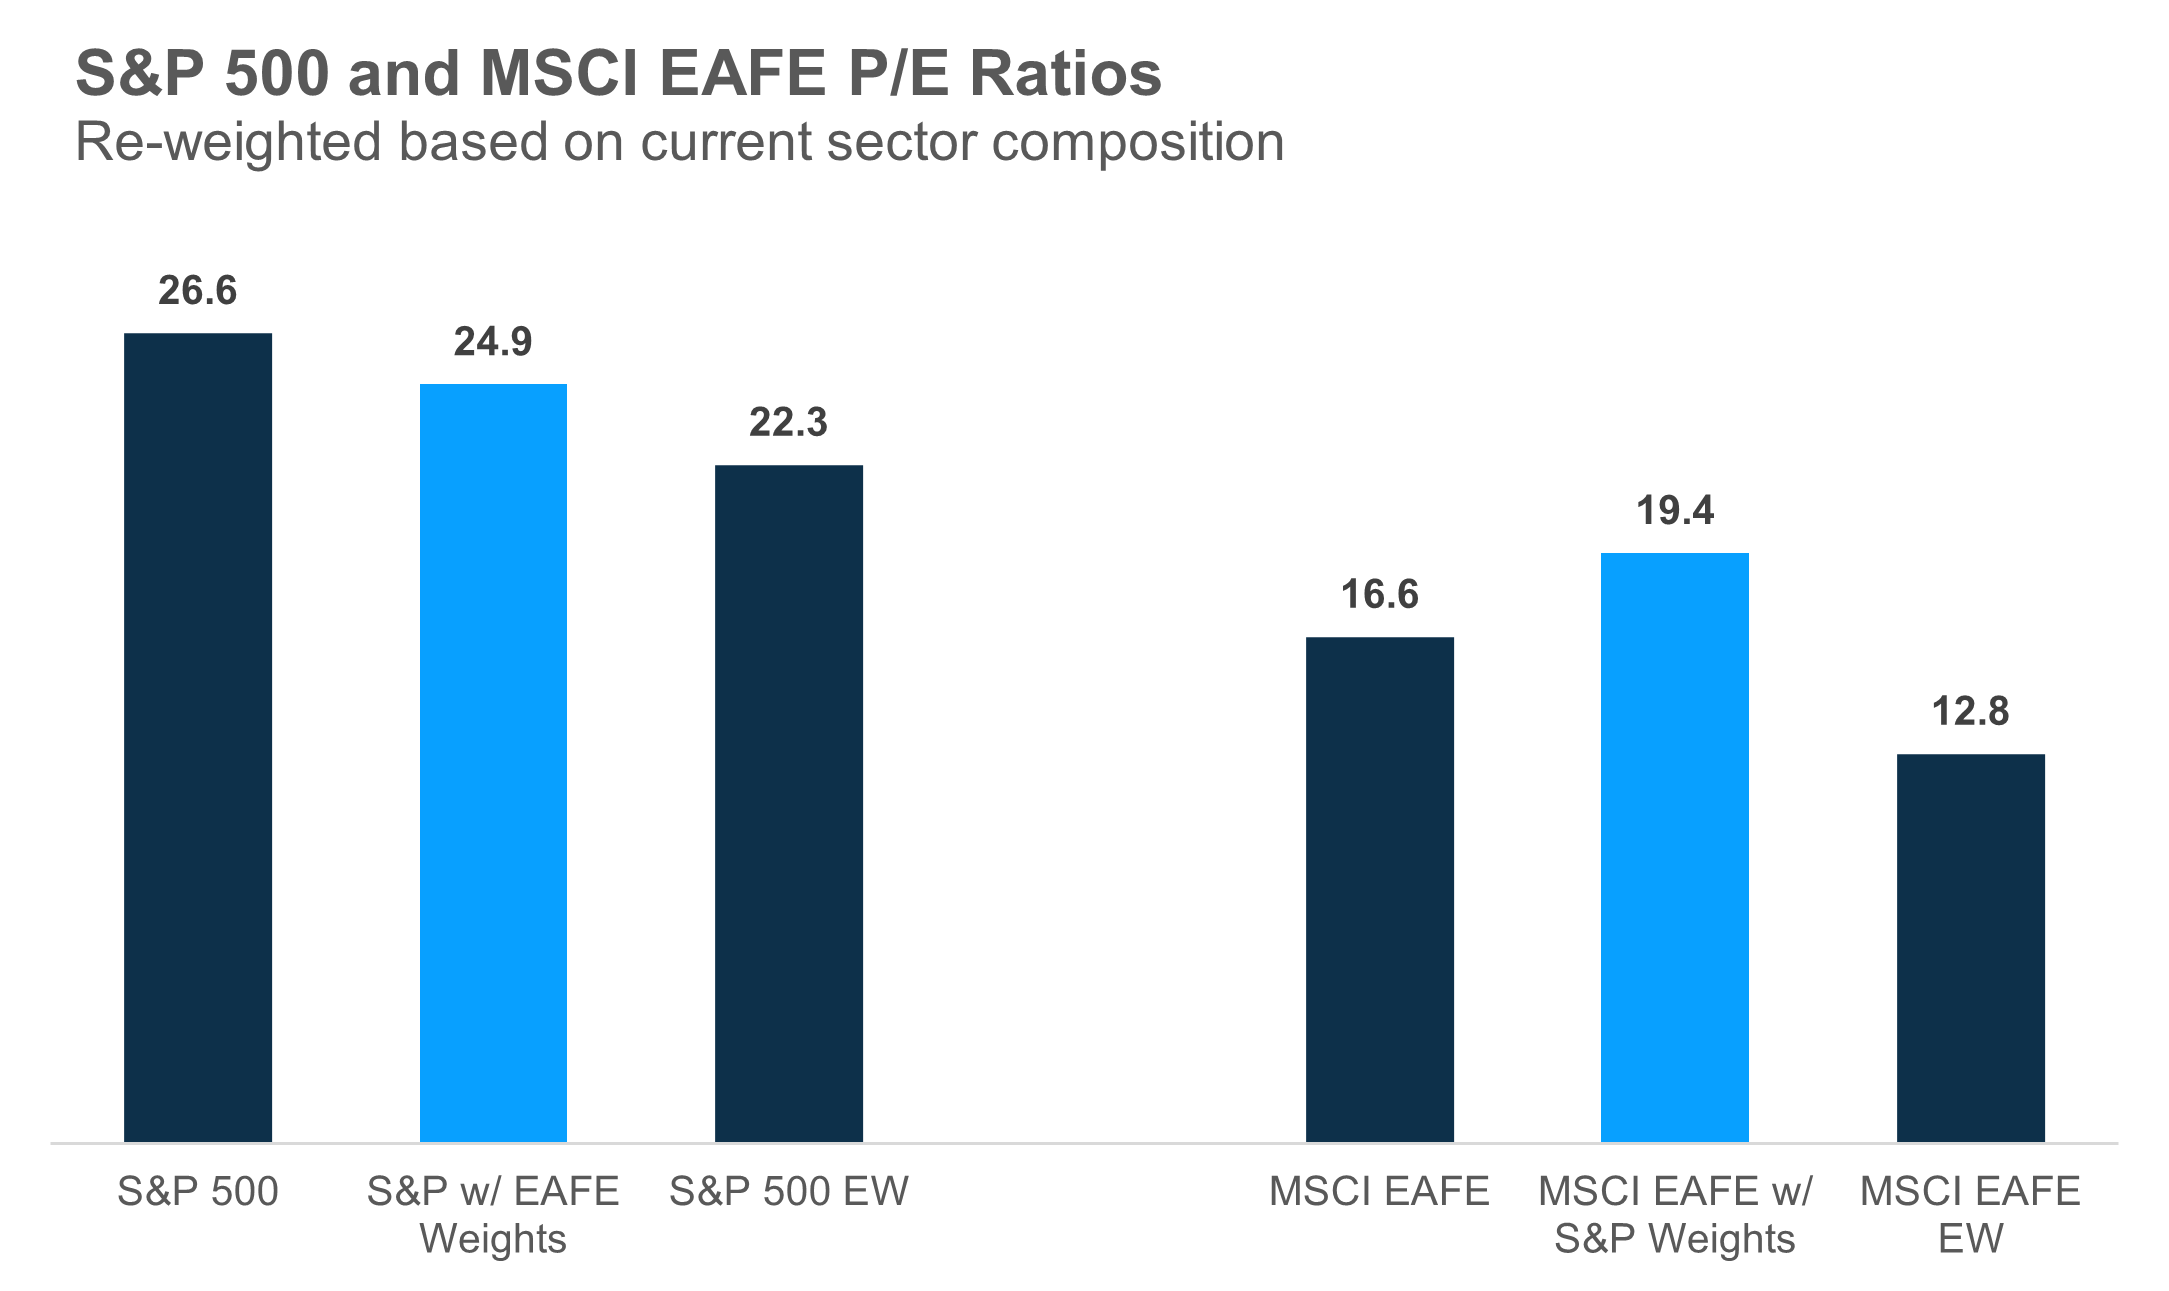
There are a number of ways to explore this idea, but one way is just to reweight domestic and international indices based on the other’s sector composition. For example, on the left, if we look at the S&P 500 yet, but with the same sector weights as the MSCI EAFE, the forward P/E ratio drops from 26.6 to 24.9 – a smaller drop than many would expect given the large differences in technology sector weights.
Stay on Top of Market Trends
The Carson Investment Research newsletter offers up-to-date market news, analysis and insights. Subscribe today!
"*" indicates required fields
Looked at another way on the right side, if we reweight the MSCI EAFE with S&P 500 sector weightings (i.e. more technology), we see P/E rise by roughly 3 points — meaningful but not extreme. The larger changes for both indices come into play when we look at equal-weighted P/E ratios. Both indices see a large drop in valuations — attributable to less expensive mid-cap stocks — but still remain separated by a wide margin. We believe the U.S. market deserves its premium to international markets, but when that premium becomes too high relative to history (as shown in the previous chart), we want to be thoughtful about what those extremes can mean going forward. Still, even in the US, we see opportunity to diversify out of the relatively higher valued areas (like growth stocks) and into lower valued pockets like mid- and small-cap stocks.
For more content by Grant Engelbart, VP, Investment Strategist click here.
02250333-0524-A