
“George Washington was the only president who didn’t blame the previous administration.” -Source unknown
How’s that for a title for a blog? Now that I have your attention, let’s talk a little bit about election years.
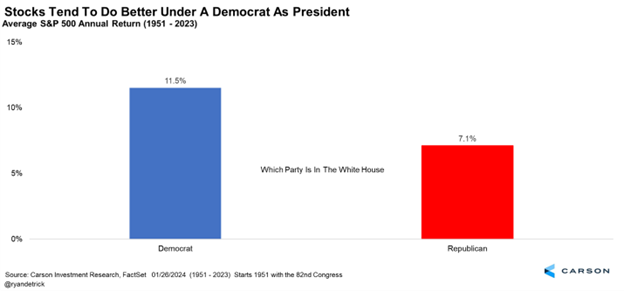
We are getting the question of who is better for stocks a lot lately and given the election coming up, this question isn’t going away. Starting with the 82nd Congress in 1951, we found that the S&P 500 was up 11.5% on average when a Democrat was in the White House versus 7.1% for a Republican. But is it that simple?
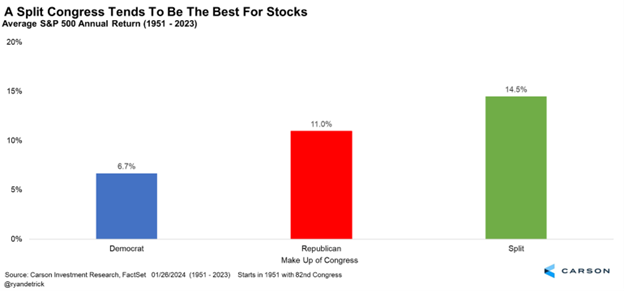
What about Congress? You could argue if a party controls Congress they yield more power than holding the White House. When the Democrats controlled both the House and Senate, the return drops to only 6.7% compared with 11.0% when Republicans control both chambers of Congress. But the real gains tend to be when things are split, as the returns jump to 14.5%. Gridlock (or compromise) is good.
I shared those charts and more in 16 Charts (and Tables) to Know This Election Year. That was one of our most read blogs all year, so be sure to save that link and re-read it a few times over the course of this election year.
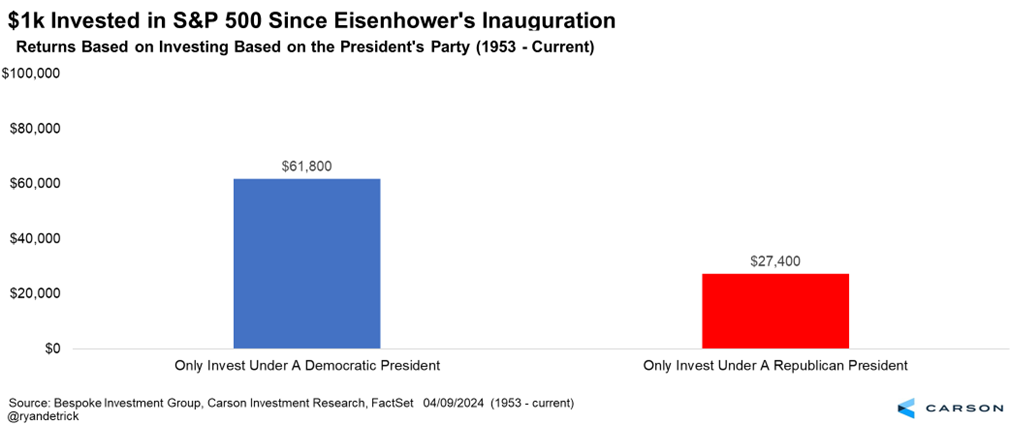
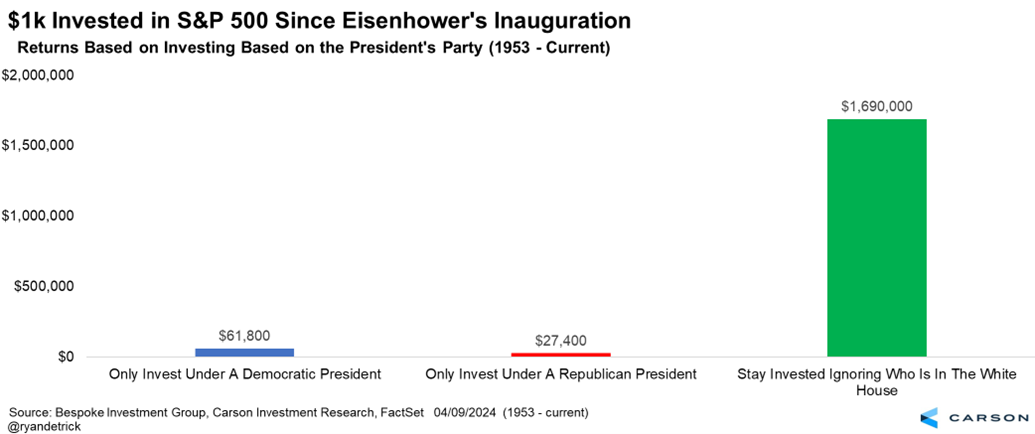
Now here’s one that really caught my attention recently. According to our friends at Bespoke Investment Group, if you invested $1,000 in the S&P 500 when Eisenhower took office in 1953 and invested only when a Democrat was the president you’d have $61,800 today versus $27,400 when only investing during a Republican presidency.
As appealing as that might be to some, if you simply ignored who was in the White House and invested that same $1,000 in the S&P 500 in 1953 it would be worth close to $1.7 million today!
All I can say is wow! I’ve done this for close to 25 years now and I’ve seen so many investors do things purely based on their political beliefs. How many disliked President Trump, rooted for a recession and bear market, only to see 401k balances soar? Today many aren’t happy with President Biden and are avoiding stocks again, yet many portfolios are near the highest they’ve ever been if they stayed invested. Same story with President Obama—if you weren’t invested you missed a great time to buy stocks quite cheaply when he took office in January 2009, only to see stocks soar the next eight years.
The bottom line is don’t let your political beliefs influence your investment decisions.
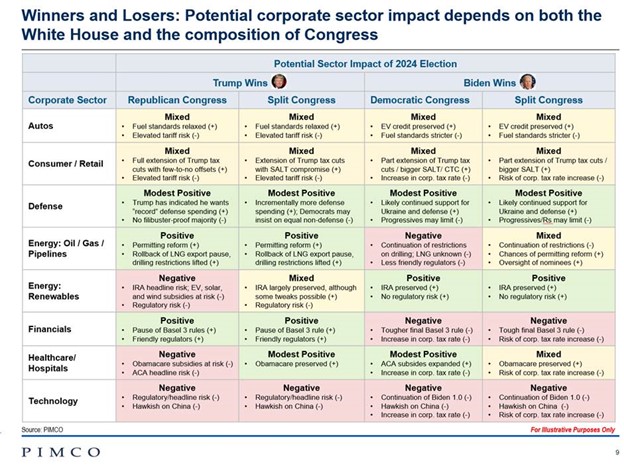
I will leave you with this really interesting chart from Libby Cantrill, Head of US Policy at PIMCO, on potential winners and losers this coming November. Take note, these views aren’t the Carson Investment Research teams views, but I think Libby is one of the best out there and it is worth thinking about as we move closer to the election.
For our latest views on the historic run for stocks the past five months, the hot economy, and whether the Fed will cut rates this year, be sure to listen to our latest Facts vs Feelings podcast or watch below, as Sonu and I discuss it all and more.
For more content by Ryan Detrick, Chief Market Strategist click here.
02194896-0424-A
