The Consumer Price Index (CPI) showed a little more heat than expected in September. Headline CPI rose 0.2% month over month while core CPI (excluding food and energy) rose 0.3%. Cue the worries about resurgent inflation. But the big picture takeaway remains fundamentally positive, and there’s even good news in some of the details, which we’ll get to below.
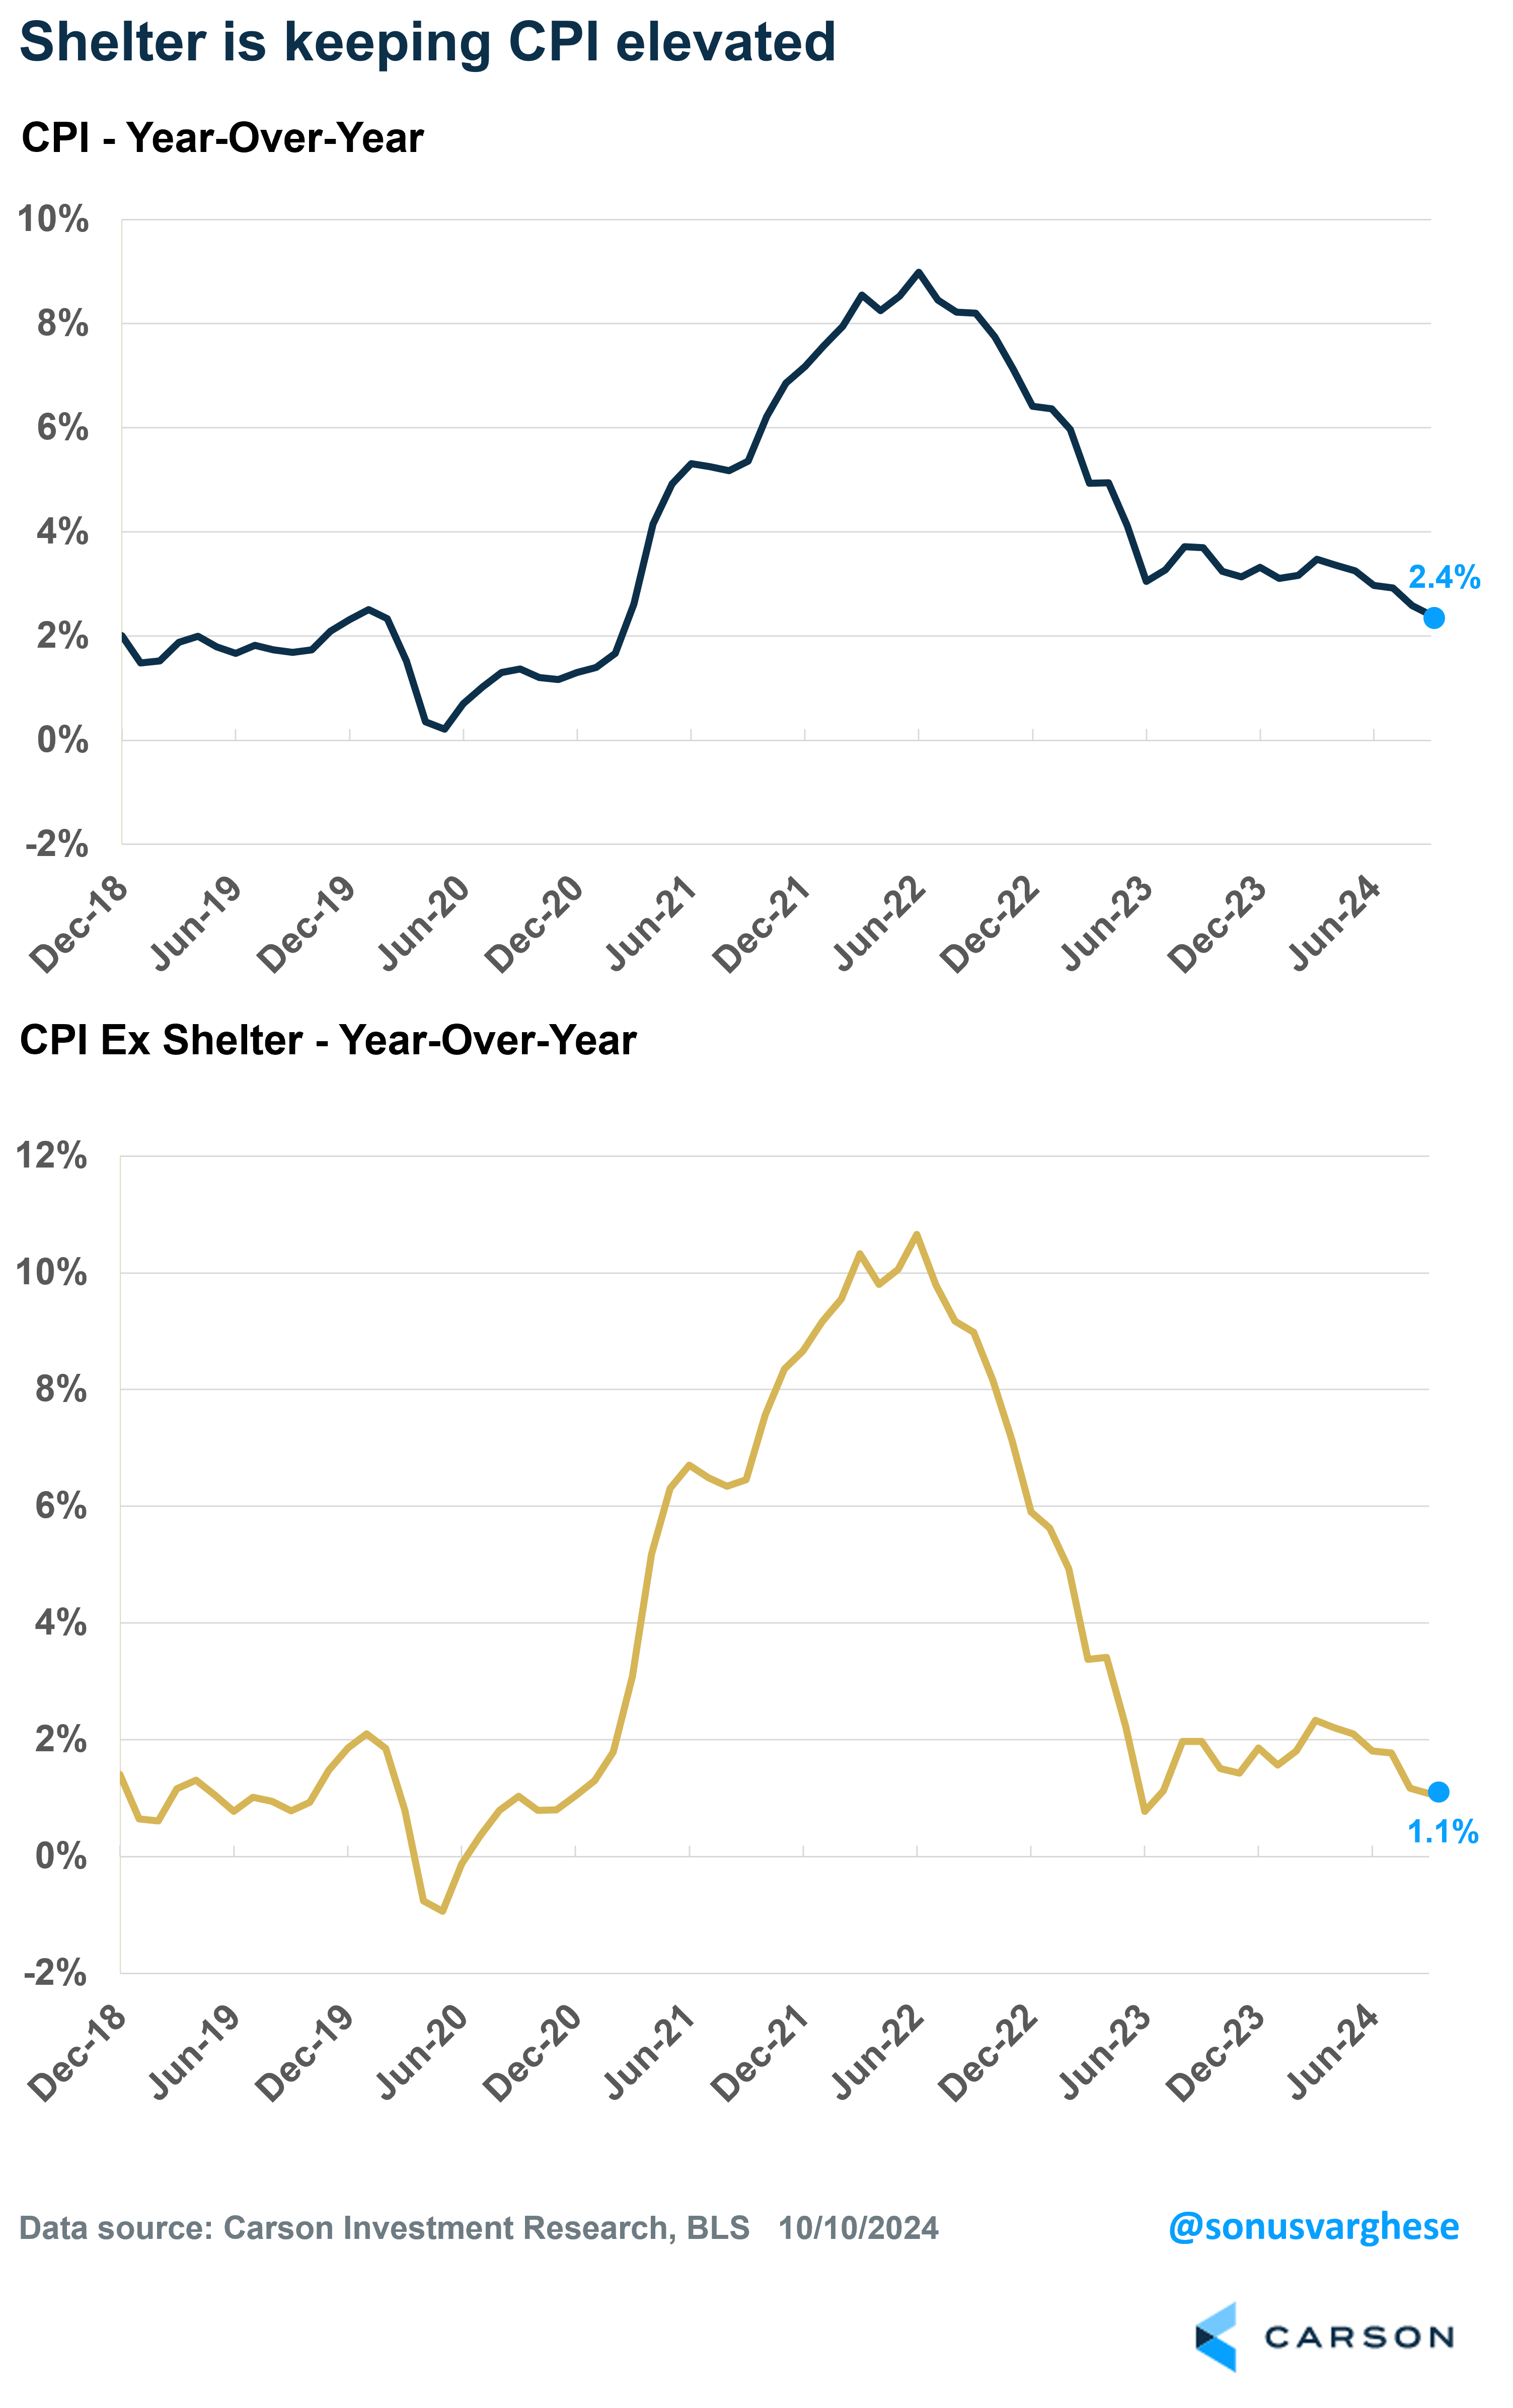
Here’s the headline: CPI is up 2.4% year over year, which is the slowest pace since March 2021. A year ago, it was 3.7%. Even better, we’ve been seeing inflation running even lower lately — over the last three months, inflation has run at an annualized pace of just 2.1%.

Stay on Top of Market Trends
The Carson Investment Research newsletter offers up-to-date market news, analysis and insights. Subscribe today!
"*" indicates required fields
Core CPI is up 3.3% over the past year and is running at a 3.1% annualized pace over the last three months. The elevated core numbers are due to lagging shelter inflation within official data (shelter makes up 44% of core CPI).
Shelter inflation that happened in 2021 – early 2022 is still showing up in the data (though there’s good news here, which I’ll discuss below). If you exclude shelter, here’s how CPI looks (this includes energy and food):
- Last 3 months: +0.7% (annualized)
- Lats 6 months: +0.1% (annualized)
- Last 12 months: +1.1%
I don’t know how you can look at these numbers and still say inflation is a problem. Keep in mind that the Federal Reserve actually targets overall inflation (they just use core inflation to tell them what direction headline is going).
September “Heat” Is Not Abnormal
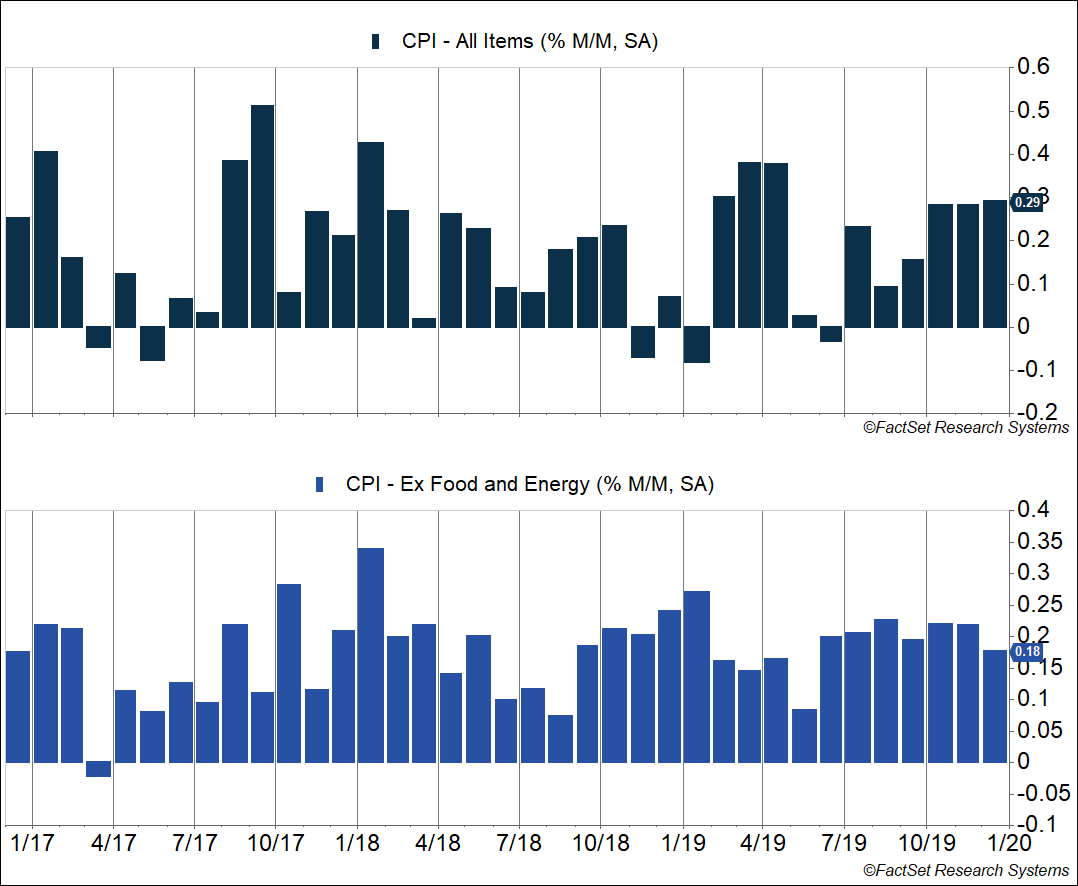
Even during normal or low inflation periods, it’s common to get readings similar to what we saw in September. Between January 2017 and February 2020 (pre-pandemic), headline CPI inflation average 2.1%, and core averaged 2.2% (annualized). The chart below shows monthly inflation numbers (headline and core) over this period. Headline readings above 0.2% were fairly common, and we got several core readings near 0.3%. In short, this is what “normal” looks like. Keep in mind that lagging shelter inflation data is keeping current numbers elevated, with a bigger impact on core inflation.
Good News on the Shelter Front
Official shelter inflation data is showing signs of normalization. We’ve written about this several times over the last two years, explaining why official data runs with significant lags to what we see in actual rental markets on a more real-time basis.
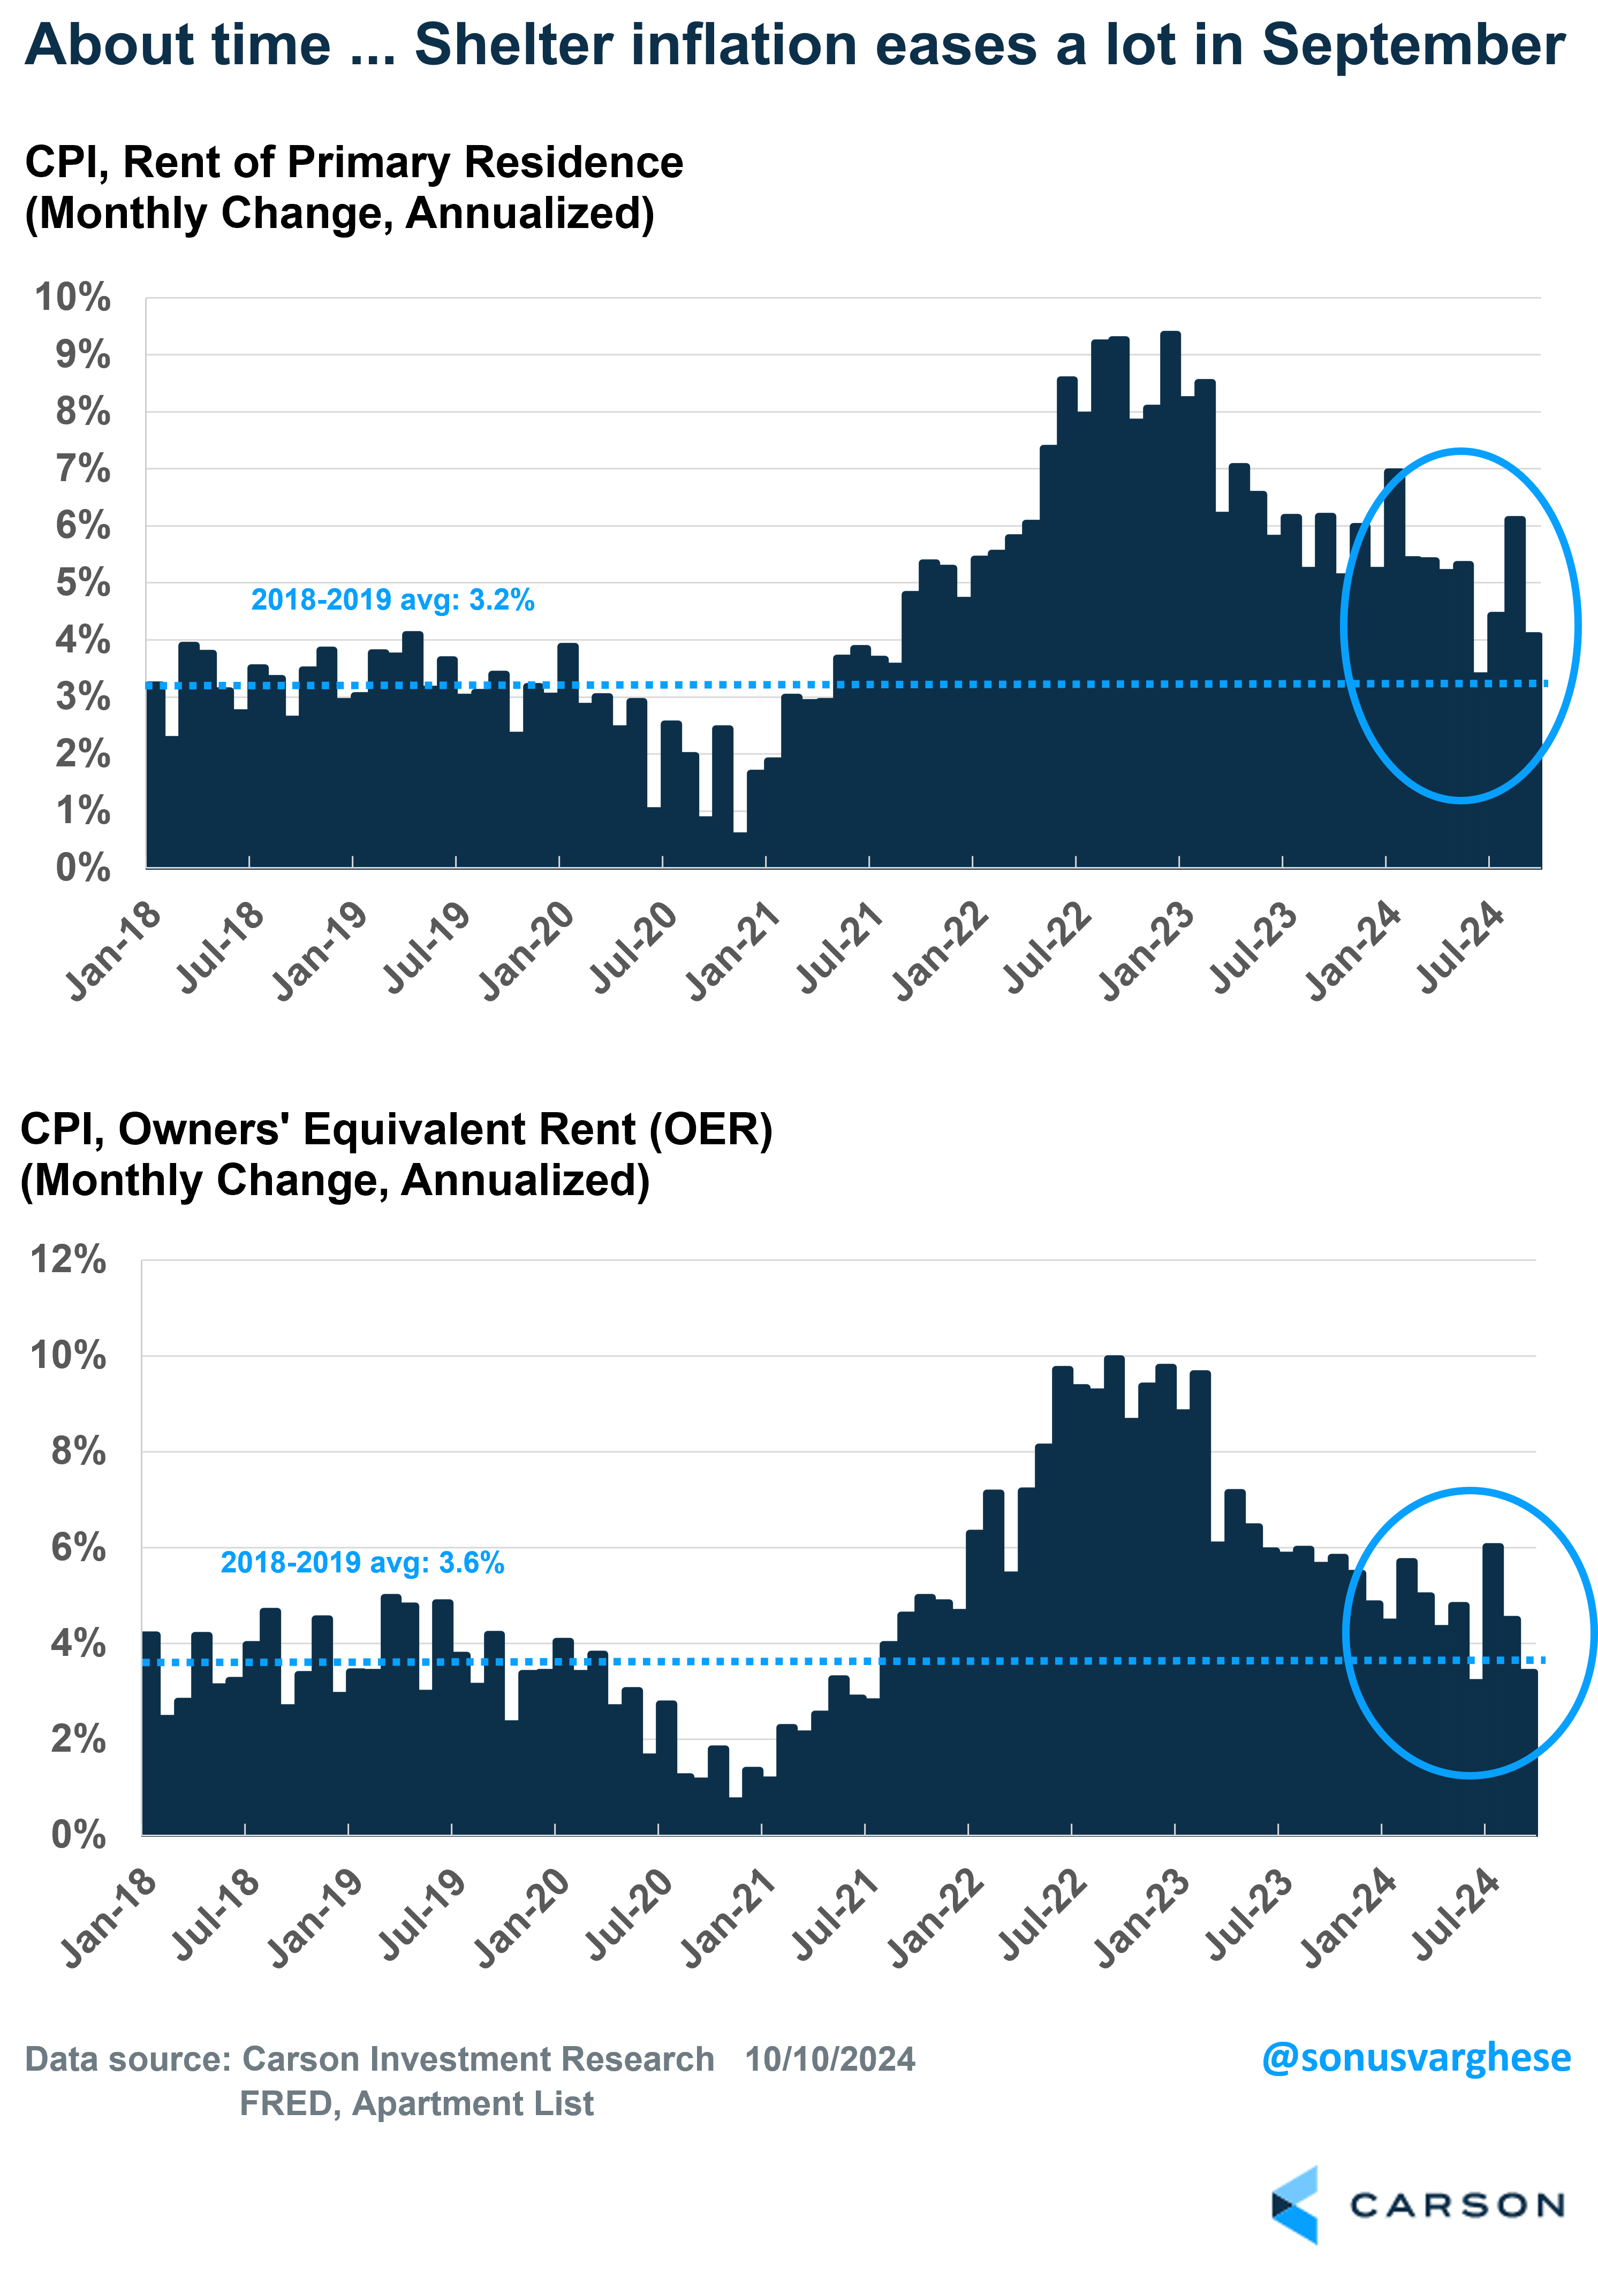
Rents of primary residences (10% of the core CPI basket) rose at an annualized pace of 4.1% in September, well below the 6.2% pace in August and not far above the pre-pandemic pace of 3.2%. Owners’ Equivalent Rent (OER) makes up a whopping 34% of the core CPI basket — it is the “implied” rent homeowners pay and is based on market rents as opposed to home prices. OER rose at an annualized pace of just 3.4% in September, which is slightly below the pre-pandemic pace of 3.6%.
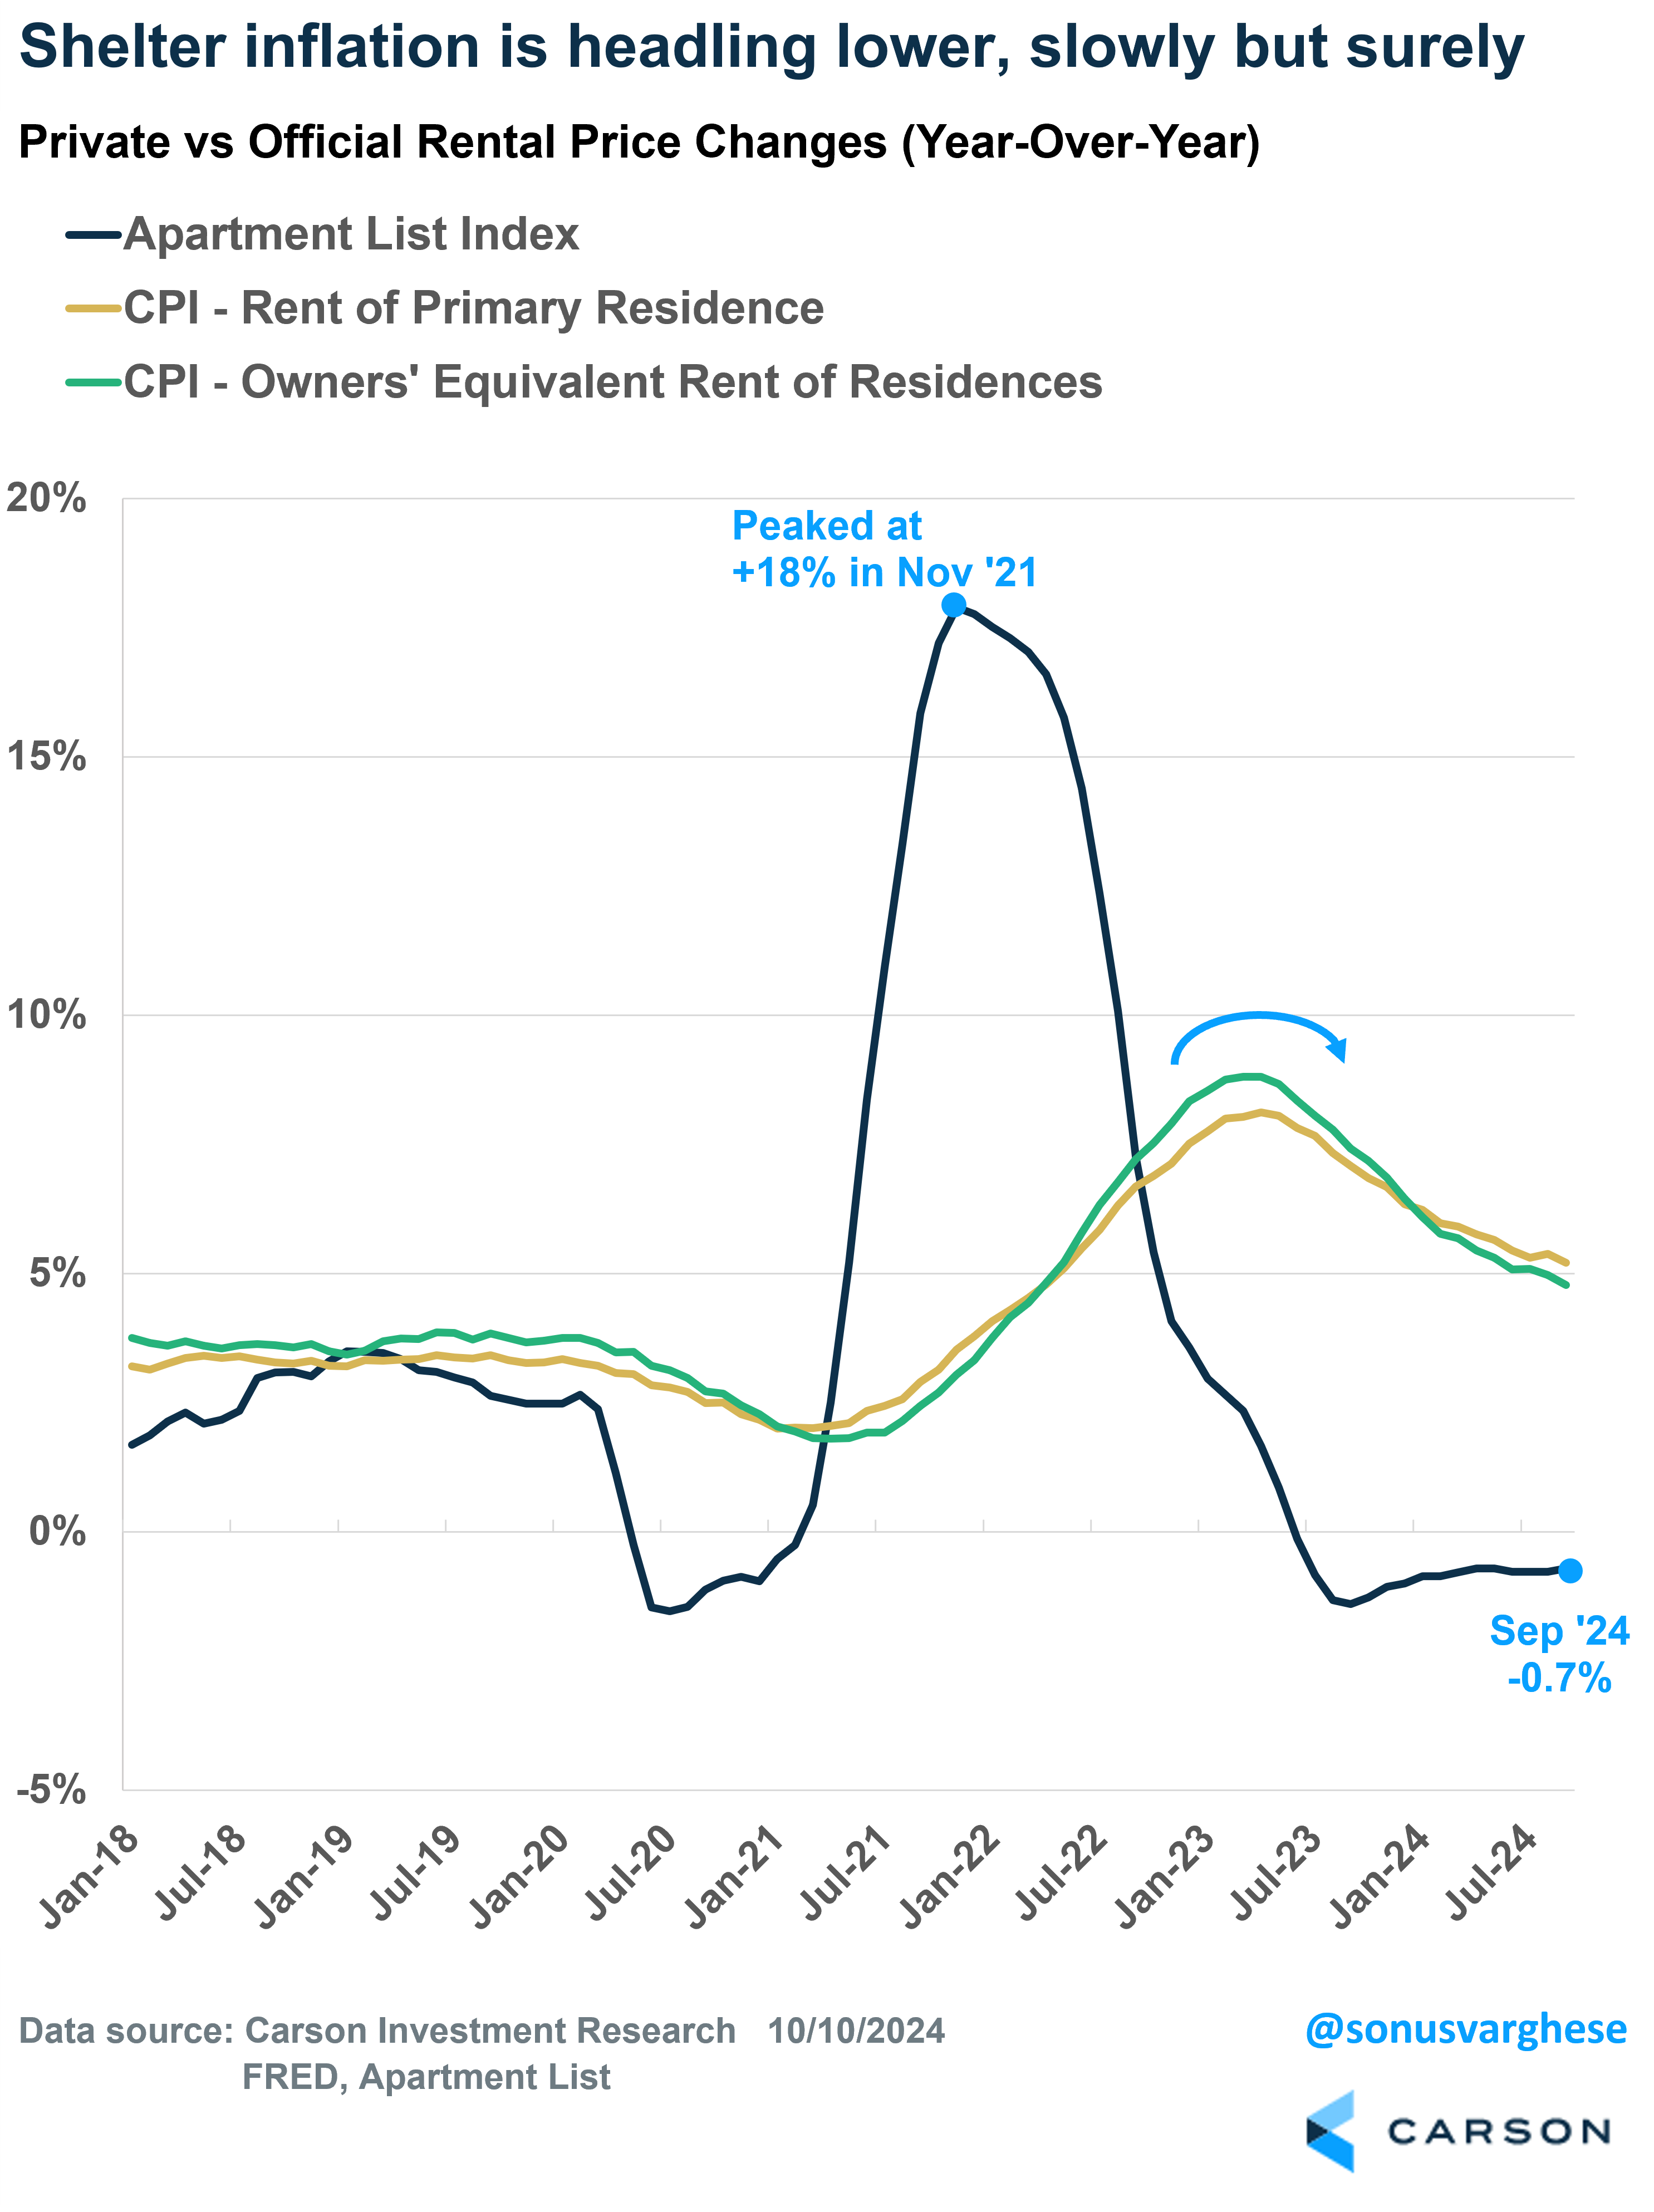
Looking back over the last 12 months, shelter remains very elevated relative to what we saw before the pandemic — rents are up 5.2% year over year and OER is up 4.8%. This is essentially why the headline and core CPI numbers quoted widely in the press are reflecting a hotter inflation story than is actually the case. September is just one month, but this is extremely encouraging data.
Looking ahead, there may actually be more shelter disinflation to come in the official numbers. Markets rents are still declining. The Apartment List rental index is down 0.7% since last year, the 16th straight month with a negative year-over-year reading. Official shelter data is declining slowly but surely. And we may get to a point where the readings are lower than what we saw pre-pandemic, potentially pulling inflation numbers lower over the next year.
Profit Margins Are Also Telling Us Inflation Has Normalized
There was some heat in certain categories that offset the positive data on the shelter side. Airfares rose 3.2%, while apparel and vehicle prices also rose. This probably reflects how the data is seasonally adjusted more than anything else. Motor vehicle insurance premiums also rose, but this is likely a lagged impact of higher vehicle prices. With vehicle prices pulling back (at least in the private market data), insurance premium increases should start to ease.
But even during “normal” inflationary periods, you always get idiosyncratic areas that see hotter inflation. That doesn’t mean broad-based inflation is going to surge.
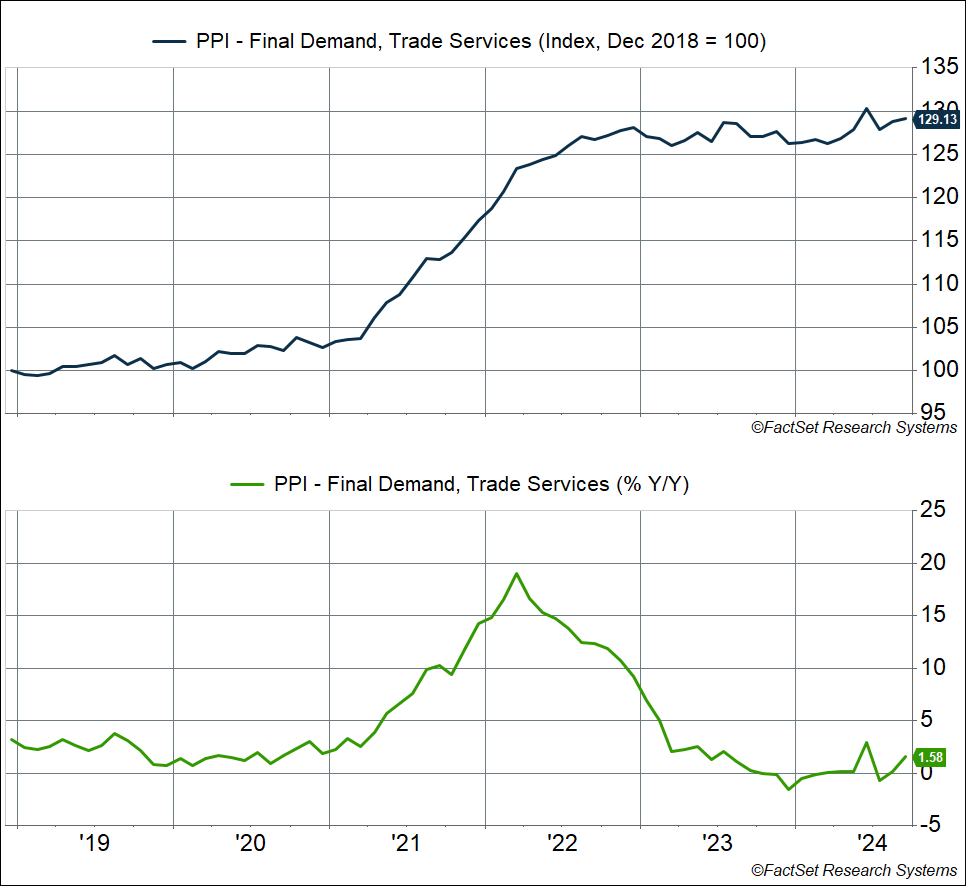
Case in point: profit margins. The producer price index (PPI) measures input price inflation for businesses. However close to a quarter of the PPI basket that excludes food and energy is made up of “trade services,” which actually measures profit margins for retailers and wholesalers. Margins are up 29% since before the pandemic (February 2020), but as you can see in the chart below (top panel), they’ve flatlined over the last two years.
Back in 2022, when inflation was hitting its peak, profit margins were up a massive 19% year over year (March 2022). The good news is that as of September, profit margins for retailers/wholesalers were up 1.6% over the past year (bottom panel of the chart), which is in line with what we saw before the pandemic in 2019. This is more evidence that inflation has normalized.
There is some concern that inflation is surging even as economic activity remains strong, the “no-landing” scenario. Real GDP is up 3% year over year as of the second quarter of 2024 and is expected to rise at a similar pace in the third quarter. However, as I discussed above, inflation is normalizing. But the way to reconcile this with stronger growth is via stronger productivity growth, which we’ve seen evidence of. In fact, we wrote about this in our 2024 Outlook, released all the way back in January.
All of this means the Federal Reserve can continue to normalize interest rates. They may not have to go with a big cut at every meeting, like the 0.5%-point cut they made in September, especially with the labor market looking a little better than what the summer data showed. But they can cut gradually, and we expect they will. That’s going to be a big tailwind for the economy, and markets, as we go into 2025.
For more content by Sonu Varghese, VP, Global Macro Strategist click here.
02457591-1001-A


