Over the last couple of months, inflation numbers have come in on the softer side – the consumer price index (CPI) was flat in July and rose just 0.1% in August. But this was mostly due to falling energy prices. Excluding energy and food, “core” inflation was higher, rising 0.3% in July and 0.6% in August. Over the past 3 months, core inflation has averaged 0.3%, which is equivalent to an annualized pace of 6.3% and well above the 2.3% pace we saw before the pandemic. A big reason for this is the price of shelter, i.e. rents, which have been rising rapidly over the past year.
But there’s good news: private measures of rents are showing a rapid deceleration in rental prices.
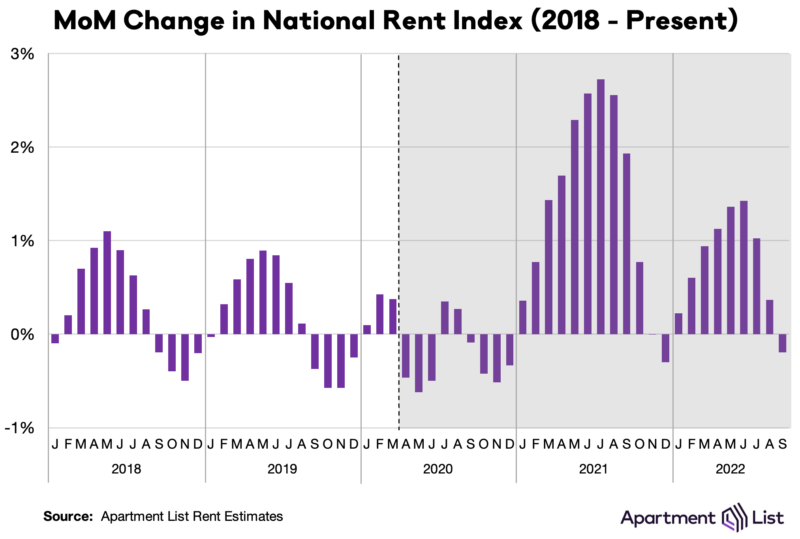
The latest Apartment List national rent report showed their national index of rents falling 0.2% in September. This is the first time the median rent has declined this year. There is a seasonal component to this – before the pandemic, rents typically declined between September and January. The data from 2017 through 2019 showed that rents declined about 0.3% on average just in the month of September. We didn’t see that last year (rents rose a whopping 1.9% in September 2021), but we may be reverting to the norm now.
Where could rents go from here?
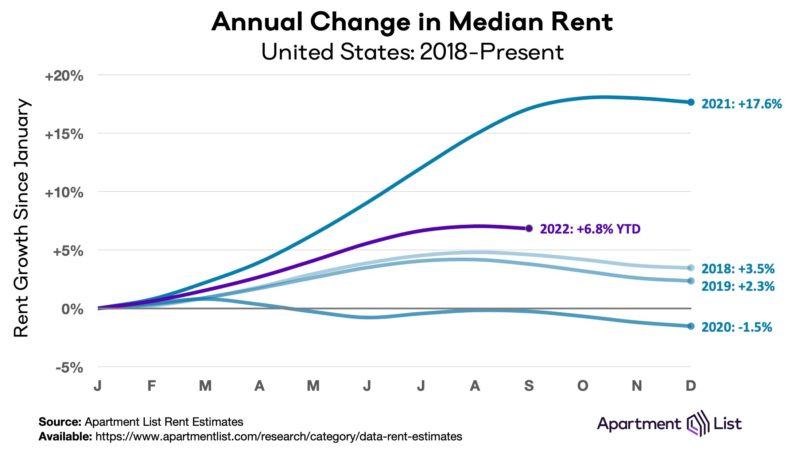
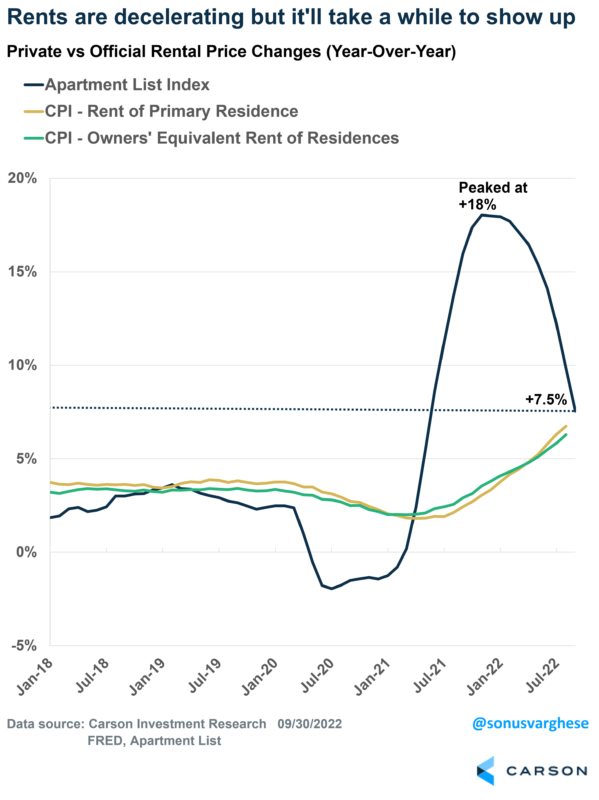
Year-to-date rent growth is considerably slower than last year, running at 6.8% now. If the slowdown continues, it looks like rent growth will be around 6% by the end of 2022. This is still faster than what we saw pre-pandemic but well below the 2021 rate of 18%.
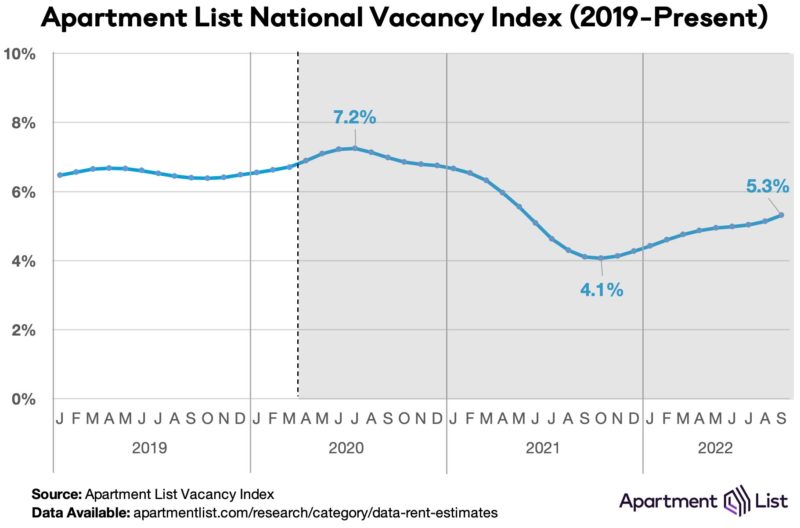
Supporting a continued slowdown is the fact that supply is increasing, with rental vacancies rising to 5.3% in September. This is below the 6-7% average level we saw pre-pandemic but higher than the low of 4.1% that we saw last year.
A potential counter to this is that home-buying activity is declining rapidly as mortgage rates surge. That could put some upward pressure on rents, as more people opt to rent instead of buying.
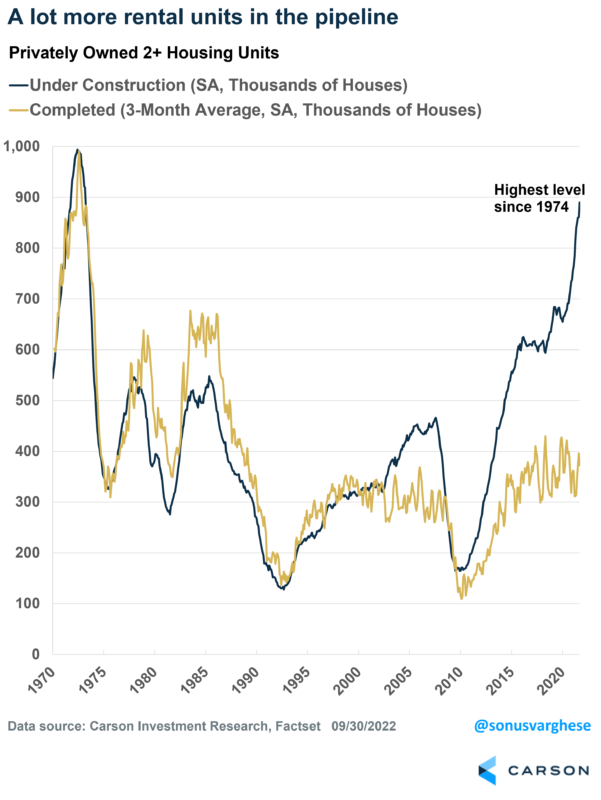
At the same time, we should see a lot more supply coming online over the next year. Multi-family housing units under construction have been running at the highest levels since 1974. And they’re running significantly above “completed” multi-family units. The only other time we saw a large gap between units under construction and completions was in the mid-2000s, amid the housing bubble. Right now, the gap probably has more to do with supply-chain bottlenecks for the various materials that go into constructing homes, as opposed to a repeat of the bubble.
So, is inflation going to fall?
The good news is that we should see the shelter component of CPI decelerate. The bad news is that it probably won’t happen soon. And it’s worth understanding why.
The shelter component of CPI makes up almost 40% of the core inflation “basket” and consists of two pieces:
- Rents of primary residence, which makes up 9% of the basket
- Owners’ equivalent rent of residences (OER) makes up 30% of the basket. OER is the “implied rent” that owner-occupants would have to pay if they were renting their homes. It’s as if you, as an owner, are renting the home to yourself as a service. The “rents” in OER are determined using equivalent homes, and so they essentially track rents, as opposed to home prices.
There are some important methodology differences between the CPI rental calculations and private indices like the one from Apartment List.
For one, private indices are measuring new leases, whereas CPI considers both new and existing leases. Note that most leases are not up every month, and are instead negotiated for longer periods, like 1-2 years. This is why the Apartment List measure plunged amid the pandemic and then surged in 2021 – while rents in CPI continued to show a steady increase.
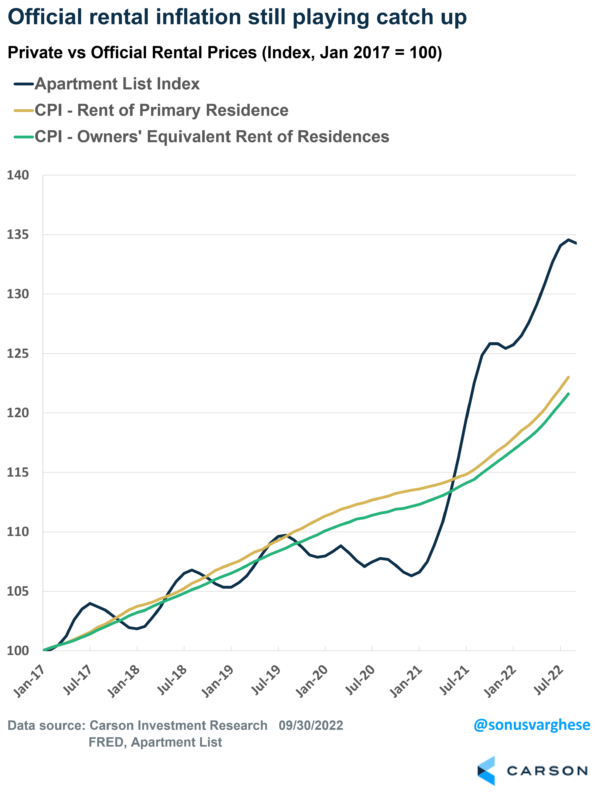
The other problem is how the Bureau of Labor Statistics (BLS) measures rents for the official inflation numbers. Since rents are not re-negotiated often, the BLS samples units only once in 6 months. On top of that, they smooth the price changes over 6 months. As a result, if leases are for 1 year, and if rents rapidly rise by 10%, it will take about 1-2 years for that full 10% increase to show up in the official data. This is why the CPI rental measures lag private indices, probably by a good 8-12 months.
As an example, the year-over-year change for the Apartment List measure hit a low of -1.9% in July 2020, but the CPI rental measure didn’t bottom for another 9 months (hitting a low of 1.8-2% year-over-year). So, the deceleration we’re seeing in the private indices will take a while to show up in the CPI data.
The Apartment List measure hit a peak of 18% year-over-year in November 2021. The CPI measures are still climbing, with rents at 6.7% and OER at 6.3% – and things may get worse before they get better, with the numbers potentially going up for the next month or two.
We can all quibble about the methodology, but it is what it is. The bigger question is whether the Fed will continue to focus on core inflation, a lagging measure, to justify further interest rate increases. As I mentioned above, the rent deceleration will take some time to show up in the official data. One potential positive is that a lot of supply-chain-related price indicators are pointing to a slowdown/reversal in goods prices, as my colleague Ryan Detrick recently pointed out. This could offset higher rents over the next few months, providing some respite to a Fed looking to get on top of inflation.