Buckle up, as one of the most well-known investment axioms is nearly here, the ‘Sell in May and Go Away’ period, otherwise known as Sell in May. This gets a ton of play in the media, as these six months are indeed the worst six-month combo out of all scenarios, while stocks also did quite poorly last year during this timeframe as well, only adding to the likely hype.
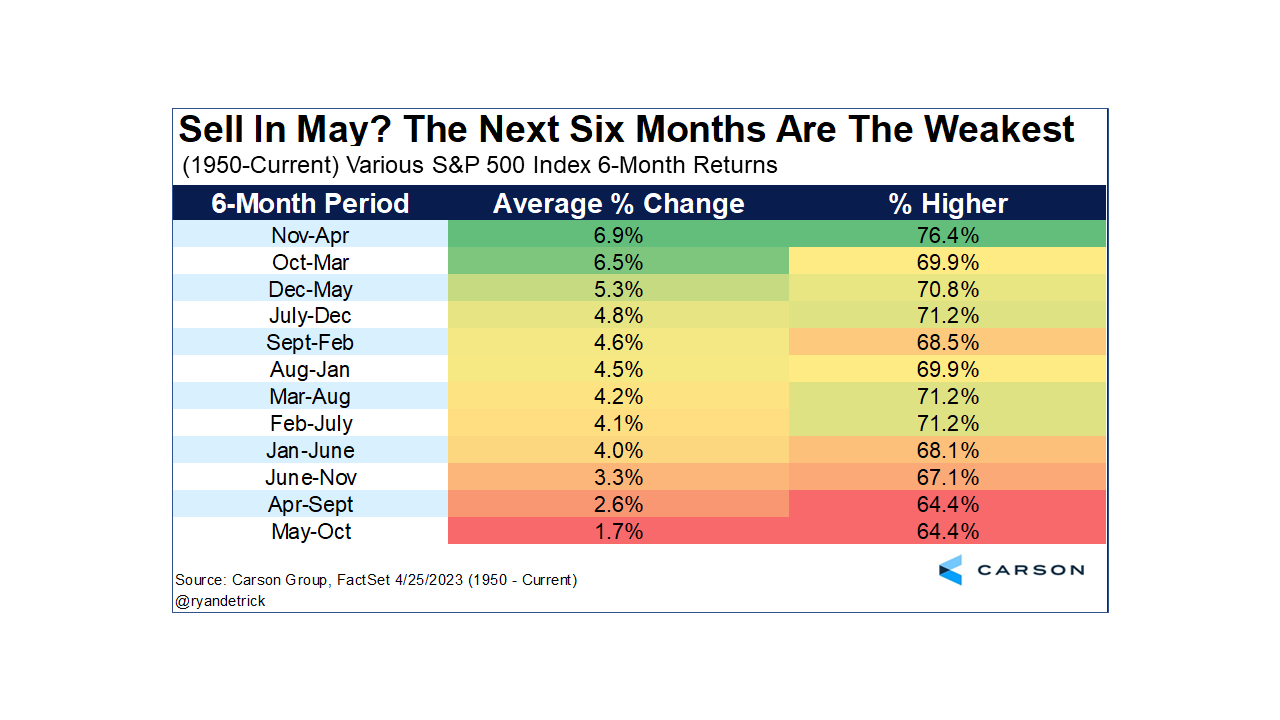
The thinking is you are better off to simply ignore these six months and go away. Turns out, from May through October the S&P 500 is historically quite weak, up only 1.7% on average and higher less than 65% of the time, making it indeed the worst combo.
Of course, 1.7% is still a positive return, so maybe we shouldn’t just blindly go away? That is our take and there are other reasons not to fear these worst six months in 2023. Sure, more volatility and scary headlines could happen, but with overall market sentiment extremely bearish and the economy on firmer footing than most think, we’d use any seasonal weakness as an opportunity to add to core positions.
Stay on Top of Market Trends
The Carson Investment Research newsletter offers up-to-date market news, analysis and insights. Subscribe today!
"*" indicates required fields
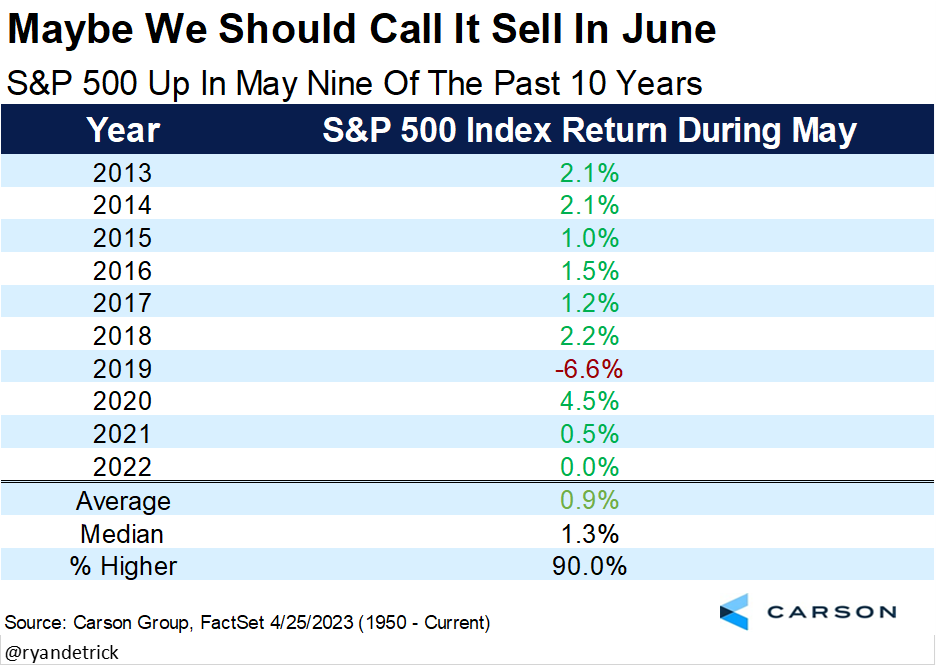
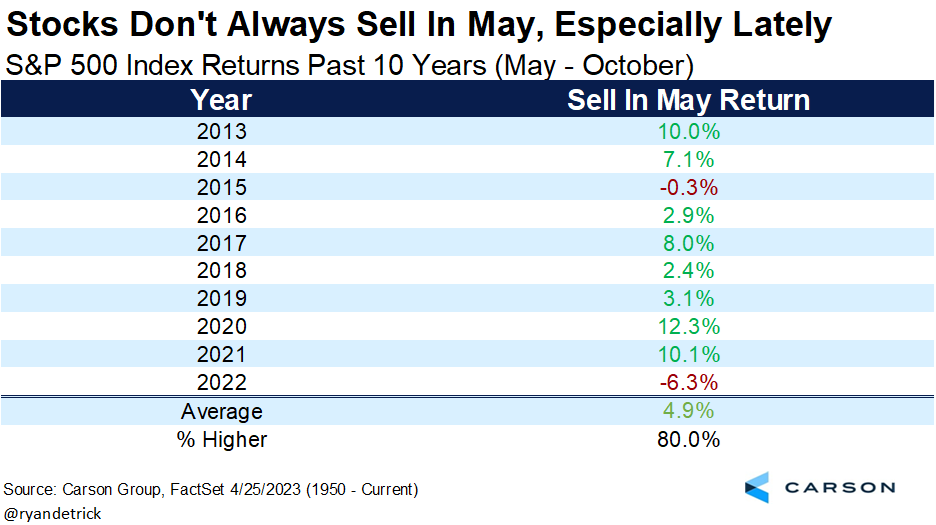
Here’s something I bet most investors don’t know, May has been really strong lately for stocks, higher an incredible nine of the past 10 years. Maybe we should call it Sell in June?
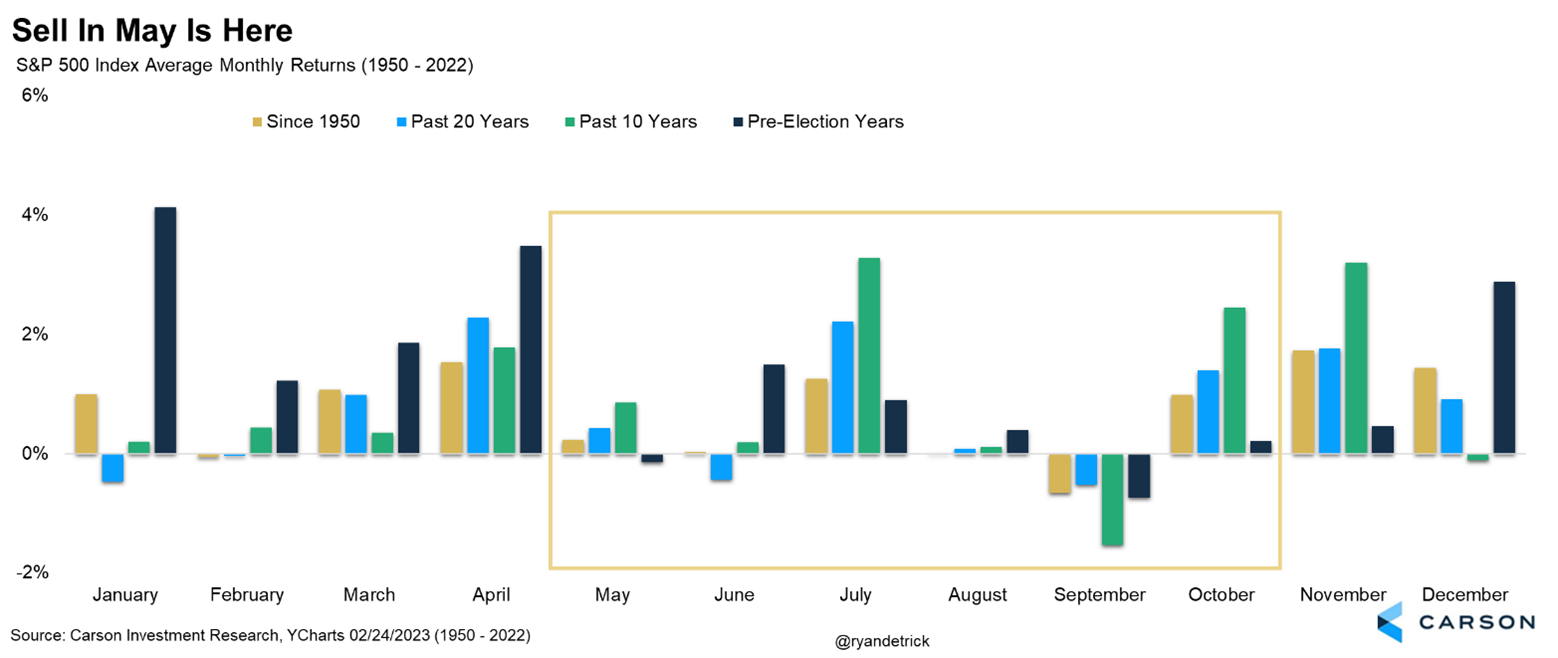
Let’s take a closer look at that one year over the past decade that stocks fell in May. Turns out, one potential hiccup is May is the second worst month of the year for stocks during a pre-election year, with only September worse. In fact, these are the only two months with a negative return during a pre-election year, with May down 0.1% and September down 0.7%. Even in the bullish 2019 (when stocks gained close to 30%), stocks still lost more than 6% in May of that year.
Last year was a great time to sell and go away during these historically weak six months, but that wasn’t always the case. In fact, over the past decade, stocks only fell twice these six months, last year and 2015. Looking at the past decade shows that these six months have been up nearly 5% on average versus the 1.7% return going back to 1950.
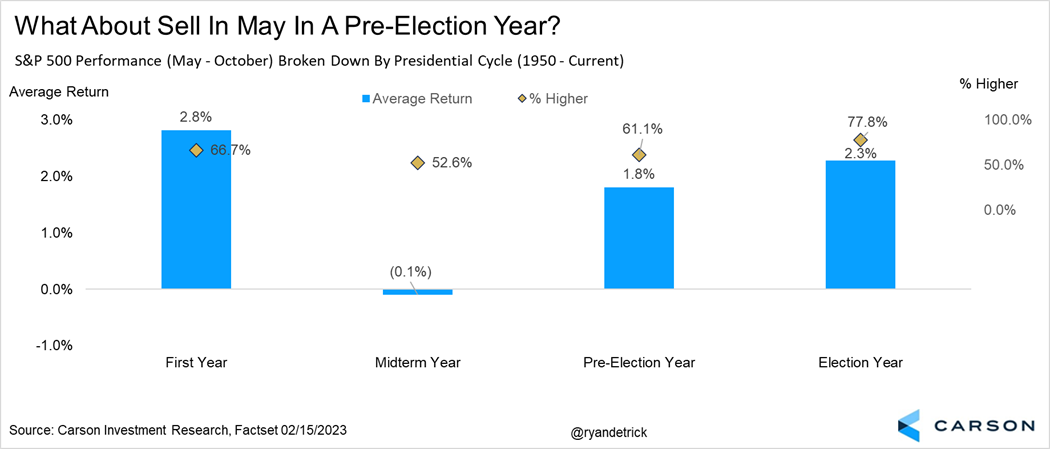
We’ve noted many times the past several months how historically strong pre-election years were for stocks, well, what about Sell in May in a pre-election year? As you can see below, the returns are right about average, up 1.8% during these six months in a pre-election year. What stands out more to me is how poorly these six months are during a midterm year, playing out well last year for sure.
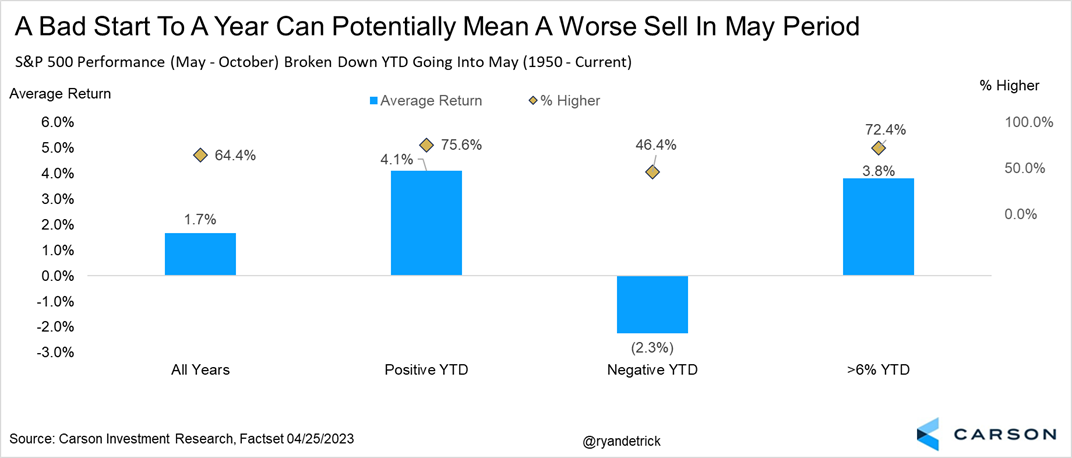
Now here’s where things get quite interesting. It turns out how things are going heading into these six months can often give a clue what might happen. When stocks are down year-to-date heading into these six months the return drops to 2.3% and is higher less than a coinflip of the time. Given this was the scenario last year, along with a midterm year, maybe a rough time wasn’t such a surprise? Now the good news is when stocks are up for the year (like 2023), these worst six months actually gained more than 4% on average and were higher more than 75% of the time. This could bode well for potentially better returns these six months in 2023.
For more of our thoughts on the latest in the economy and stocks market, be sure to listen to our latest Facts vs. Feelings podcast with Sonu and myself.