The Consumer Price Index (CPI) report was a welcome “surprise” after a string of uncomfortably hot inflation reports. I put quotes around the word surprise, because in January and April, there was nothing within the inflation data or outside of it (e.g. inflation expectations, wage growth data) that suggested inflation was on a persistently higher path.
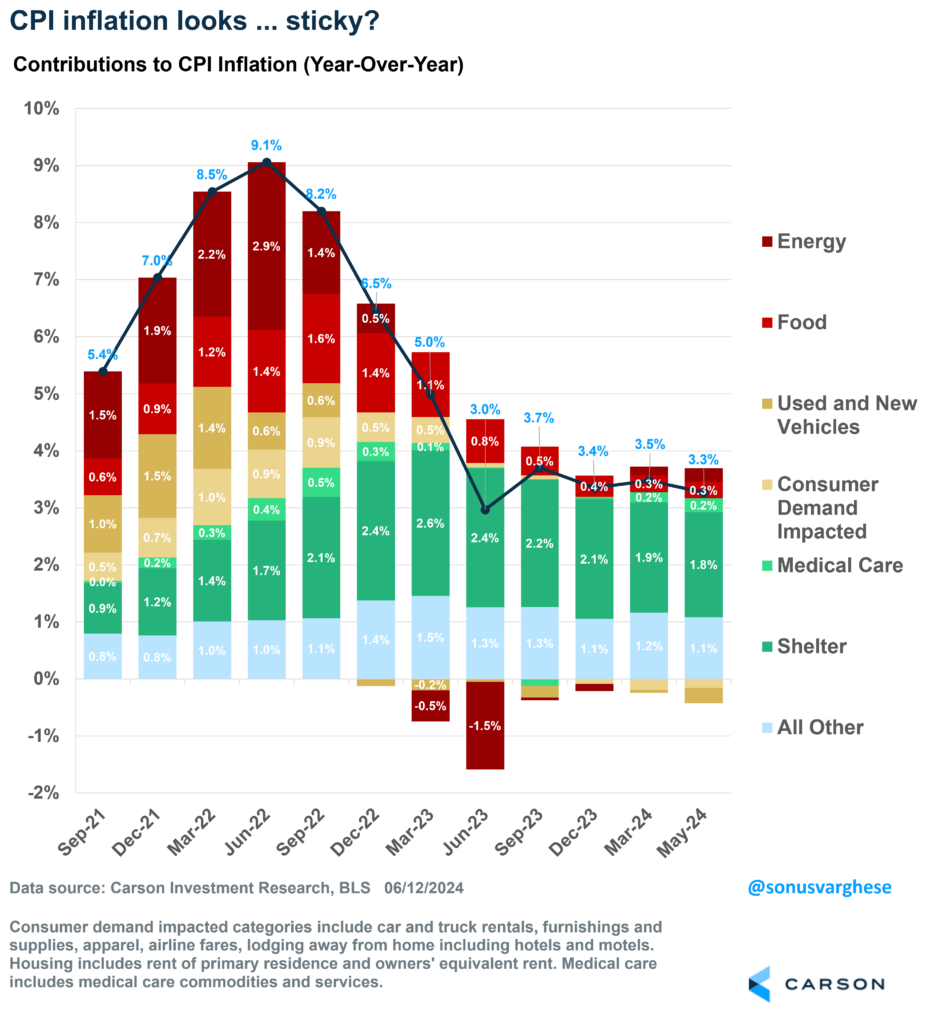
Headline inflation was flat in May, while core inflation (stripping out volatile energy and food components) rose 0.16%, which corresponds to an annualized pace of exactly 2%, all softer than what forecasters were expecting. At the same time, headline CPI is now up 3.3% since last year, and it looks like we’ve made no progress on inflation since last fall. But a closer look at the data below tells you that shelter (in dark green) continues to keep official inflation data elevated.
As we’ve written and talked about on Facts vs Feelings, the podcast Chief Market Strategist Ryan Detrick and I host, official shelter inflation runs with significant lags to what we see in actual rental markets. Shelter inflation matters a lot for CPI, as it makes up 35% of the basket. Rents of primary residence account for 8% points of that, while “owners’ equivalent rent” (OER) accounts for the other 27%. OER is the “implied rent” homeowners pay, and it’s based on market rents as opposed to home prices. If you set aside housing inflation, recent inflation trends look very encouraging. Headline inflation is running at a 2.8% annualized pace over the past three months, but if you exclude shelter it drops to 1.7%. That is not a typo.
Here’s Why We Think Inflation Is Headed Lower
CPI inflation data is a backward-looking data point, but the guts of the report, and the trends within, can tell us what we may be looking at on a go-forward basis. There’s good news on that front.
First up, shelter. We continue to see disinflation on this front, as the official data follows what we see in private real-time data. Albeit slowly. In Q4 2023, rent and OER averaged an annualized pace of 5.4%. That eased ever so slightly to 5.2% in Q1 2024, and in April-May the pace was 4.7%. For reference, the corresponding pace in 2019 was 3.6% (which is consistent with the Federal Reserve’s target of 2%).
Next up is one of my favorite inflation bellweathers: inflation at seated restaurants. Interestingly, it’s not included in core CPI, but correlates well with it. That’s because seated restaurant prices combine several underlying drivers of inflation – restaurant worker wages, commodity prices (food obviously, but also energy prices involved with transportation), and restaurant premise rents. Inflation for this category peaked at 9% year over year in 2022 but it has pulled all the way back to 3.5% – which is where it was in late 2019. It tells me that underlying inflation is not running too hot. In fact, over the last four months food price inflation (groceries) has been flat or negative, and that will likely pull restaurant price inflation even lower. We’re also not seeing a surge in wage growth, in sharp contrast to what we saw in 2022.

Stay on Top of Market Trends
The Carson Investment Research newsletter offers up-to-date market news, analysis and insights. Subscribe today!
"*" indicates required fields
Third, new vehicle prices. The story up until now has been used car prices and we’ve seen a lot of disinflation there. But now we’re seeing prices for new vehicles pull lower as well – prices have fallen for 5 straight months. There’s more to come as supply chain issues fade further into the background and vehicle assemblies pick up, leading to higher inventories. Meanwhile, private data for used cars suggest used car prices will continue to fall. All of which will exert a downward force on inflation for the rest of this year.
The Fed Is Going to Follow the Data
The Federal Reserve just wrapped up their June meeting and they chose not to move away from the current target policy rate of 5.25-5.5%. That was expected but this was an important meeting, because they updated their projections for the economy, inflation, and appropriate policy under those scenarios. These policy projections are what’s known as the “Dot Plot,” which was last updated in March.
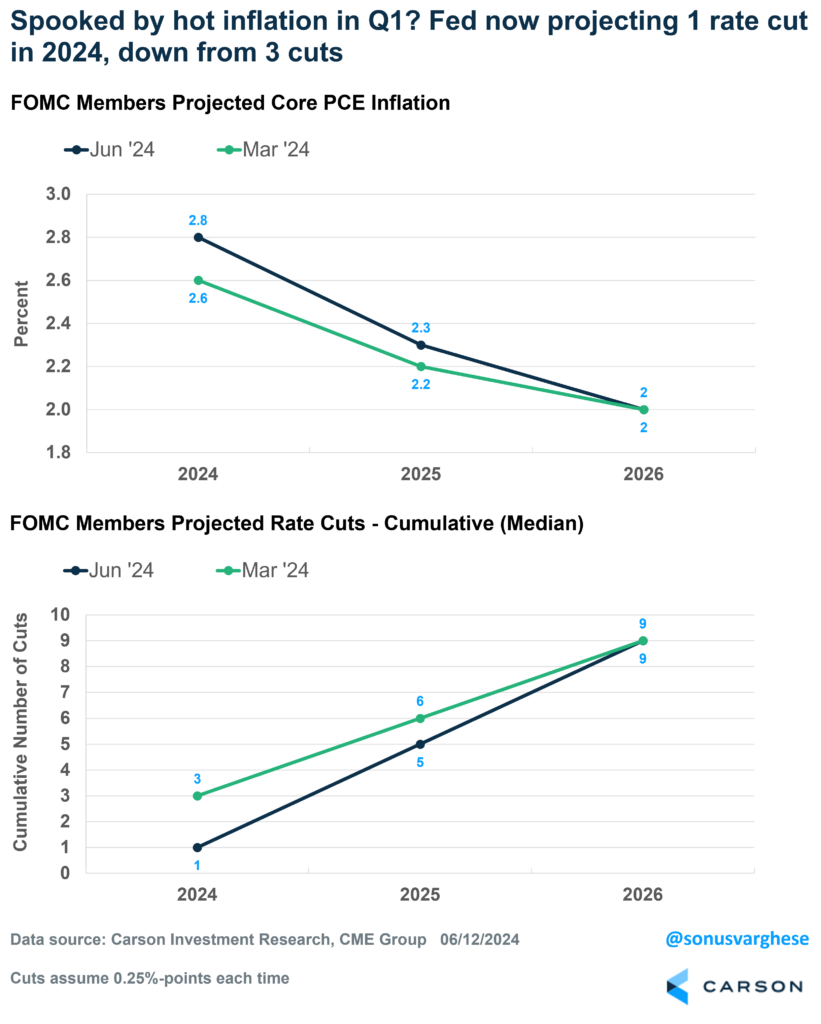
Despite having early access to the May inflation data, they were clearly spooked by the hotter-than-expected inflation data in Q1. They raised their 2024 projection for core inflation from 2.6% to 2.8%. (They use the personal consumption expenditure index, or PCE, which runs a little softer than CPI.) It doesn’t seem like a big shift, except they now project just 1 rate cut (worth 0.25%-points) in 2024, versus the 3 projected in March. The Fed was on the wrong side of the whole “transitory inflation” call a couple of years ago, and they clearly don’t want to be caught offside again. Once bitten, twice shy.
They do have “catch-up” cuts in 2025 and 2026, eventually landing at the same interest rate for 2026 that they indicated in March. They project a total of 9 cuts by 2026, translating to 2.25%-points of cuts (taking the policy rate to the 3-3.25% range).
All that said, I recommend treating the dot plot with some caution. As Fed Chair Powell pointed out, the dots are based on what Fed officials think could happen. The dots are NOT a forecast of what will happen. Just as the dots shifted between March and June, we could see opinions shift between now and September, especially if inflation continues to ease. In fact, a 2.8% projection for core PCE in 2024 indicates that inflation will run around 2.4-2.5% over the second half of the year. That may be a little too high given underlying trends that I laid out earlier.
In any case, the Fed continues to project at least one cut in 2024. But there’s good reason to think we may actually get two, with the first one coming in September followed by another in December.
For more content by Sonu Varghese, VP, Global Macro Strategist click here.
02280744-0624-A


