The latest consumer price index (CPI) inflation data for February came in slightly ahead of expectations, which led the commentariat to worry about “sticky” inflation that doesn’t go away. However, I had a different sentiment after spending some time under the hood with the data. But first, the numbers. Headline CPI rose 0.4% in February, which was higher than the 0.3% increase in January, mostly thanks to a 3.6% increase in gas prices. CPI inflation is currently up 3.2% since February 2023.
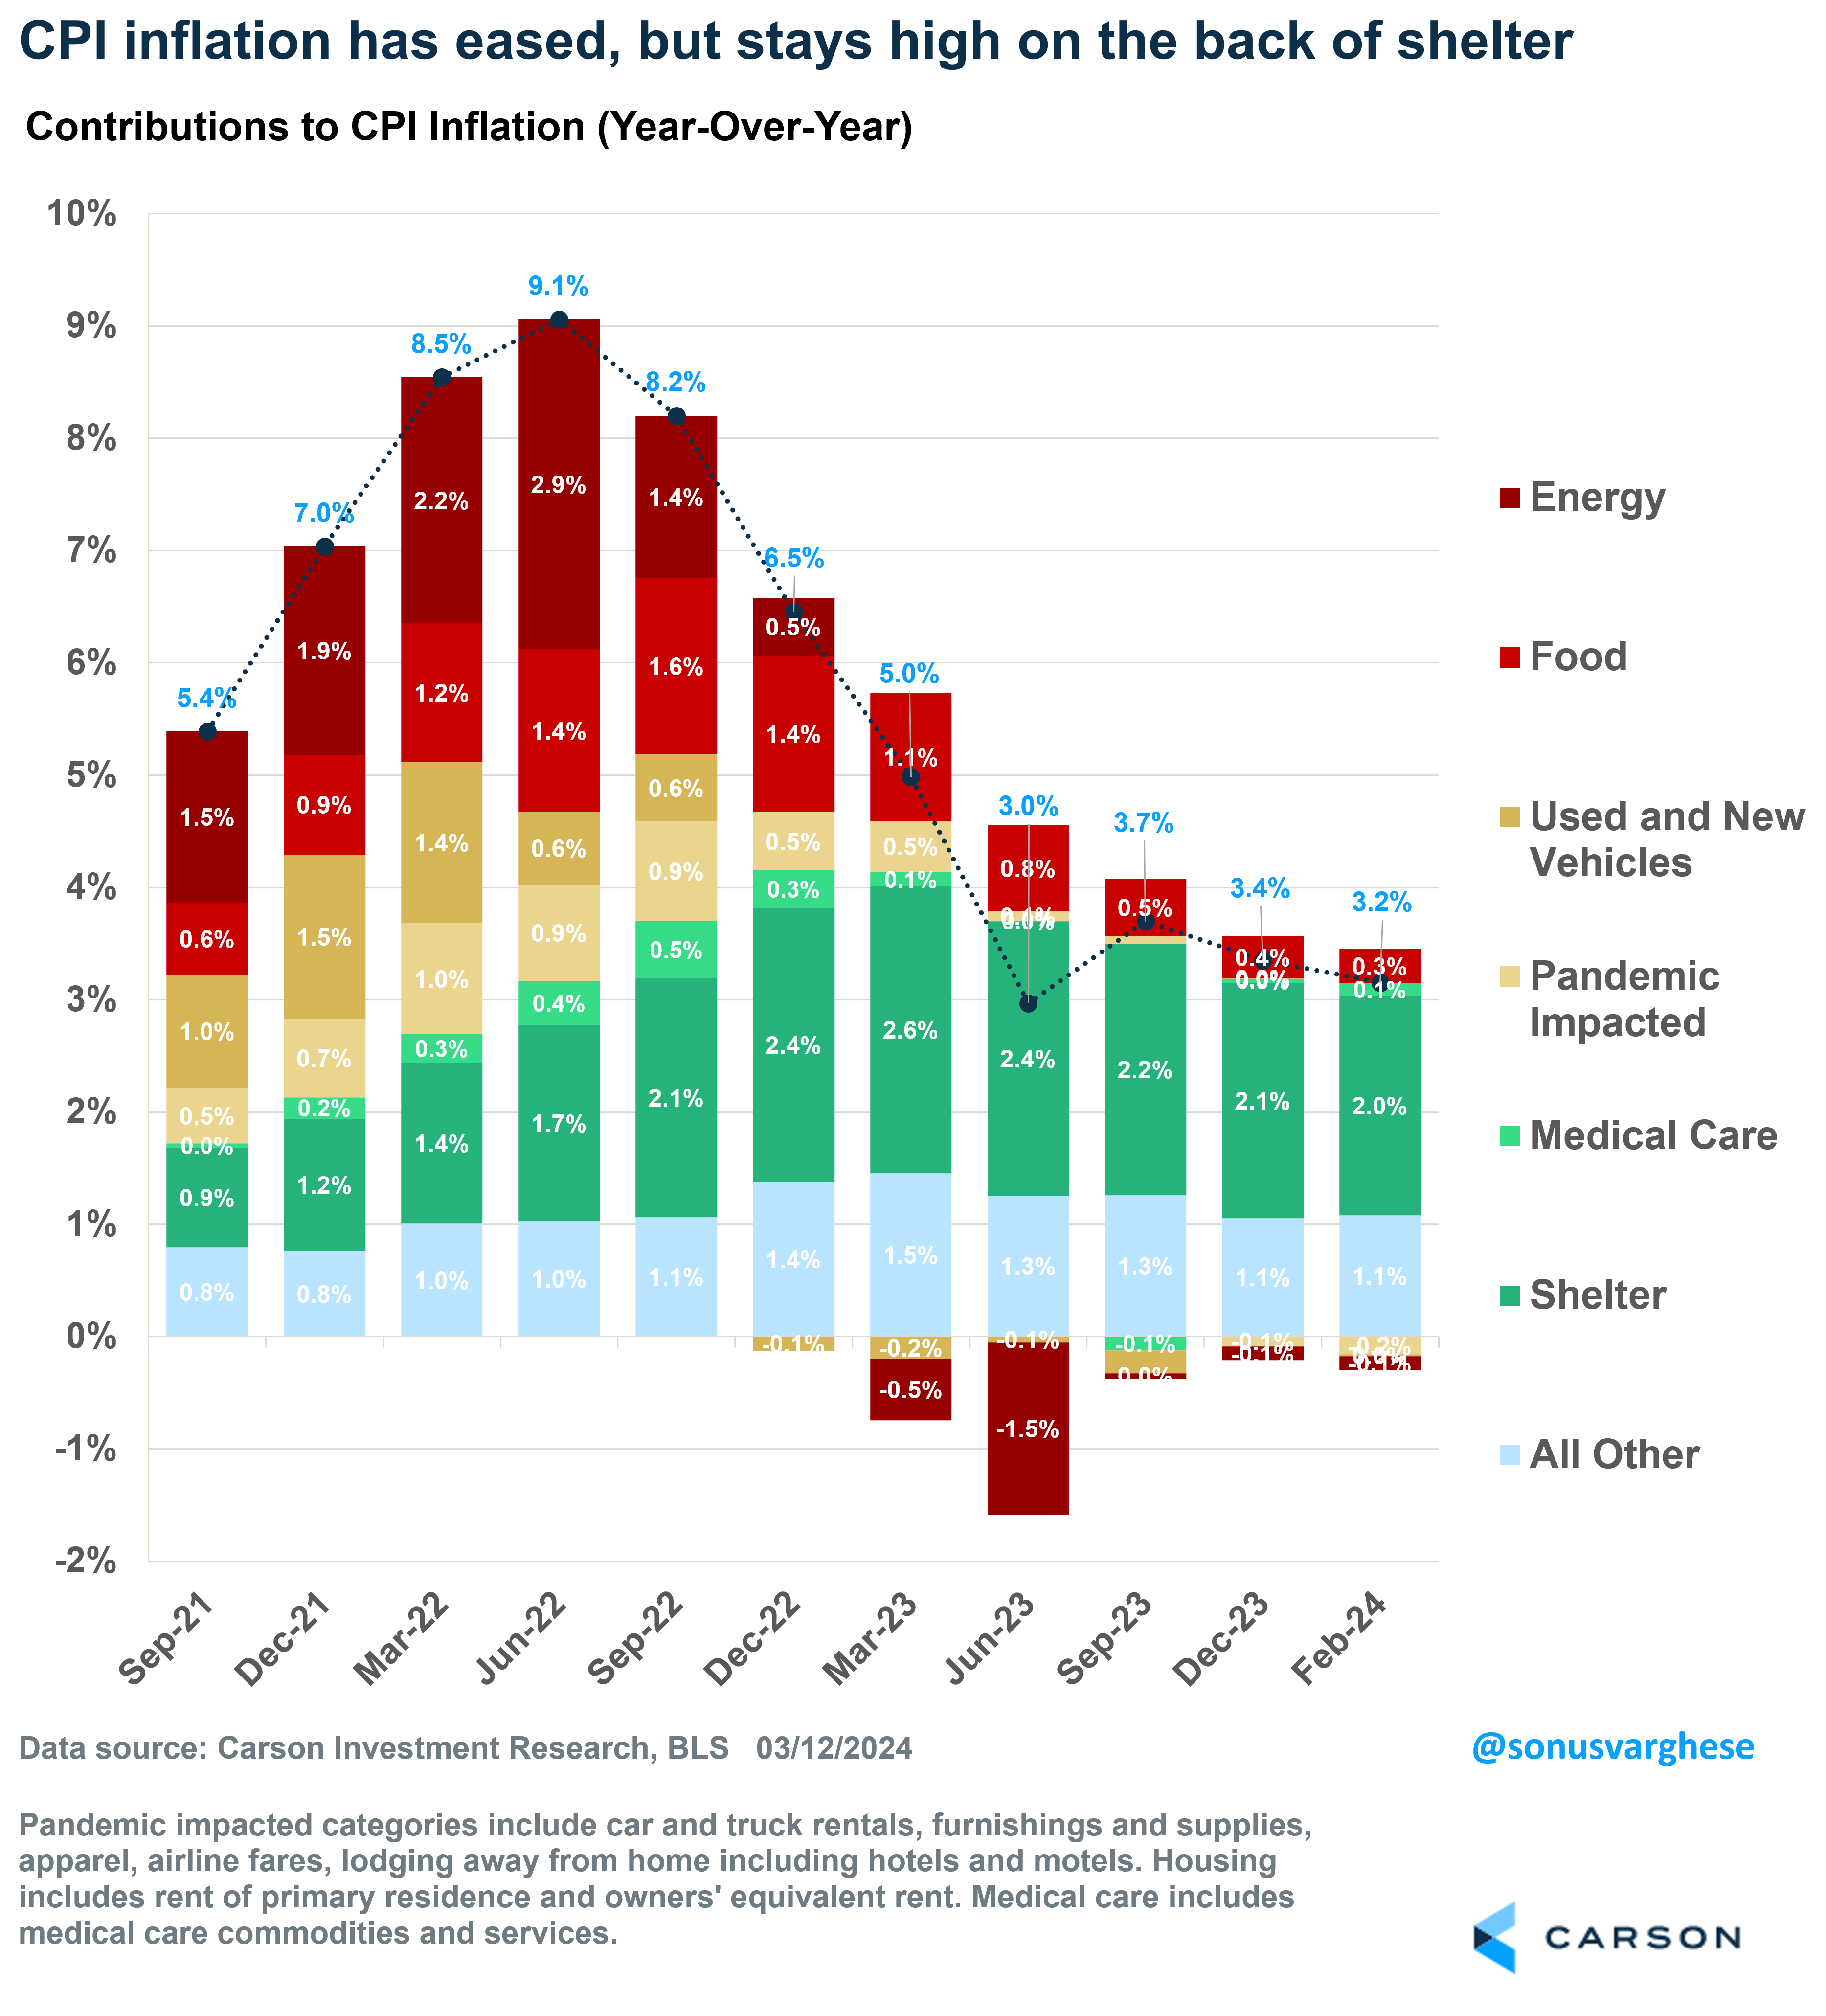
Here’s the big picture: Inflation has eased a lot since June 2022, when it hit 9%. However, it appears to have stalled at just over 3%. But as you can see in the chart below, shelter (dark green bar) has been the largest driver of inflation. No other category is contributing as much as shelter, and despite the February increase, the contribution from energy prices is nothing compared to what we saw in 2022. The good news is that the contribution from food prices (bright red bar) has also shrunk a lot.
Shelter Inflation: There’s Good News and Bad News
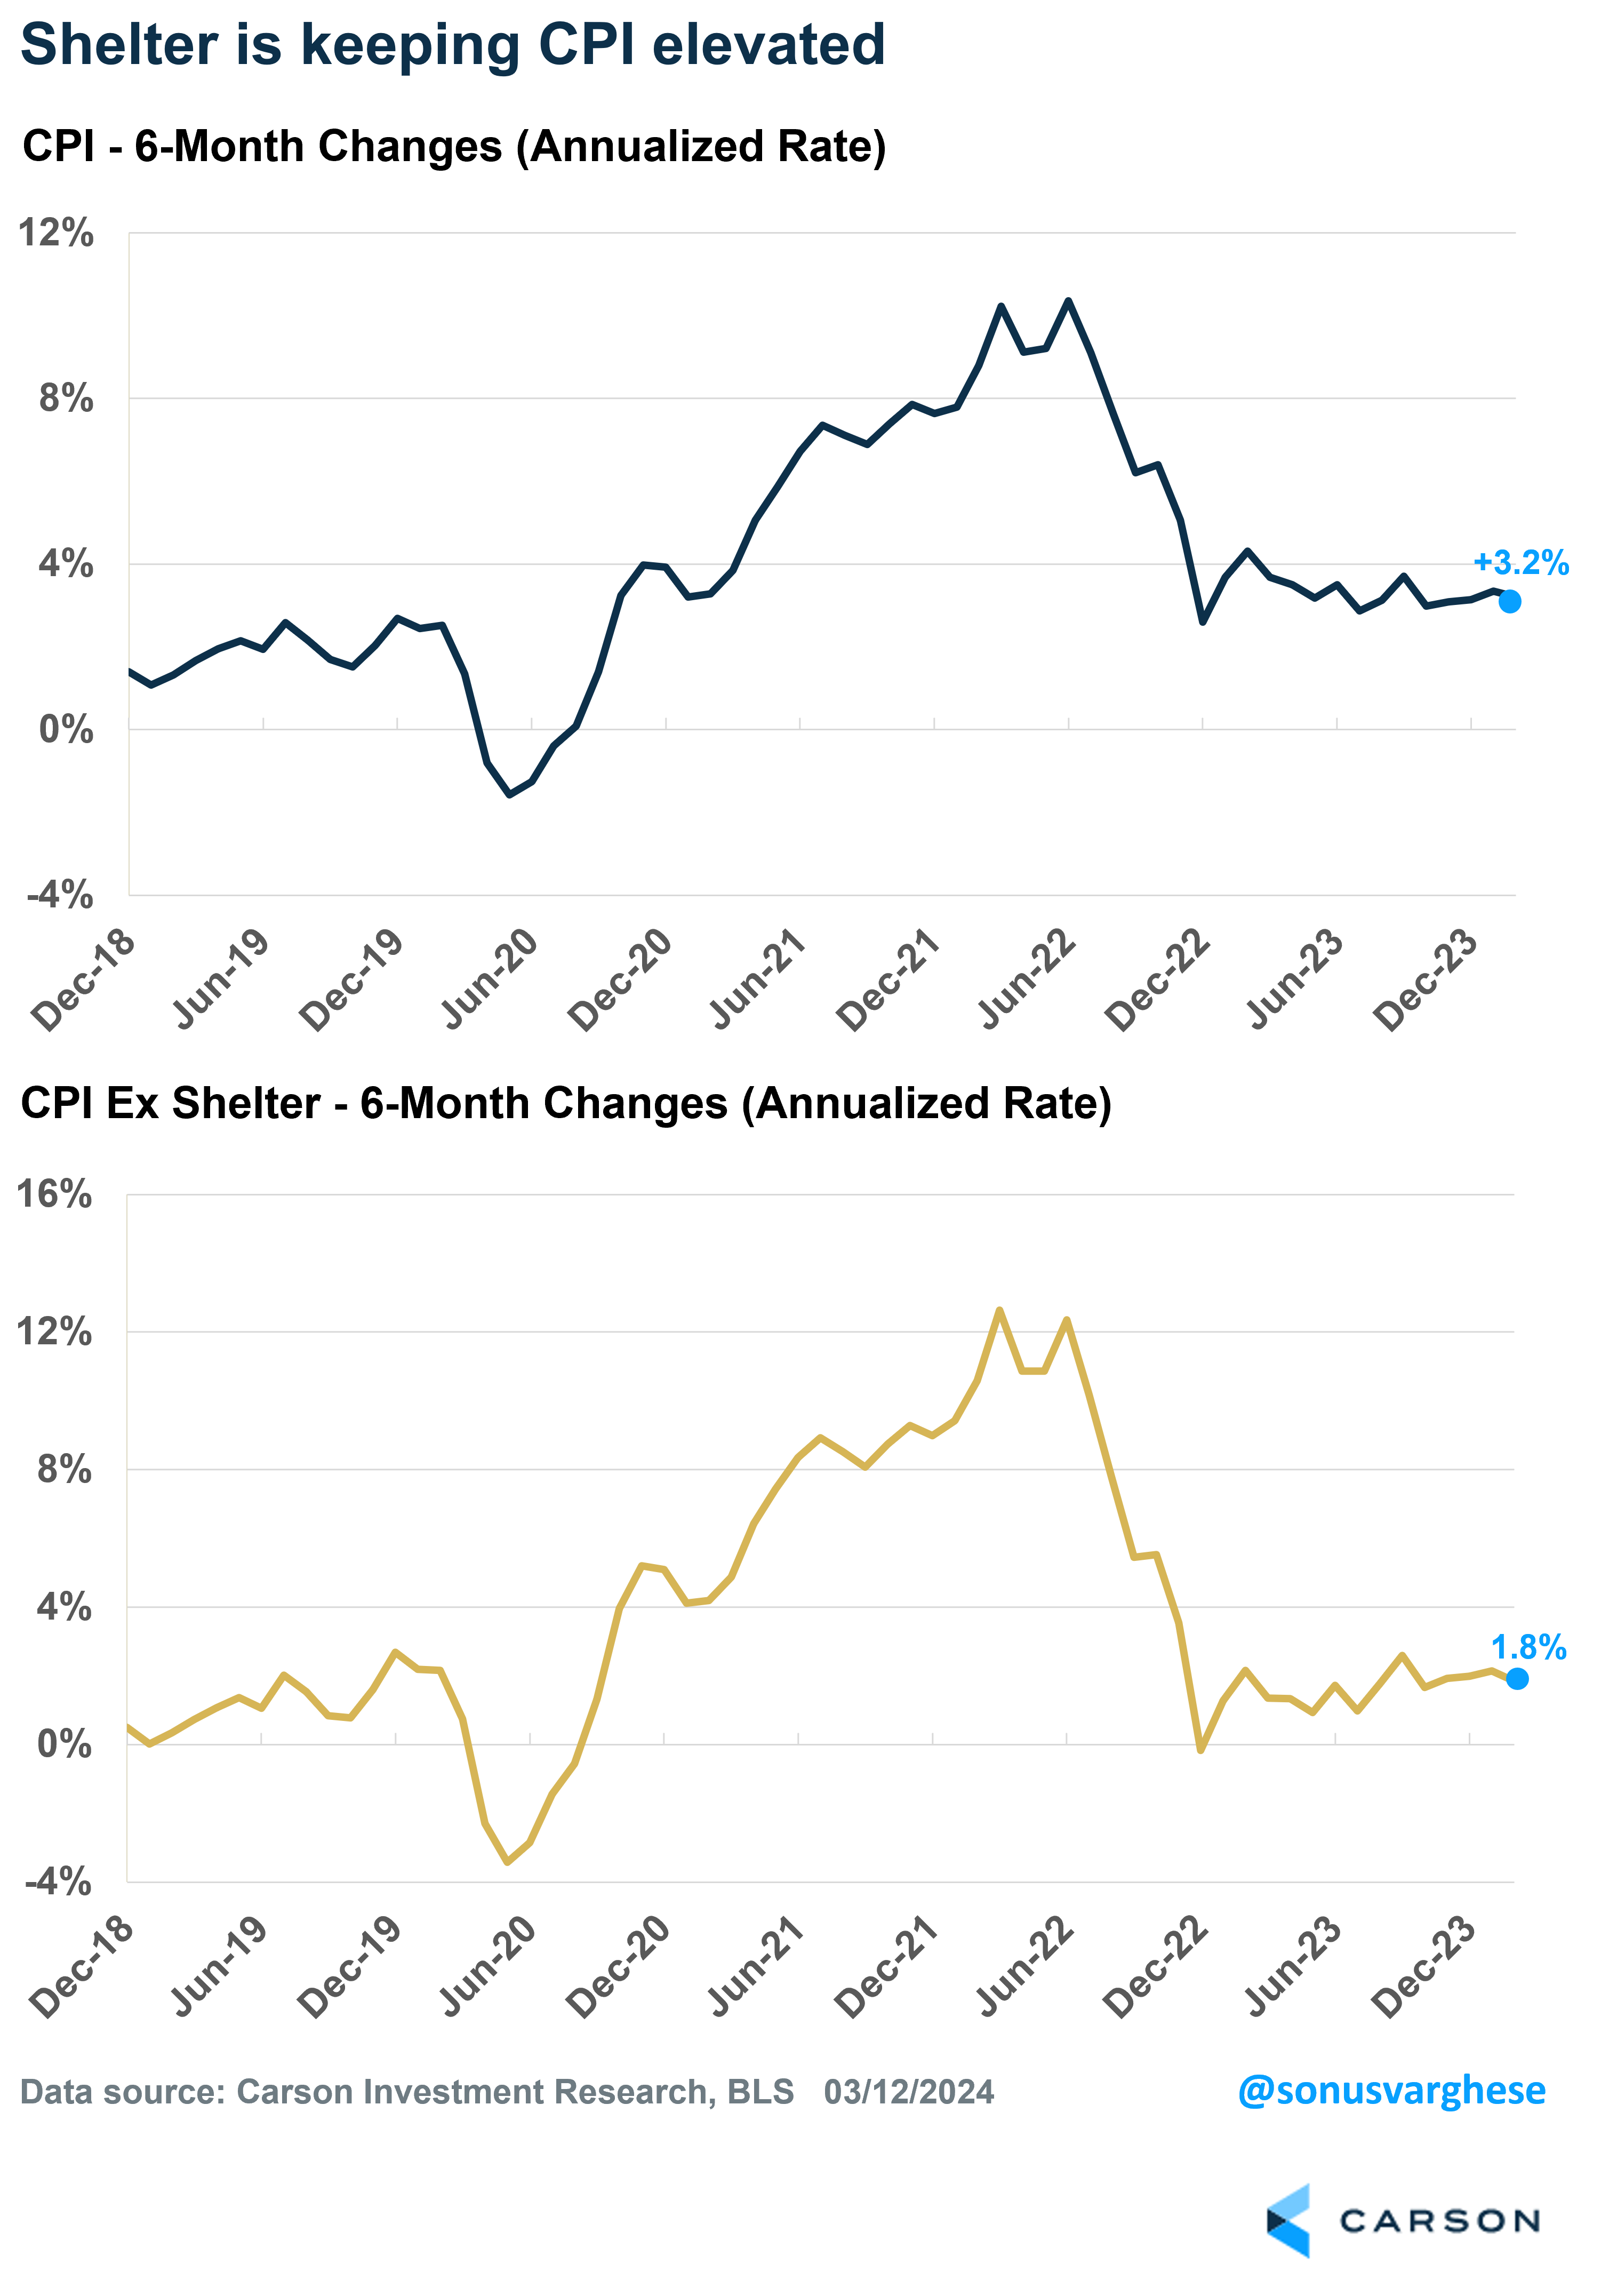
Last month I wrote about how shelter is keeping CPI inflation elevated. That’s still the case. If you exclude shelter, headline inflation is running at a 1.8% annualized pace over the last 6 months, similar to its year-over-year increase.
As I’ve explained previously, a big part of shelter is “Owners Equivalent Rent” (OER). It is the implicit price at which homeowners are assumed to rent their homes to themselves. It’s derived from market rents of single-family homes and has nothing to do with home prices, or mortgage rates. It makes up 27% of the CPI basket, which is ironic because a large majority of American households own their homes (66%) and do not experience anything like OER. Meanwhile, regular rents of primary residences make up 7% of the CPI basket. So, you can see how shelter can have an outsized impact on CPI inflation.
Stay on Top of Market Trends
The Carson Investment Research newsletter offers up-to-date market news, analysis and insights. Subscribe today!
"*" indicates required fields
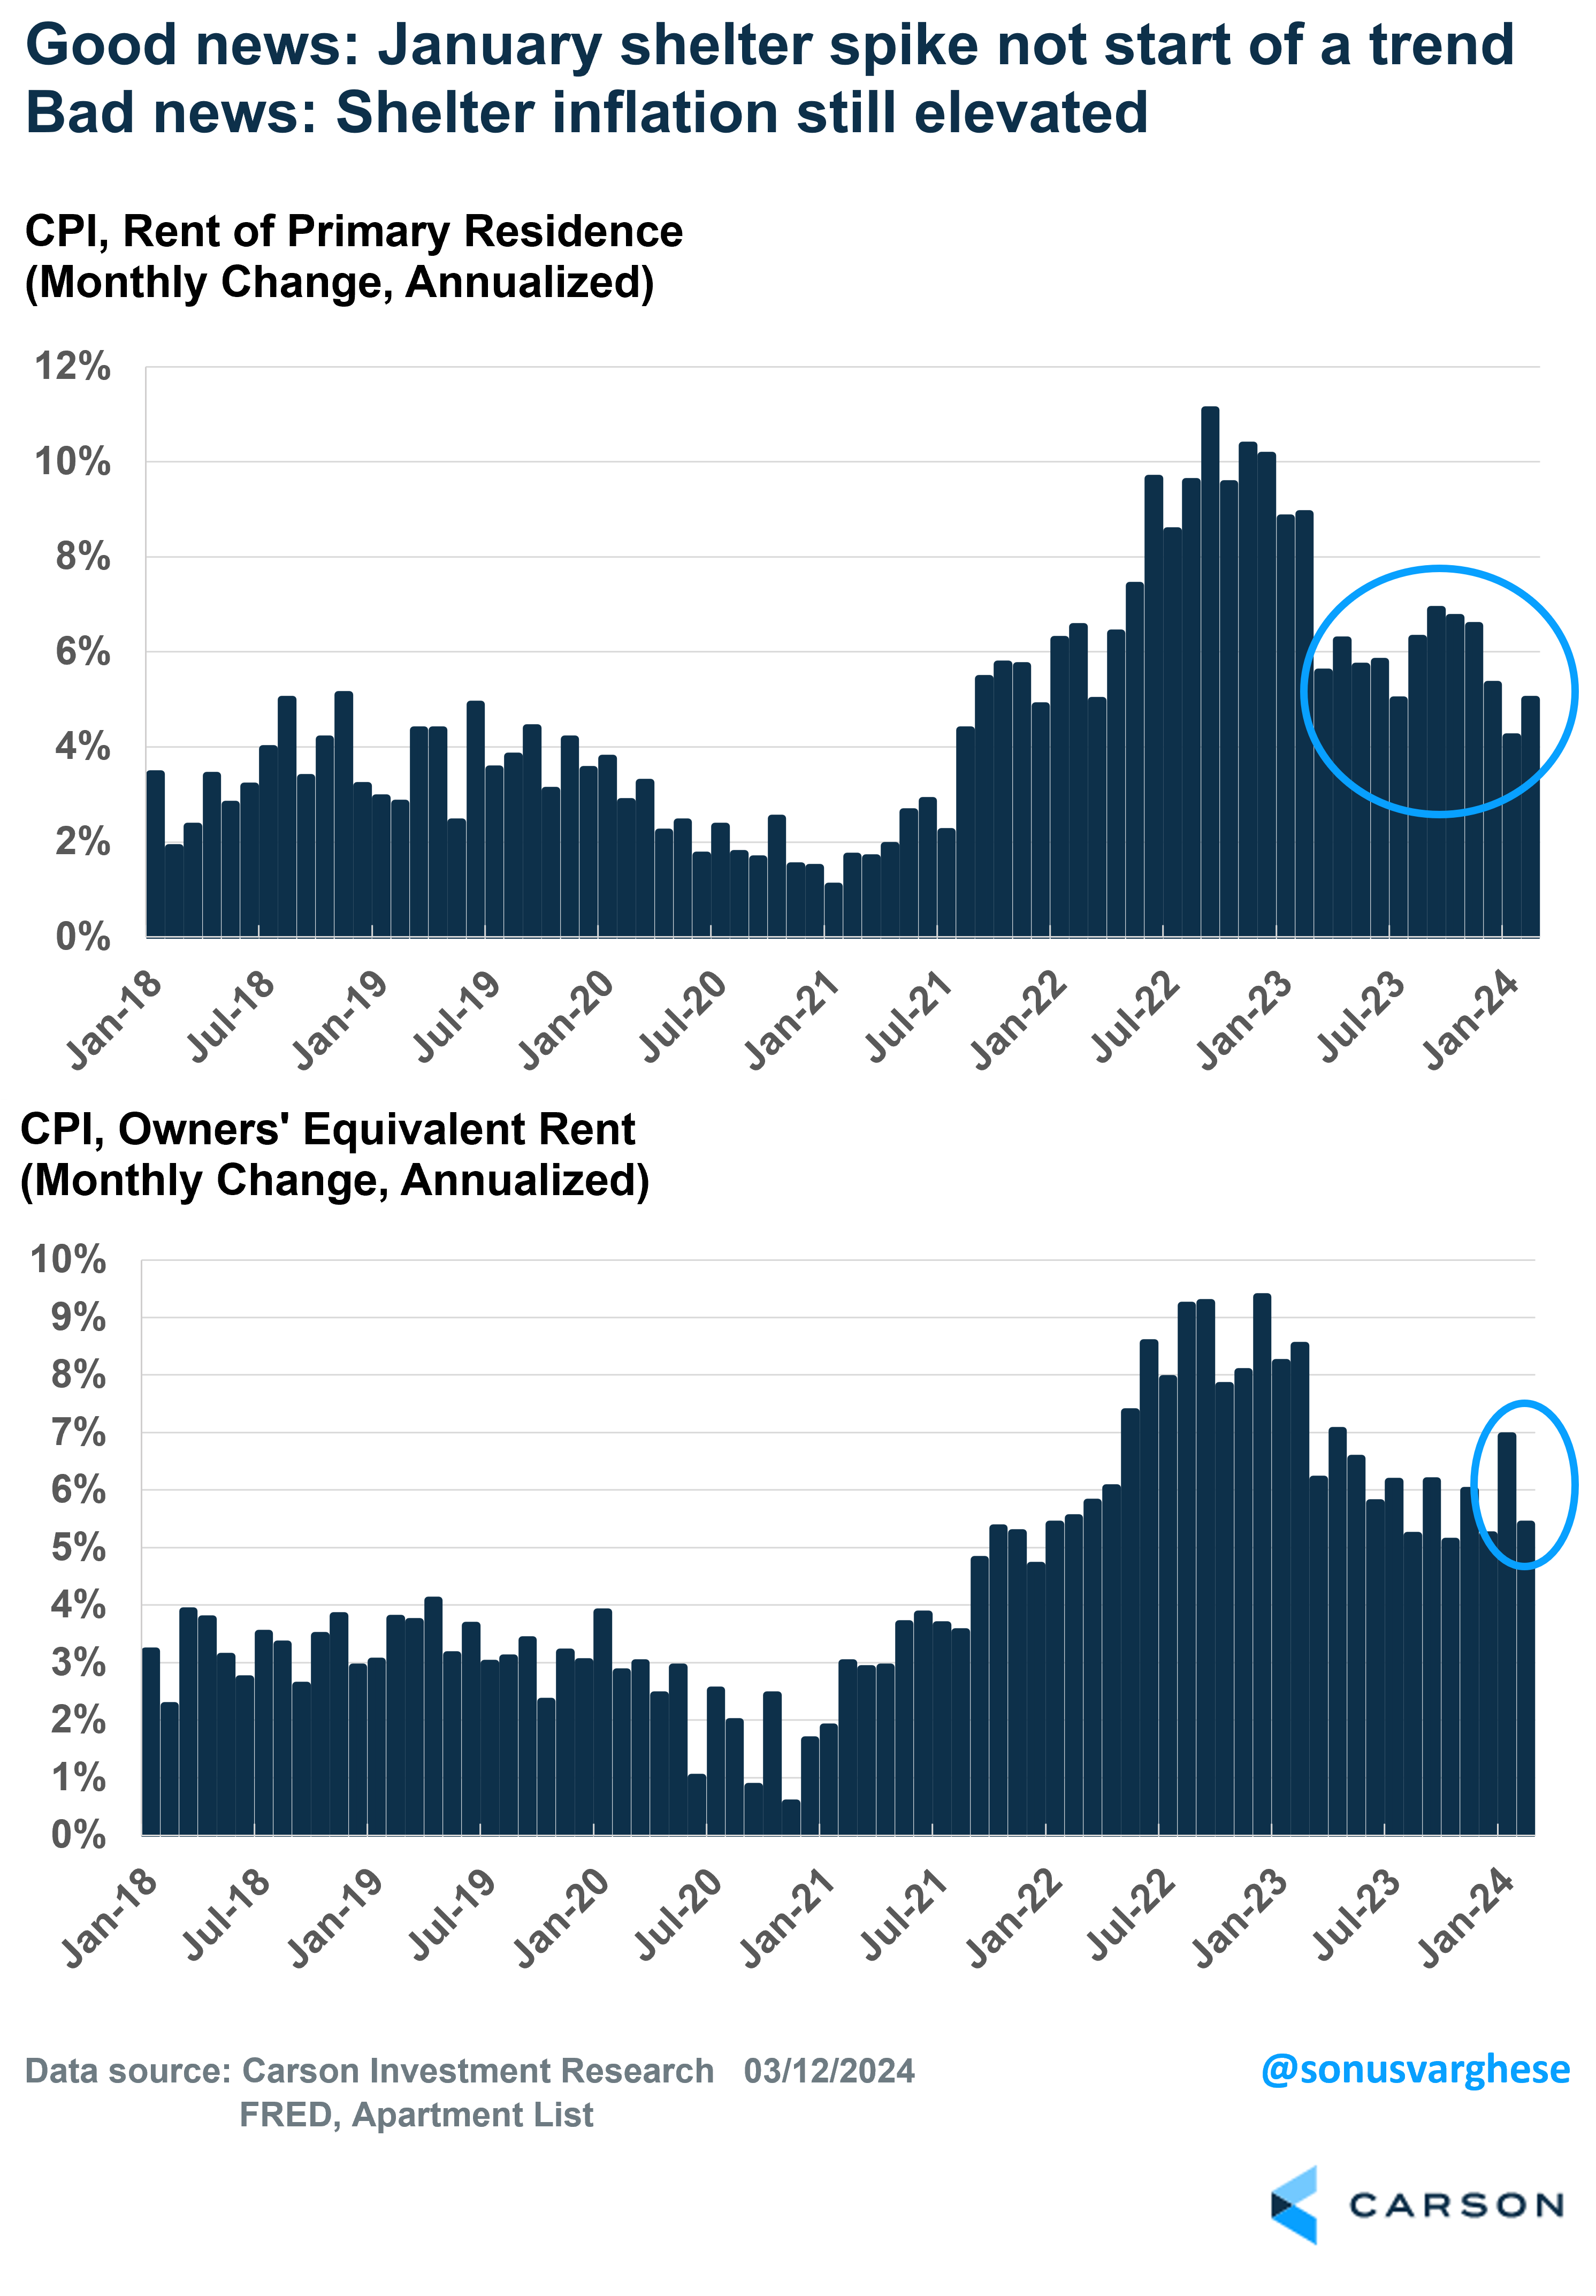
OER inflation unexpectedly surged in January to an annualized pace of 6.9%, the largest monthly increase in 10 months. There was some worry that this could potentially be the start of an unwelcome uptrend in shelter inflation, driving overall inflation higher. As I pointed out last month, the January surge was likely a one-off, and the good news is that February data reverted to what we saw in the fourth quarter. OER inflation rose at an annualized pace of just 5.4% in February. Regular rental inflation came in at 5.0% (annualized) – that’s slightly higher than in January, but lower than what we saw in late 2023. The bad news is that these readings are still elevated relative to where they were pre-pandemic (around 3-3.5%).
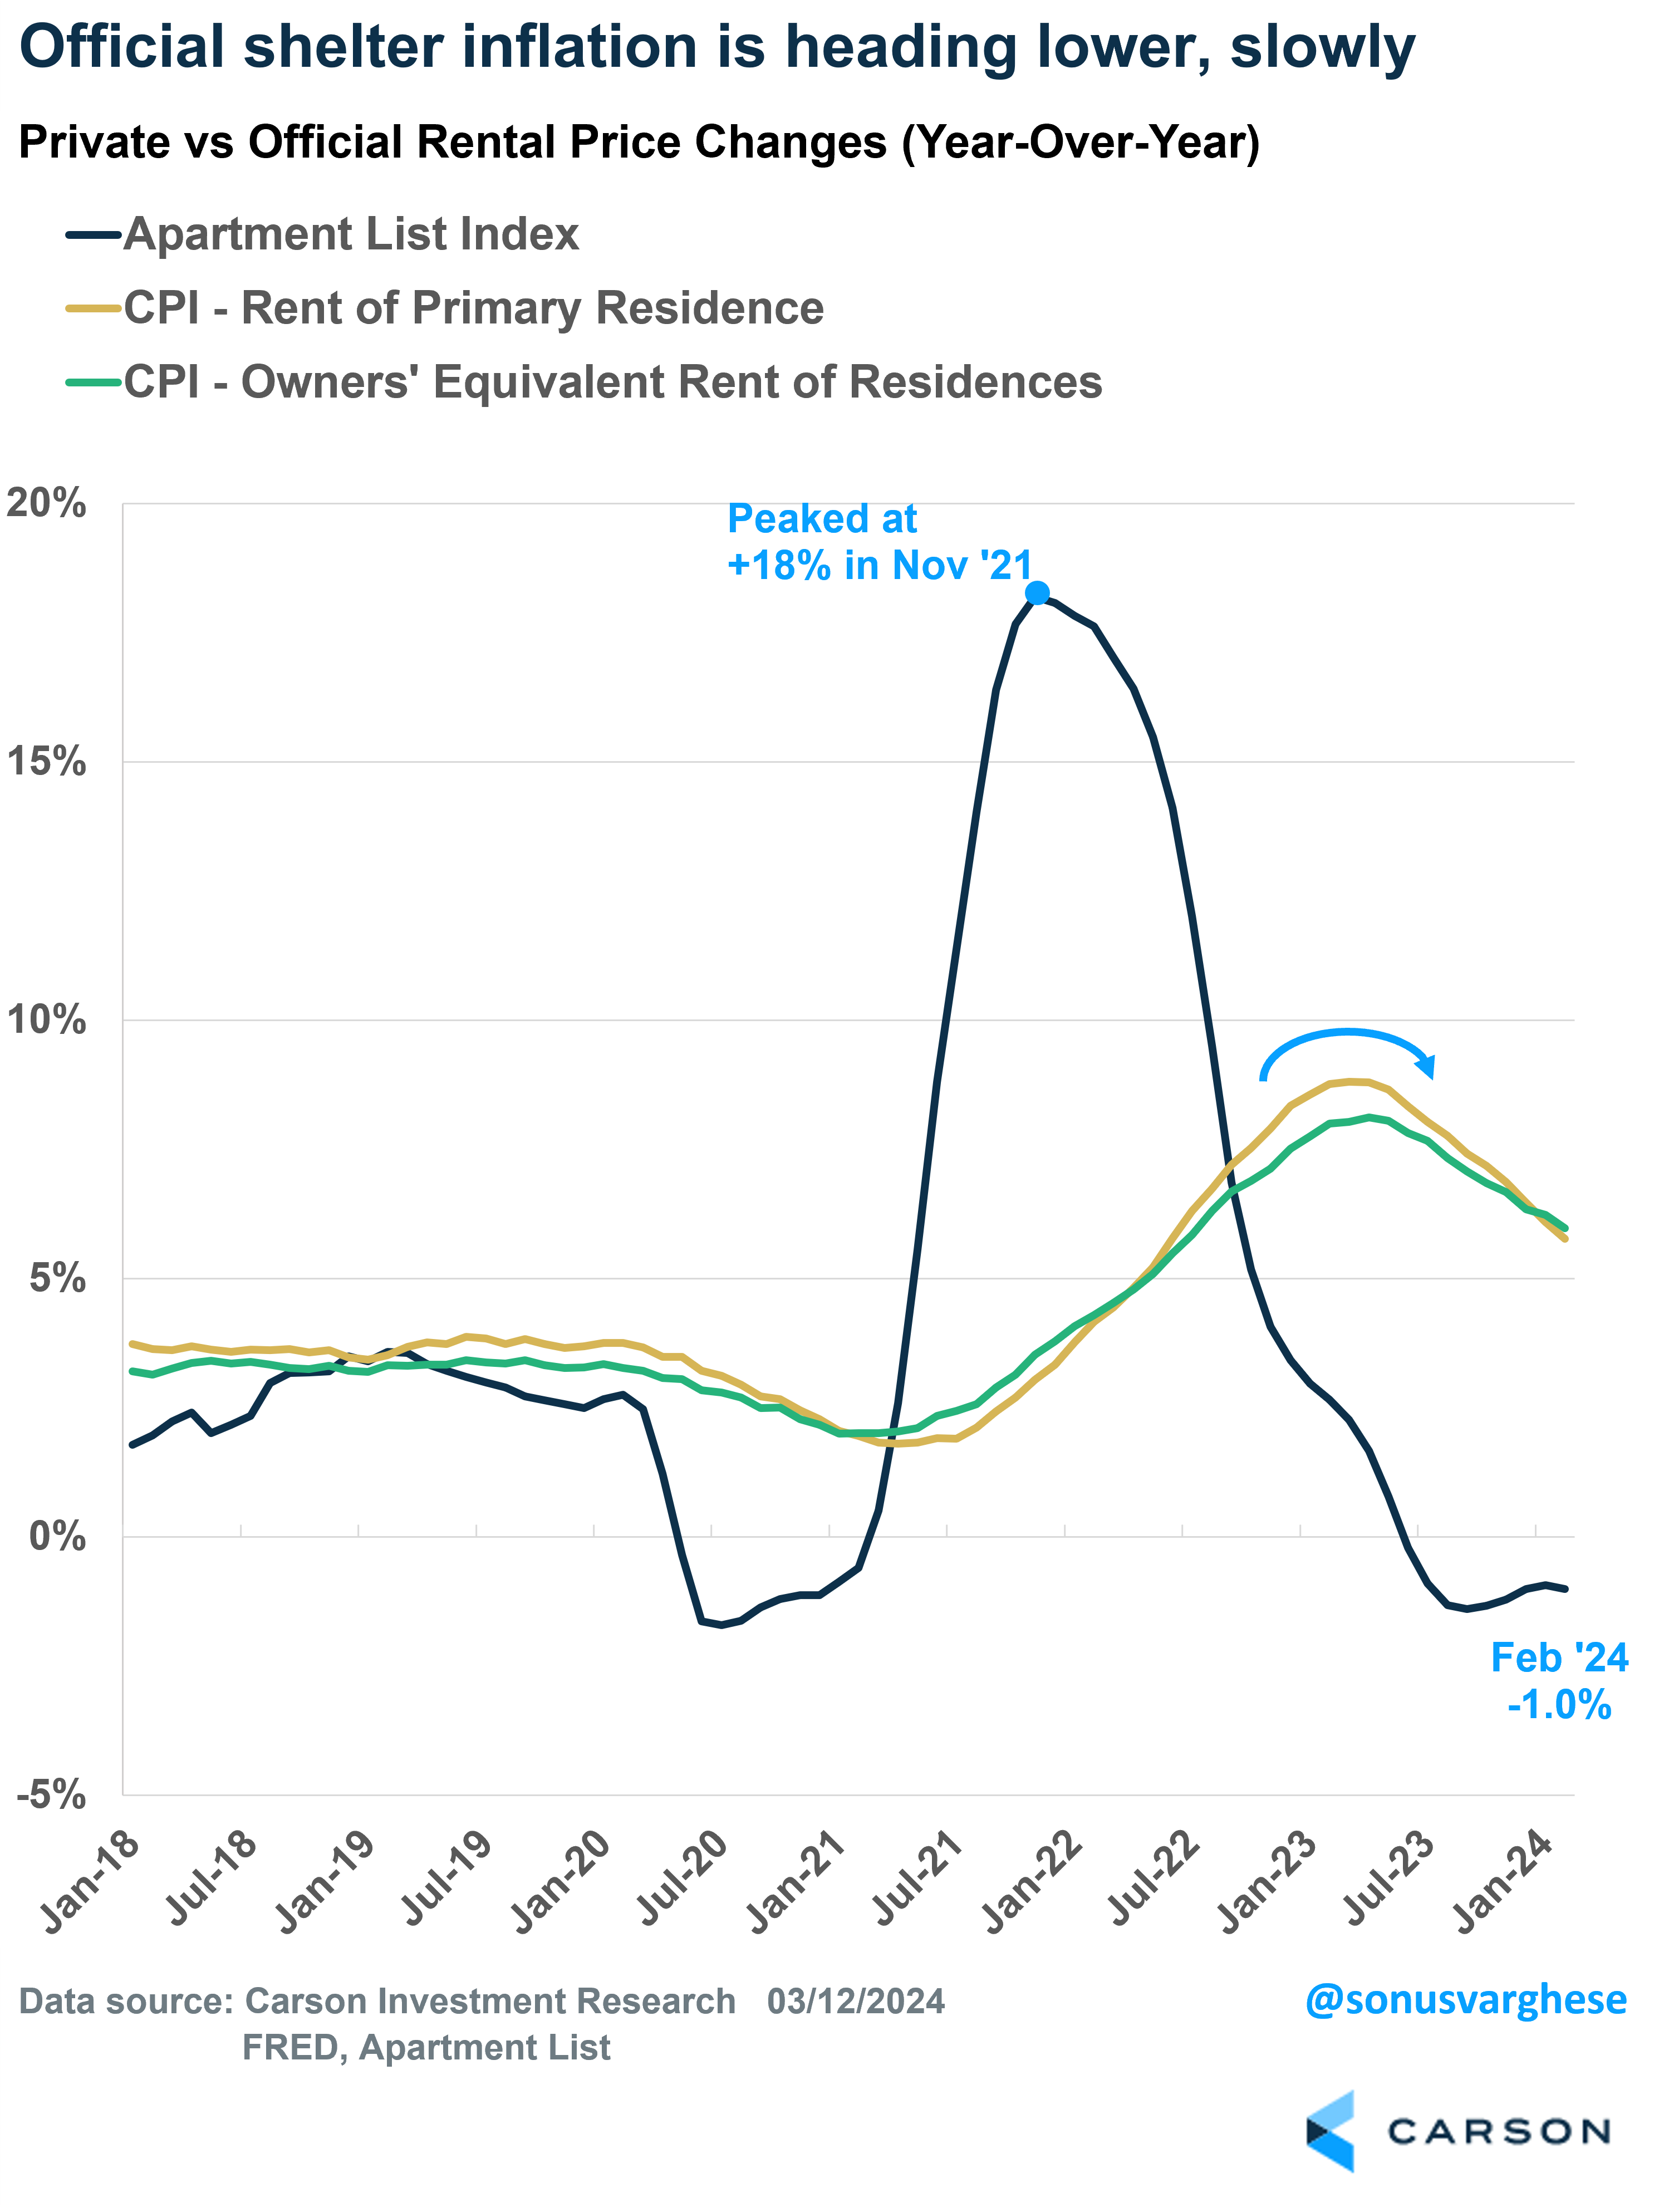
Looking ahead, rents and OER still appear to be following the path of private market data, albeit with a really long lag. What’s positive is that private data is still showing rents falling on a year-over-year basis, which means we needn’t be too worried about a resurgence in rental inflation.
Really Good News: Food Price Inflation Is Easing
This was underreported amidst all the headlines about the CPI data. But food price inflation is easing and that’s a big deal for three reasons.
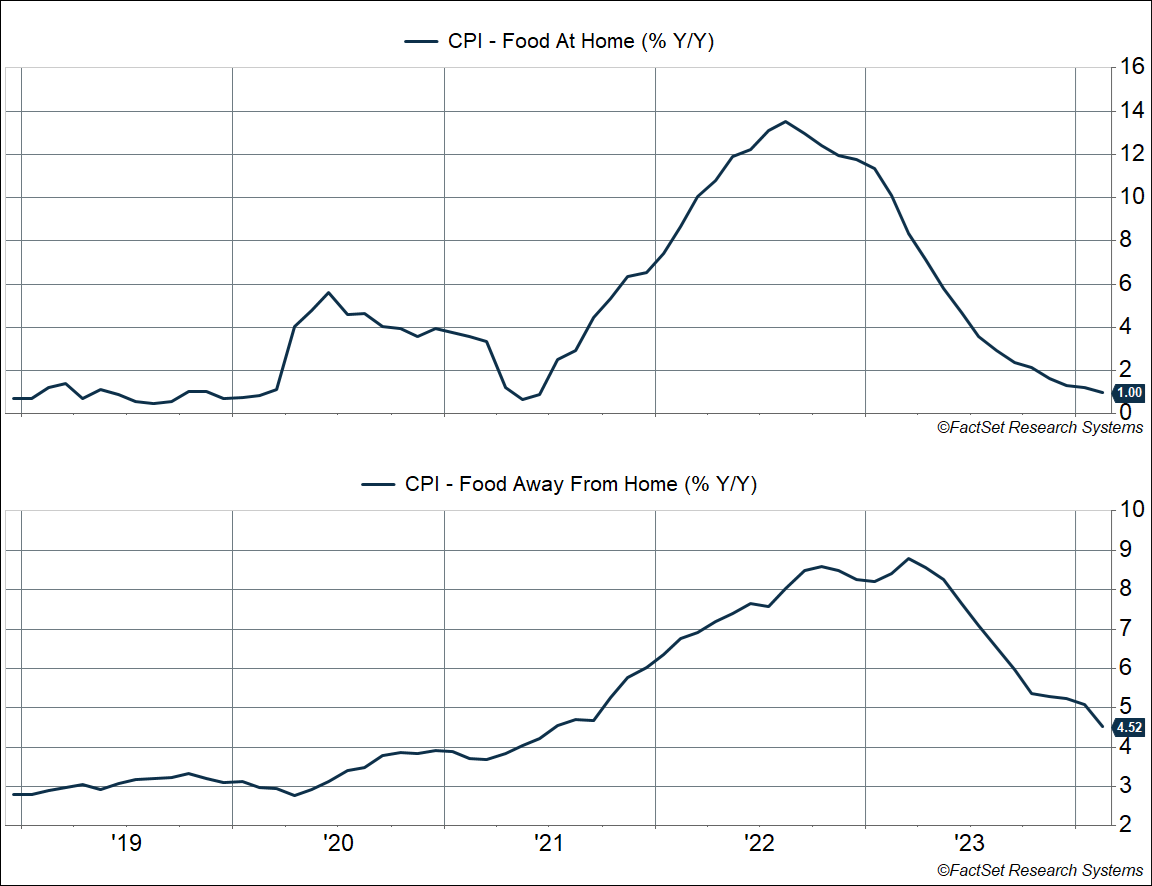
First, easing food inflation is a big boost to household wallets. Even more so than energy, food typically makes up a larger wallet share. And recent data is very encouraging. Grocery store prices (“food at home”) were flat in February, and it’s up just 1% over the last year. That’s down from a peak of 13.5%. Despite that, food services inflation, including fast food and full-service meals (“food away from home”), has been running strong recently. But we saw a big pullback in February, with prices rising just 0.1%. It’s still up 4.5% from last year, but that’s down from a peak of 8.8%.
Here’s a nice quote from Costco’s CFO during their earnings call, one that I thought nicely underlines what we’re seeing in the data:
“A couple of comments about inflation. In the last quarter, in the first quarter, we estimated that year-over-year inflation was approximately 0 to 1%.
We’ll now say that in Q2, it was essentially flat. And notwithstanding essentially flat, we’re taking price reductions where we can. Anecdotally, everything from simple items like reading glasses from $18.99 to $16.99, the 48 count of Kirkland signature batteries from $17.99 to $15.99, a 24-count of Pellegrino from $16.99 to $14.99 and even 4 pounds of frozen fruit plan for $14.99 down to $10.99 with new crop pricing. So we continue to do that.”
Second, easing food services inflation is positive for the Fed’s preferred inflation metric – personal consumption expenditures ex food and energy (“core PCE”). Interestingly, food services are not included in core CPI but it makes up 6% of core PCE and has been a driver of excess inflation on that side. So, the pullback is good news for core PCE inflation.
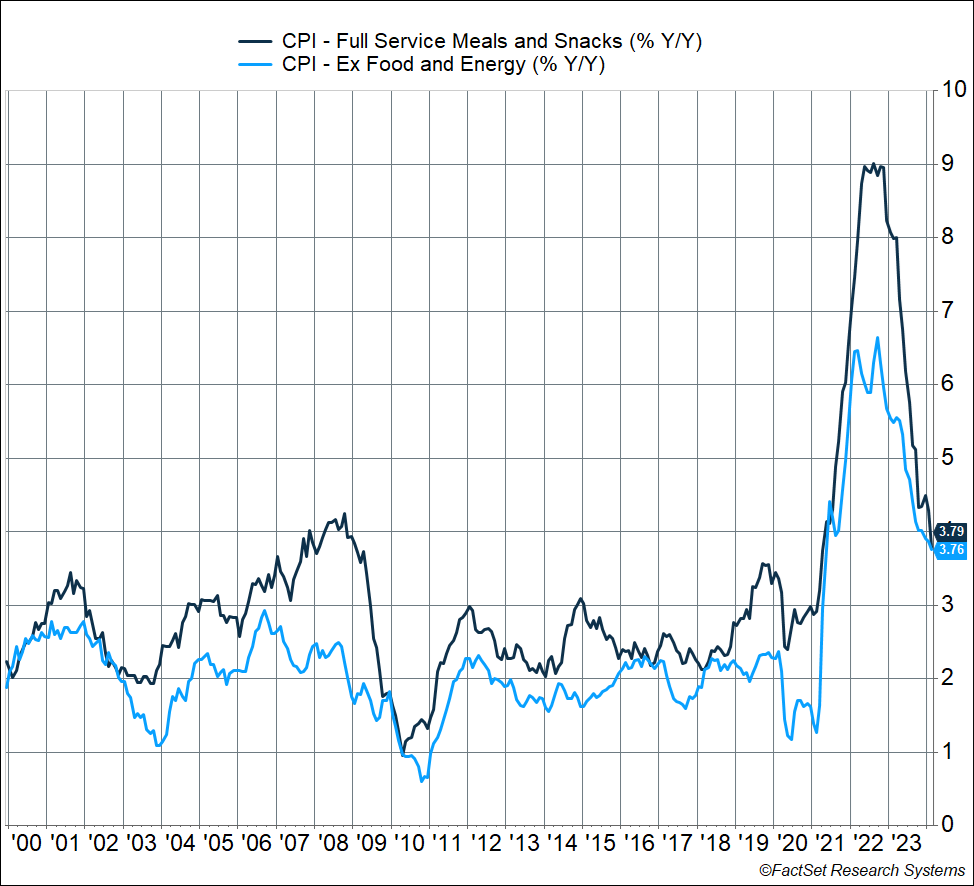
Third, easing food services inflation suggests that underlying inflation pressure is easing. Specifically, within foods services, “full service meals (and snacks)” has historically tracked core inflation verry closely. You can see this in the chart below. That’s despite only a 3% weight in the core CPI basket (Mathew Klein at the Overshoot has pointed this out before). In fact, it tracks core CPI better than OER (despite OER’s huge weight in the basket).
If you think about it, full-service restaurant meals combine several elements that go into inflation, including:
- Commodity prices – obviously food, but also energy prices to an extent (for things like crop fertilizers and diesel for transportation)
- Wages – for workers in restaurants
- Rents – of the restaurant premises
We’ve seen all of the above ease considerably over the last year, and that may be starting to show up in the inflation data. CPI inflation for full-service meals rose just 0.1% in February, the slowest monthly pace since August 2020. It’s up 3.8% from last year, but that’s down from a peak of 9% in 2022, and not far above its pre-pandemic pace of 3.5%. This more than anything else tells me that underlying inflation is running close to the Fed’s target of 2% (never mind shelter).
Here’s the Big Picture
As I noted at the top, inflation is easing, but with a few bumps along the way. CPI inflation was on the hotter side over the last two months, but there were positives under the hood of February data. The downtrend from late last year is intact, and importantly, core PCE inflation is likely to be softer than its CPI counterpart. Also, easing inflation for full-service restaurant meals suggests that we’re not looking at a resurgence of inflation. And that underlying inflation is already at, or close to, the Fed’s target.
This also means we’re still on track to see interest rate cuts in 2024, but less than what the market expected at the beginning of the year. We’ve always been in the camp that the Fed’s likely to cut rates by 0.75-1%-point in 2024, and we haven’t changed that view, assuming economic growth continues along trend (as seems to be the case now). That’s still positive for markets, as the Fed looks likely to cut rates into a strong economy, one that is seeing higher income growth thanks to easing inflation. In our latest Facts vs Feelings episode, Ryan and I chatted about how sentiment is beginning to shift as skeptics acknowledge the more positive outlook.
For more content by Sonu Varghese, VP, Global Macro Strategist click here.
02155709-0324-A