In our 2026 Outlook: Riding the Wave, we took a look at the average return for the S&P 500 (and the likelihood of a positive year) for all years versus only years when the economy is growing (avoids a recession), consistent with our base case for 2026. Not surprisingly, when you take recessions off the table, historical returns have looked better, and the S&P 500 is higher more often. But while that result is not surprising, it’s often neglected.
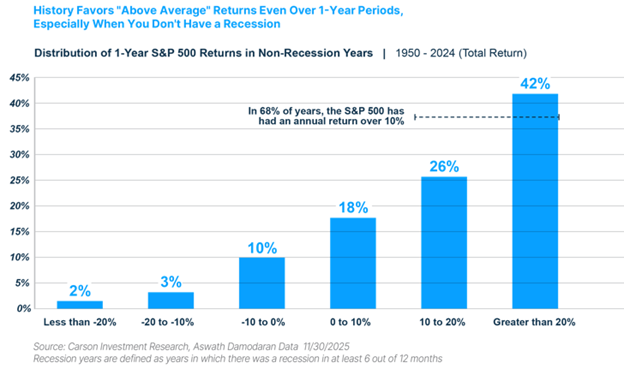
Now you can never completely take the possibility of a recession off the table, but with the Federal Reserve in cutting mode (even if they go more slowly this year), fiscal stimulus starting to make itself felt in earnest, strong corporate and household balance sheets, AI-driven investment, and continued corporate resiliency, it’s very fair to call those odds low.
Today I want to look at it from another angle. It’s a lower bar, but it makes a similar point that may be more meaningful for some investors. Since many investors are prone to worry, instead of saying we’re going to have a good year (our Outlook forecast is a 12-15% total return for the S&P 500 in 2026), let’s say some investors may be reassured if they saw solid evidence that we were quite unlikely to see a bad year.
How do we define a bad year here? Below is a chart of the S&P 500 total return for every calendar year since 1928, bucketed in 10% increments. Let’s define a bad year as the 12 calendar years where the S&P 500 returned less than 10%, the “dirty dozen” of bad to very bad years. Keep in mind that these are calendar year returns, and peak-to-trough returns will be worse, but it gives us a pretty good picture of years to review.
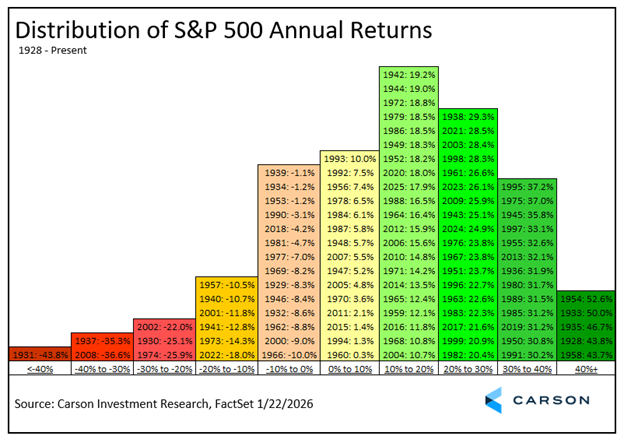
By decade, the dirty dozen includes three from the 30s, two from the 40s, one from the 50s, two from the 70s, three from the 2000s, and one from the 2020s. That means there are none from the 1960s, 1980s, 1990s, or 2010s, and we average a little more than one a decade. A nice little quiz on how you perceive markets is to ask yourself how frequently the calendar year return for the S&P 500 has been below 10%. If you guessed less than 15% of the time (12 times out of 98 years is 12.2% of the time), give yourself a pat on the back for knowing your market history.
I’ll say up front that I can’t account for the “unknown unknowns,” and many of these years were at least a modest surprise for many investors and several a big surprise. That has to be true, or the downside risk would have been priced in earlier. But that’s actually something we believe investors should be grateful for, because if the future were clearer, stocks would behave more like bonds, including bond-like returns. As we often like to say around here, volatility is the toll we pay to invest (and get stock-like returns). But not all major “unknown unknowns” end up qualifying for the dirty dozen. 2020 is a great example — we had a once-in-a-century global pandemic that led to a massive short-term decline in global growth, but hyper-aggressive fiscal and monetary stimulus on top of “warp speed” development and deployment of vaccines (to take the Trump administration’s name for the project) resulted in the S&P 500 returning 18% for the year despite some record volatility.
Let’s start off just by observing that nine of the 12 years are associated with recessions (all except 1940, 1941, and 2002, although there is some debate about how to count that. The recession in 2001 was shallow, but 2002 could be viewed as an extension of the 2001 selloff. So, if you want to be simplistic about it, the no recession scenario eliminates nine cases. Not being on the verge of a global world war eliminates two. And no, the “heightened geopolitical risk” we’re experiencing right now doesn’t come close to the size and scope of global military mobilization and conflict in those years nor do we have the economic backdrop, a decade-long global Great Depression, that was a contributory cause of WWII. That makes 2022 the only non-recessionary dirty dozen year not associated with WWII. What happened in 2022? We saw the highest inflation and most aggressive Federal Reserve tightening cycle in 40 years, something we are not experiencing now, with the Fed in cutting mode and inflation, while still elevated compared to the Fed’s 2% target, not even in the same zip code.
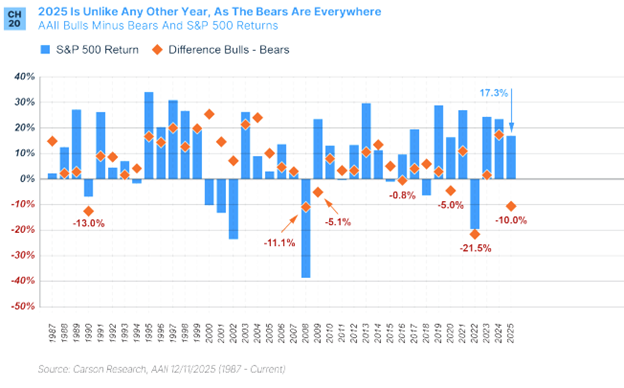
That leaves us with the nine recessionary years to look at, and we have little of the cycle of overconfidence, overborrowing, and overspending that you often see before a recession. Let’s look at overconfidence. Confidence, both in markets and the economy, has been muted based on consumer and market participant surveys. In fact, you could argue that the spread between market confidence and market returns was at a record level in 2025, a point we raise in the Outlook with the chart below by looking at the AAII Investor Sentiment Survey versus the actual return. If overconfidence is a potential recession warning, it’s certainly not one we’re getting now. At worst, we can see there is some localized overconfidence in some areas of the economy, but the kind of overconfidence that tends to be a recession catalyst usually appears across the economy.
Healthy consumer and business balance sheets also show that we have not seen an epidemic of overborrowing. Yes, the AI arms race and infrastructure buildout has led some companies that were cash flow superstars to fund some investment through new borrowing, but we are still early compared to past leveraging cycles. On the consumer side, my colleague Sonu Vahrghese, in a recent blog, outlined how “household balance sheets are in the best shape we’ve seen for decades,” and not just for the wealthy. It holds across income levels.
Taking a somewhat deeper dive into the “dirty dozen,” it’s fair to ask if the circumstances for any of them have similarities to today.
Let’s start by taking out the Great Depression (1930, 1931, 1937). If we think that the odds of a recession were low, all the more so for a depression. 1930 came after a highly leveraged, peak-overconfidence stock market bubble. 1937 was a reaction to too early policy tightening that occurred when it looked like the economy might be starting to grow again. Not the situation that we’re in now.
Then there’s the 1970s (1973, 1974), the oil supply shock, stagflation, a recession, and the impact on earnings and multiples. While economies (and inflation) always have some vulnerability to oil shocks, the present vulnerability of the US economy is much lower than it was pre-shale revolution, as the US is now a net oil exporter.
1957 is an interesting case. The Fed was in a condition of “restraint,” signaling restrictive conditions, due to inflation, which was followed by a recession with the accompanying market declines. When we think of how recessions typically work and the market reaction, we think of something like this, but that may just reinforce that no cycle is really typical. This may be the type of cycle that is most similar to current conditions, but only because it’s the closest you come to a garden-variety cycle. But if that’s true, we’re at a much earlier point with the Fed still easing. Also, the deficit ran at a surplus in 1956 and 1957, while today we are experiencing aggressive deficit-financed stimulus.
We’re down to three years, and here we start to find some similarities, none of them compelling, but some of them notable. We already took 2022 off the table when looking at the non-recessionary members of the dirty dozen.
2008 is instructive because it’s the end of a capex cycle, and when the current AI capex cycle ends there, we could very likely see some pain, although we think there will be a longer-term benefit. But the analogy only extends so far. The risk related to the housing boom had become embedded in the entire financial system, which made the eventual end of the cycle extremely painful. The current AI capex spend is historically high (see Sonu’s blog from last week), but whatever the risks associated with AI broadly, any systemic financial system risks are much smaller.
And then there’s 2001 and 2002. Here is where things probably come closest: the end of a technology-related capex buildout led to a multi-year reset of the S&P 500, but without deep, broader contagion across the economy. There was a recession, but it was relatively mild. Still, valuations had run way ahead of themselves and required a major reset, especially among growth stocks, to a degree not very comparable to now. Even with the similarities, the differences with today are striking:
- Nosebleed level valuations (2000) v elevated valuations (2026)
- Weak or absent profitability (2000) v strong profitability (2026)
- Often negative free cash flow (2000) v still solid free cash flow despite the capex spend (2026)
- Massive IPO surge (2000) v a muted IPO surge (2026), although that may have to do with a structural shift toward private markets
- Weak balance sheets (2000) v strong balance sheets (2026)
So, while 2000 does share some structural features with the current moment, like 2008, there isn’t nearly the same level of underlying weakness that acted as a multiplier when markets reversed.
That covers the dirty dozen, but there’s the possibility (even the likelihood) that we see something different from what we’ve had in the past next time. In some ways, that’s almost a truism. But outside the most extreme shocks, the next edition of the dirty dozen may also have some combination of structural features from the past (inflation shock, Fed tightening, systematic risk, overconfidence / overborrowing / overspending). We have some vague sense of the lead candidate for the eventual underlying cause with the capex cycle, but nothing happening right now bears a strong similarity to previous years with strong equity selloffs yet. That doesn’t mean we can’t get a surprise or discover some deeply hidden systematic risk, but right now, those can only be given the typical very low odds of an extreme event in general.
The bar for the argument in this blog was relatively low — make an argument that conditions don’t look structurally like previous years that saw an S&P 500 decline of more than 10%. But even getting to that point can be important. Under any condition, investors should be appropriately invested for their risk tolerance, but if the risk of a more than 10% decline in a calendar year is lower than average, we believe it’s appropriate to be at the more aggressive end within those limits. For some investors, going at it this way may be more emotionally and intellectually compelling than thinking about a target 12-15% gain.
But (and it’s a very important “but”) it does mean a commitment to patience with the intermittent, and often surprising, volatility markets inevitably send our way. One simple definition of risk tolerance is being only as aggressive as the level at which you can tolerate a larger-than-expected decline in broad markets without selling, since selling low (which evidence surprisingly suggests is the point at which the temptation to sell is highest) has historically been a costly mistake. Volatility is indeed the toll we pay to invest. We believe that toll is relatively inexpensive right now, but it becomes very expensive if it turns out you’re unwilling to pay the toll when it looks like the chips are down.
For more content by Barry Gilbert, VP, Asset Allocation Strategist click here.
8779889.1. – 18FEB26A
