
Ouch! That was my reaction to the hotter-than-expected January Consumer Price Index (CPI) report, though that was mild compared to what happened in markets. The S&P 500 fell 1.4% on Tuesday. Bond prices fell as well, with 2-year and 10-year Treasury yields jumping 0.14%-points to 4.63% and 4.31%, respectively. This was on the back of a big shift in the narrative around Federal Reserve rate cut expectations – the timing of the first cut is now pushed out to June and investors are pricing in about 4 rate cuts in all of 2024, equivalent to 1%-point. A month ago, investors believed the first cut would happen in March and the Fed could cut 6-7 times in 2024. That’s a big shift in a relatively short period of time, and the January CPI data underlined the shift.
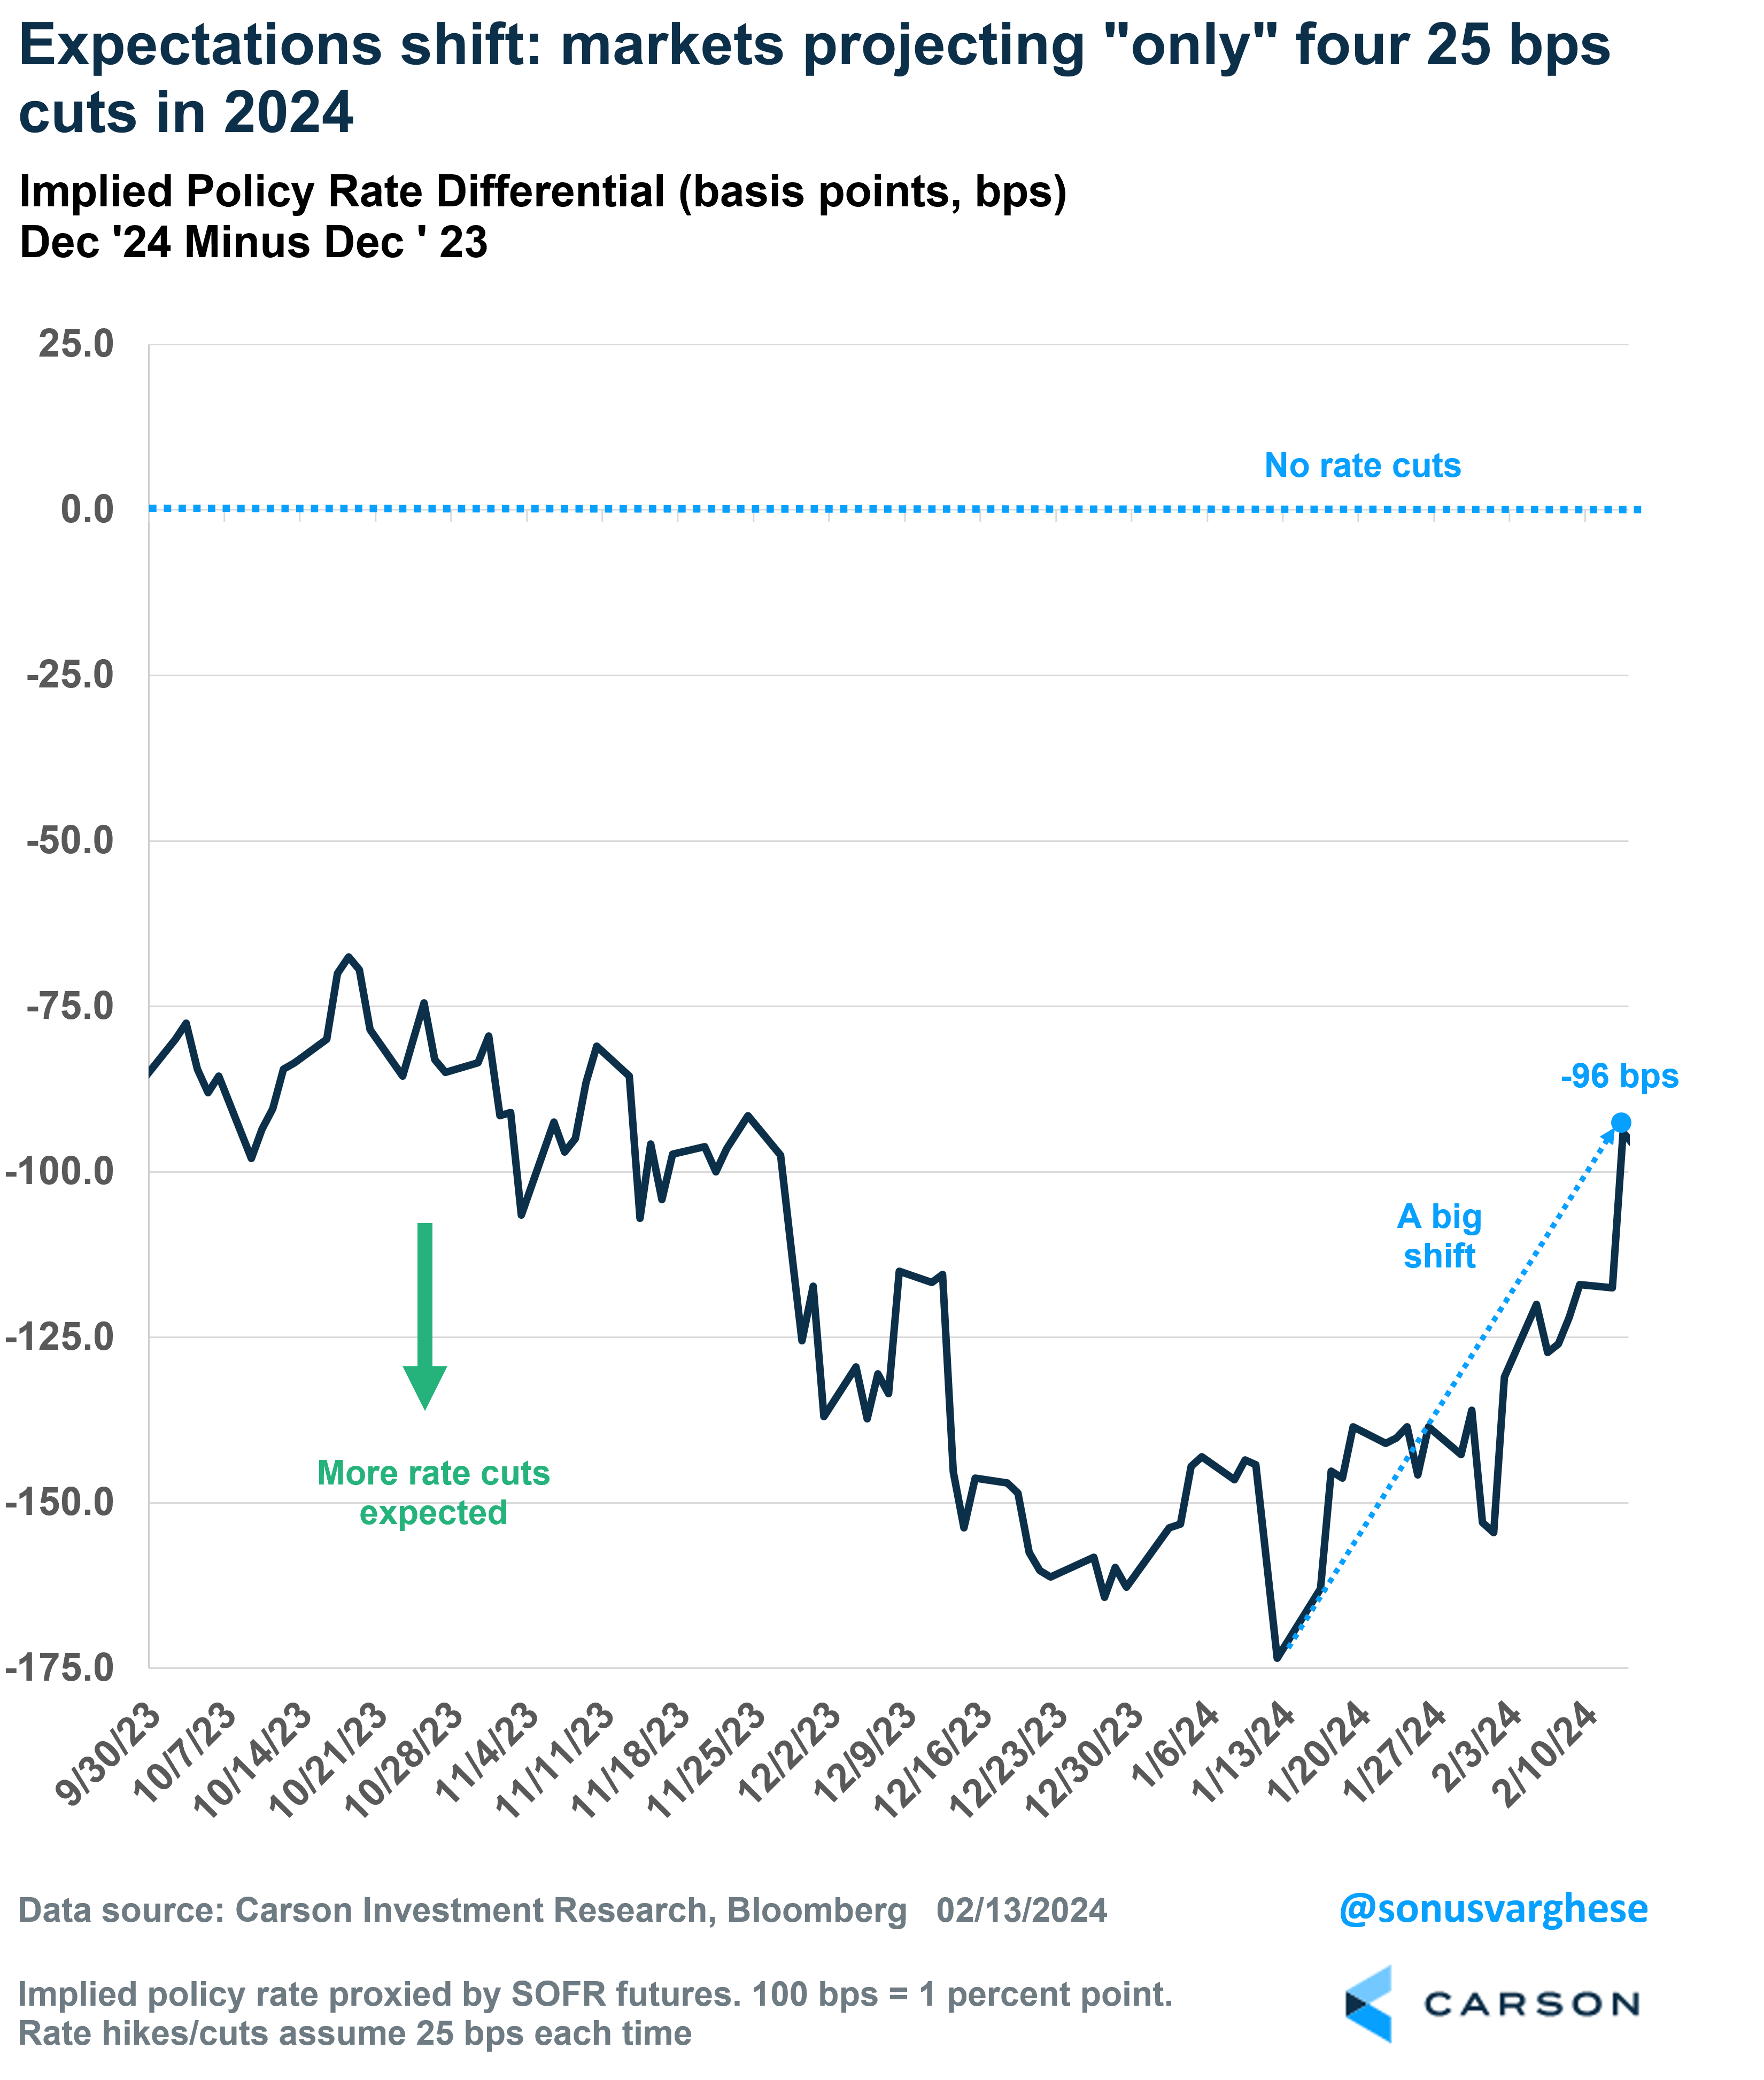
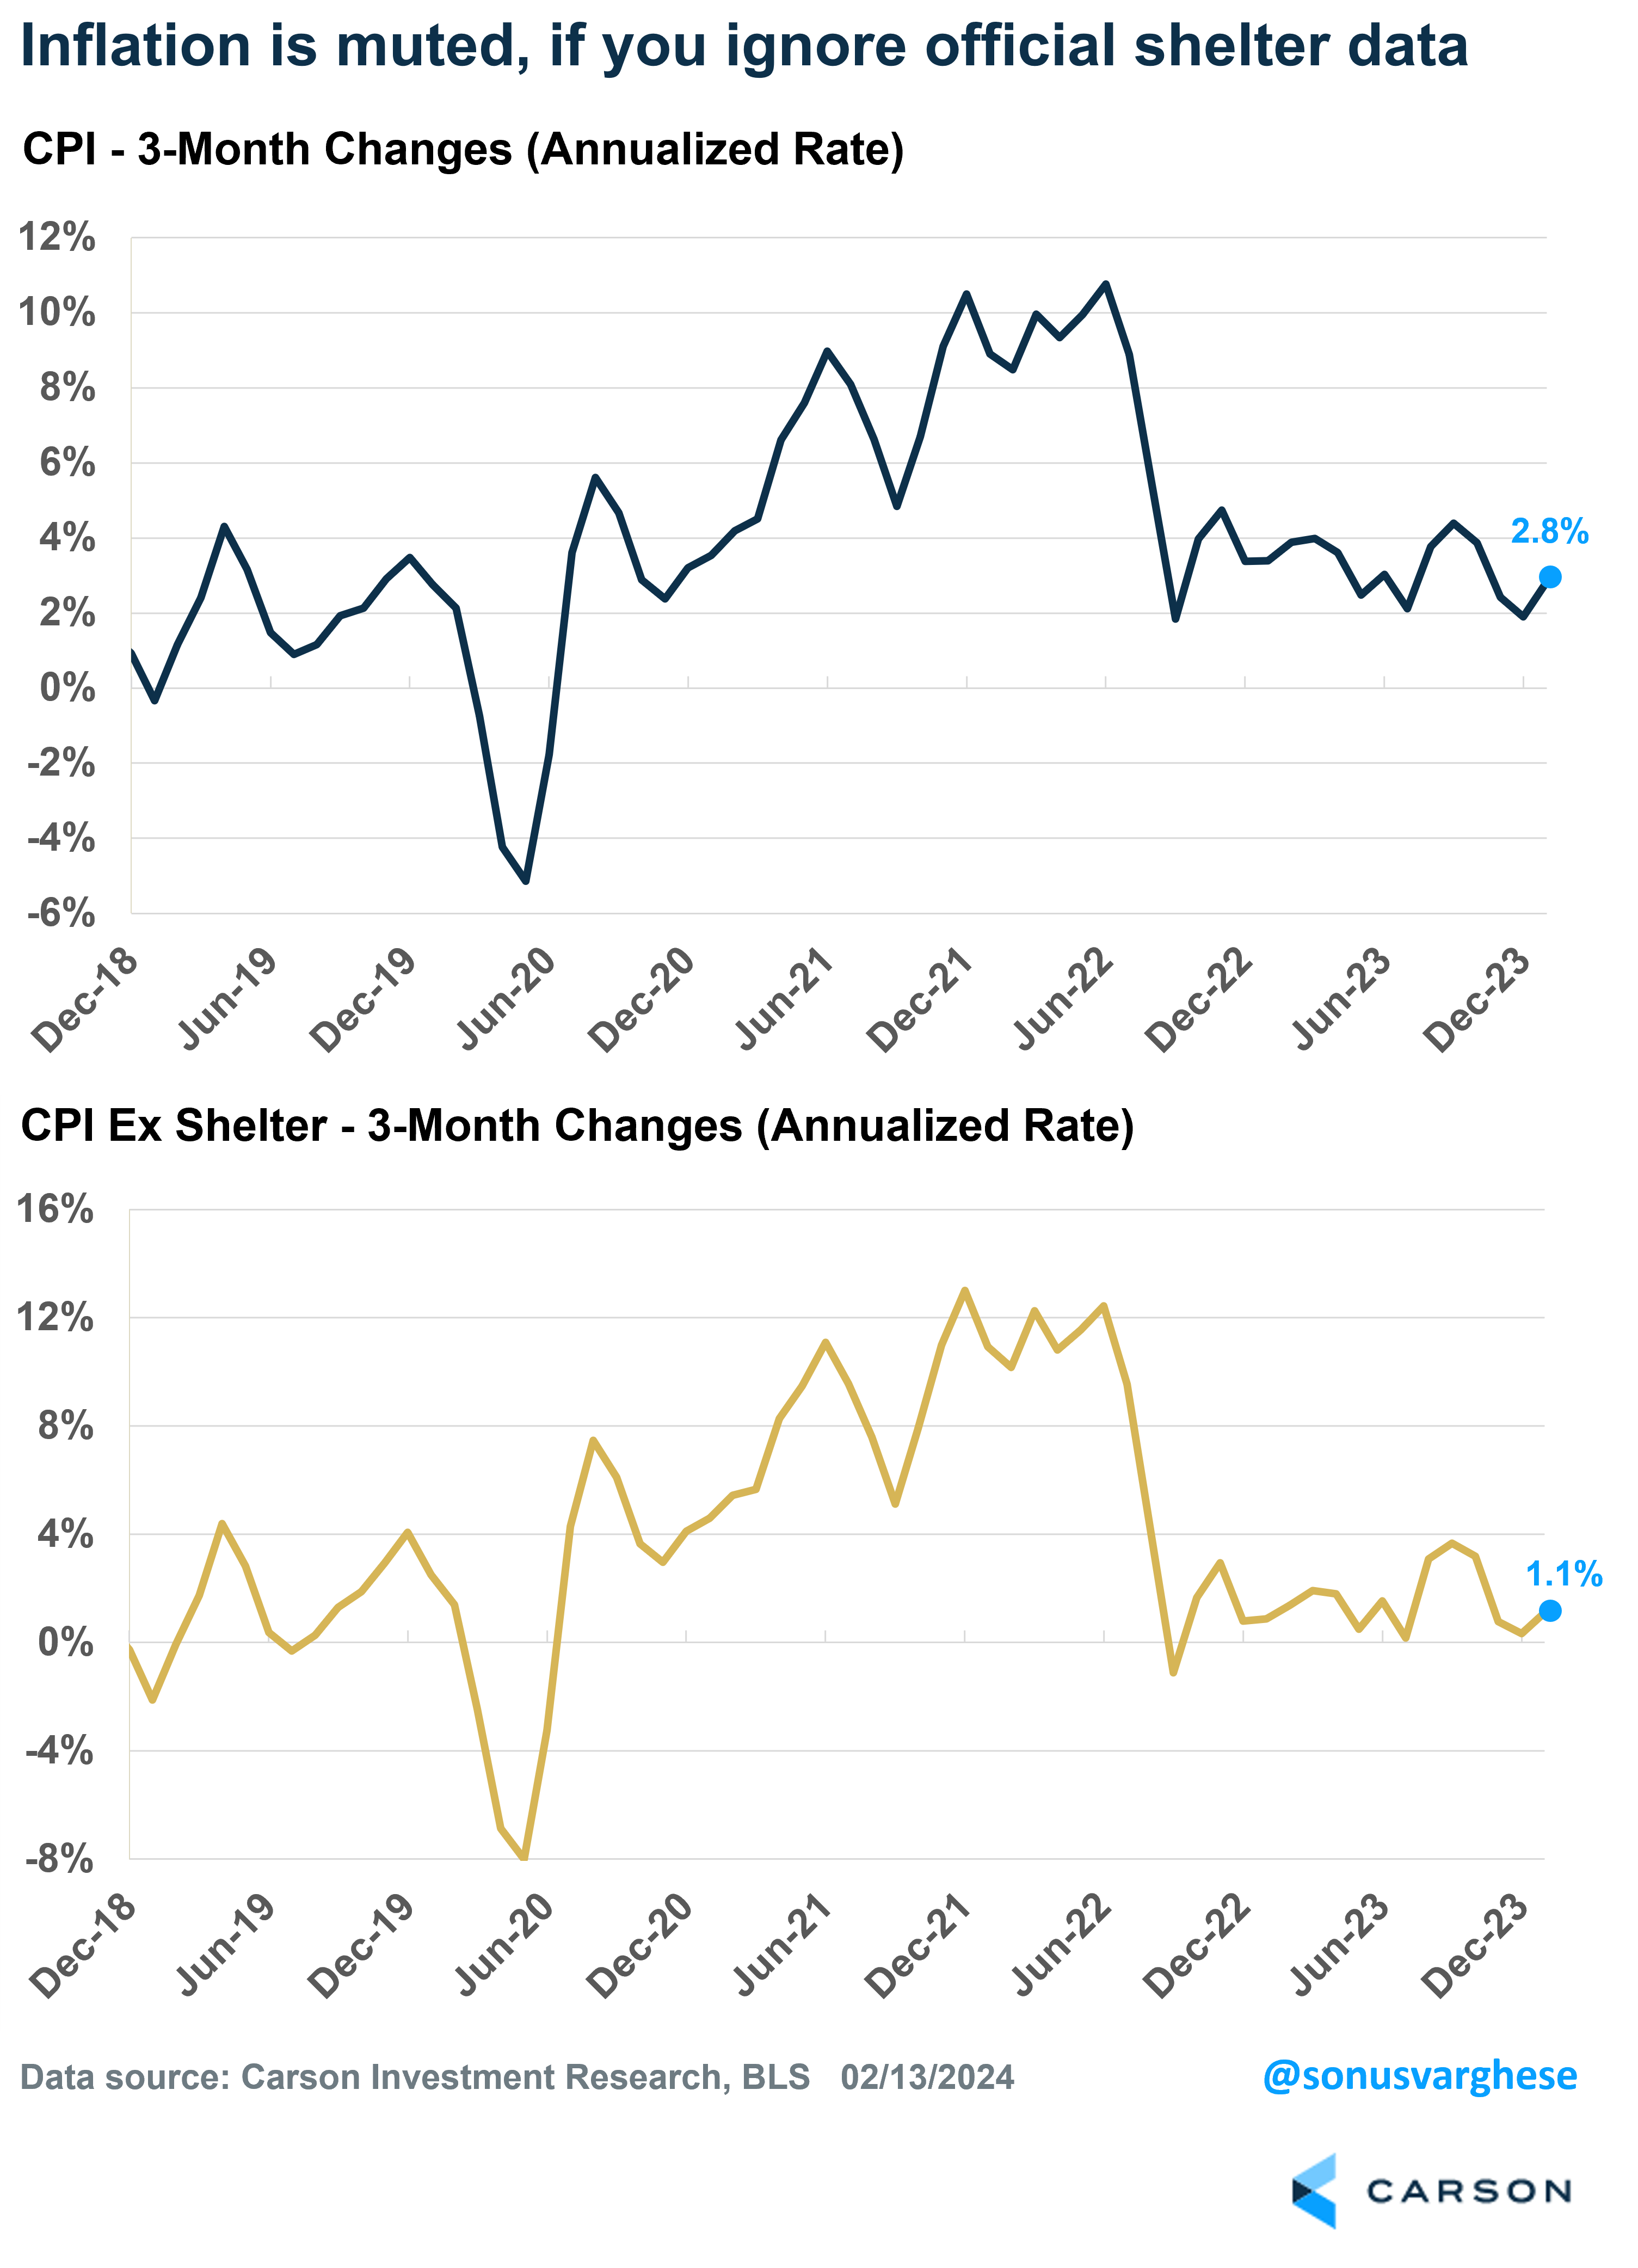
Headline CPI rose 0.3% month over month in January, above expectations for a 0.2% increase. Core CPI, excluding volatile food and energy components, rose 0.4%, above expectations for a 0.3% increase. Over the last three months, headline inflation is running at a 2.8% annualized rate and core inflation is at 4.0%, well above the Fed’s target of 2%.
Now for the qualifier, and I have a few.
Stay on Top of Market Trends
The Carson Investment Research newsletter offers up-to-date market news, analysis and insights. Subscribe today!
"*" indicates required fields
For one thing, January is a very volatile month for inflation data, more so when inflation is relatively high – this was the case in 2022 and 2023, when we saw relatively large spikes. Even this time around, expectations were all over the place, reflecting the uncertainty. Seasonal adjustments help, but even that doesn’t remove the larger-than-normal start-of-the-year price spikes.
Two, CPI inflation is currently elevated mostly because of shelter (housing) inflation. If you exclude shelter, headline inflation rose just 0.1% in January. It’s running at an annualized pace of 1.1% over the last three months and 2.1% over the last six months. Over the past year, CPI excluding shelter is up just 1.6%.
What’s the Deal with Shelter Inflation?
It would be one thing if official shelter inflation data reflects what’s happening in reality. But it’s not. Ryan and I have been writing about this for close to a year and half now, and talked about it on our Facts vs Feelings podcast as well.
Shelter inflation within CPI is made up of two components:
- Rents of primary residences, which makes up 8% of CPI.
- Owners’ equivalent rent of residences (OER) makes up 27% of CPI. It’s the “implied rent” that homeowners would have to pay if they were renting their homes. It’s as if you, as an owner, are renting the home to yourself as a service. The “rents” in OER are determined using equivalent homes, and so they essentially track rents. It has nothing to do with home prices, or mortgage rates.
Immediately, you can see a problem. 66% of American households own their homes, which means the CPI basket (a quarter of which is made up of OER) misrepresents inflation experienced by most households. Keep in mind that the actual “servicing cost” of a home is mostly the mortgage, and the average effective mortgage rate paid by homeowners is about 3.5%.
In short, the large weight of shelter in CPI is a big problem. The Fed actually focuses on another inflation metric, the personal consumption expenditures index (PCE), of which shelter makes up just 15%, so the problem is not as big on that side. PCE is running well below CPI as a result.
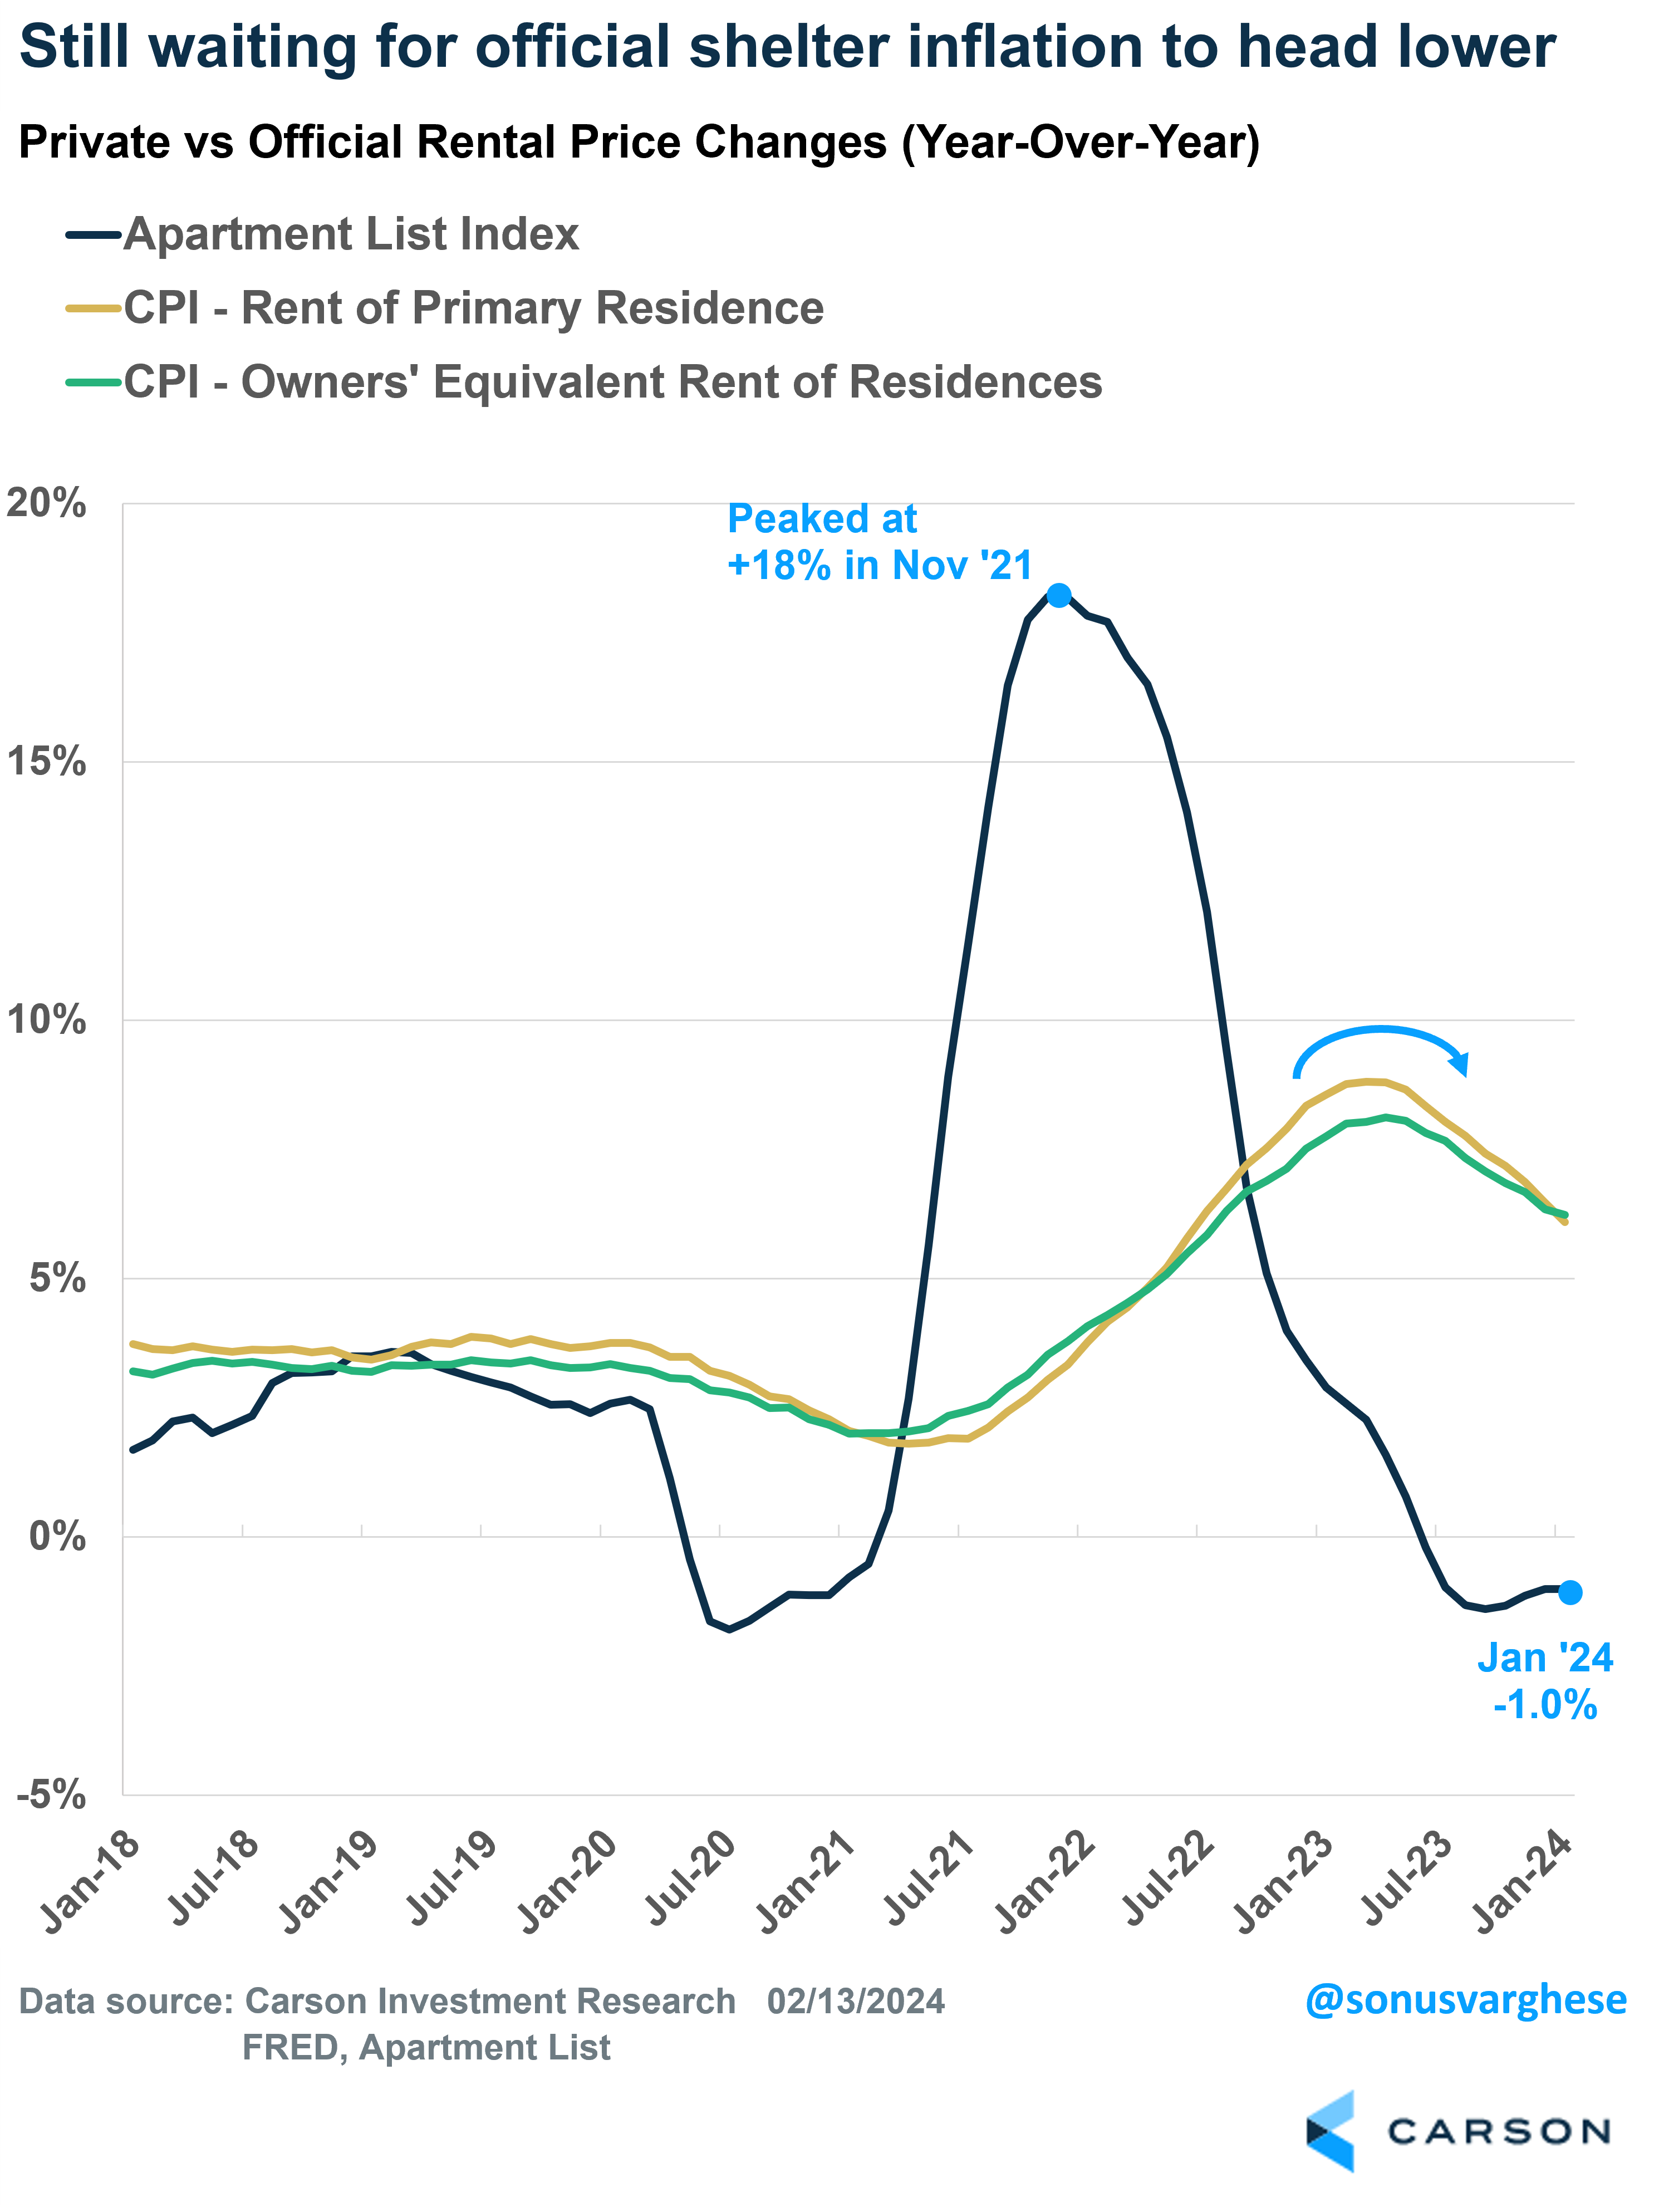
The other issue with official shelter inflation relates to how it’s measured. Private market data usually tracks only new leases, whereas official data considers both new and existing leases. However, most leases are not up every month, and are instead negotiated for longer periods like 1-2 years. This creates a lag between official and actual market data. Another problem is that the Bureau of Labor Statistics (BLS) samples units only once in 6 months, and they smooth price changes over 6 months. So rapid shifts in the rental market can take a long time to show up in official data. The lag can be 12-18 months.
Apartment List’s national rental index has been decelerating since November 2021, and rents have actually been falling on a year-over-year basis for 8 months now. The good news is that official shelter inflation finally started decelerating last summer, but it’s been agonizingly slow.
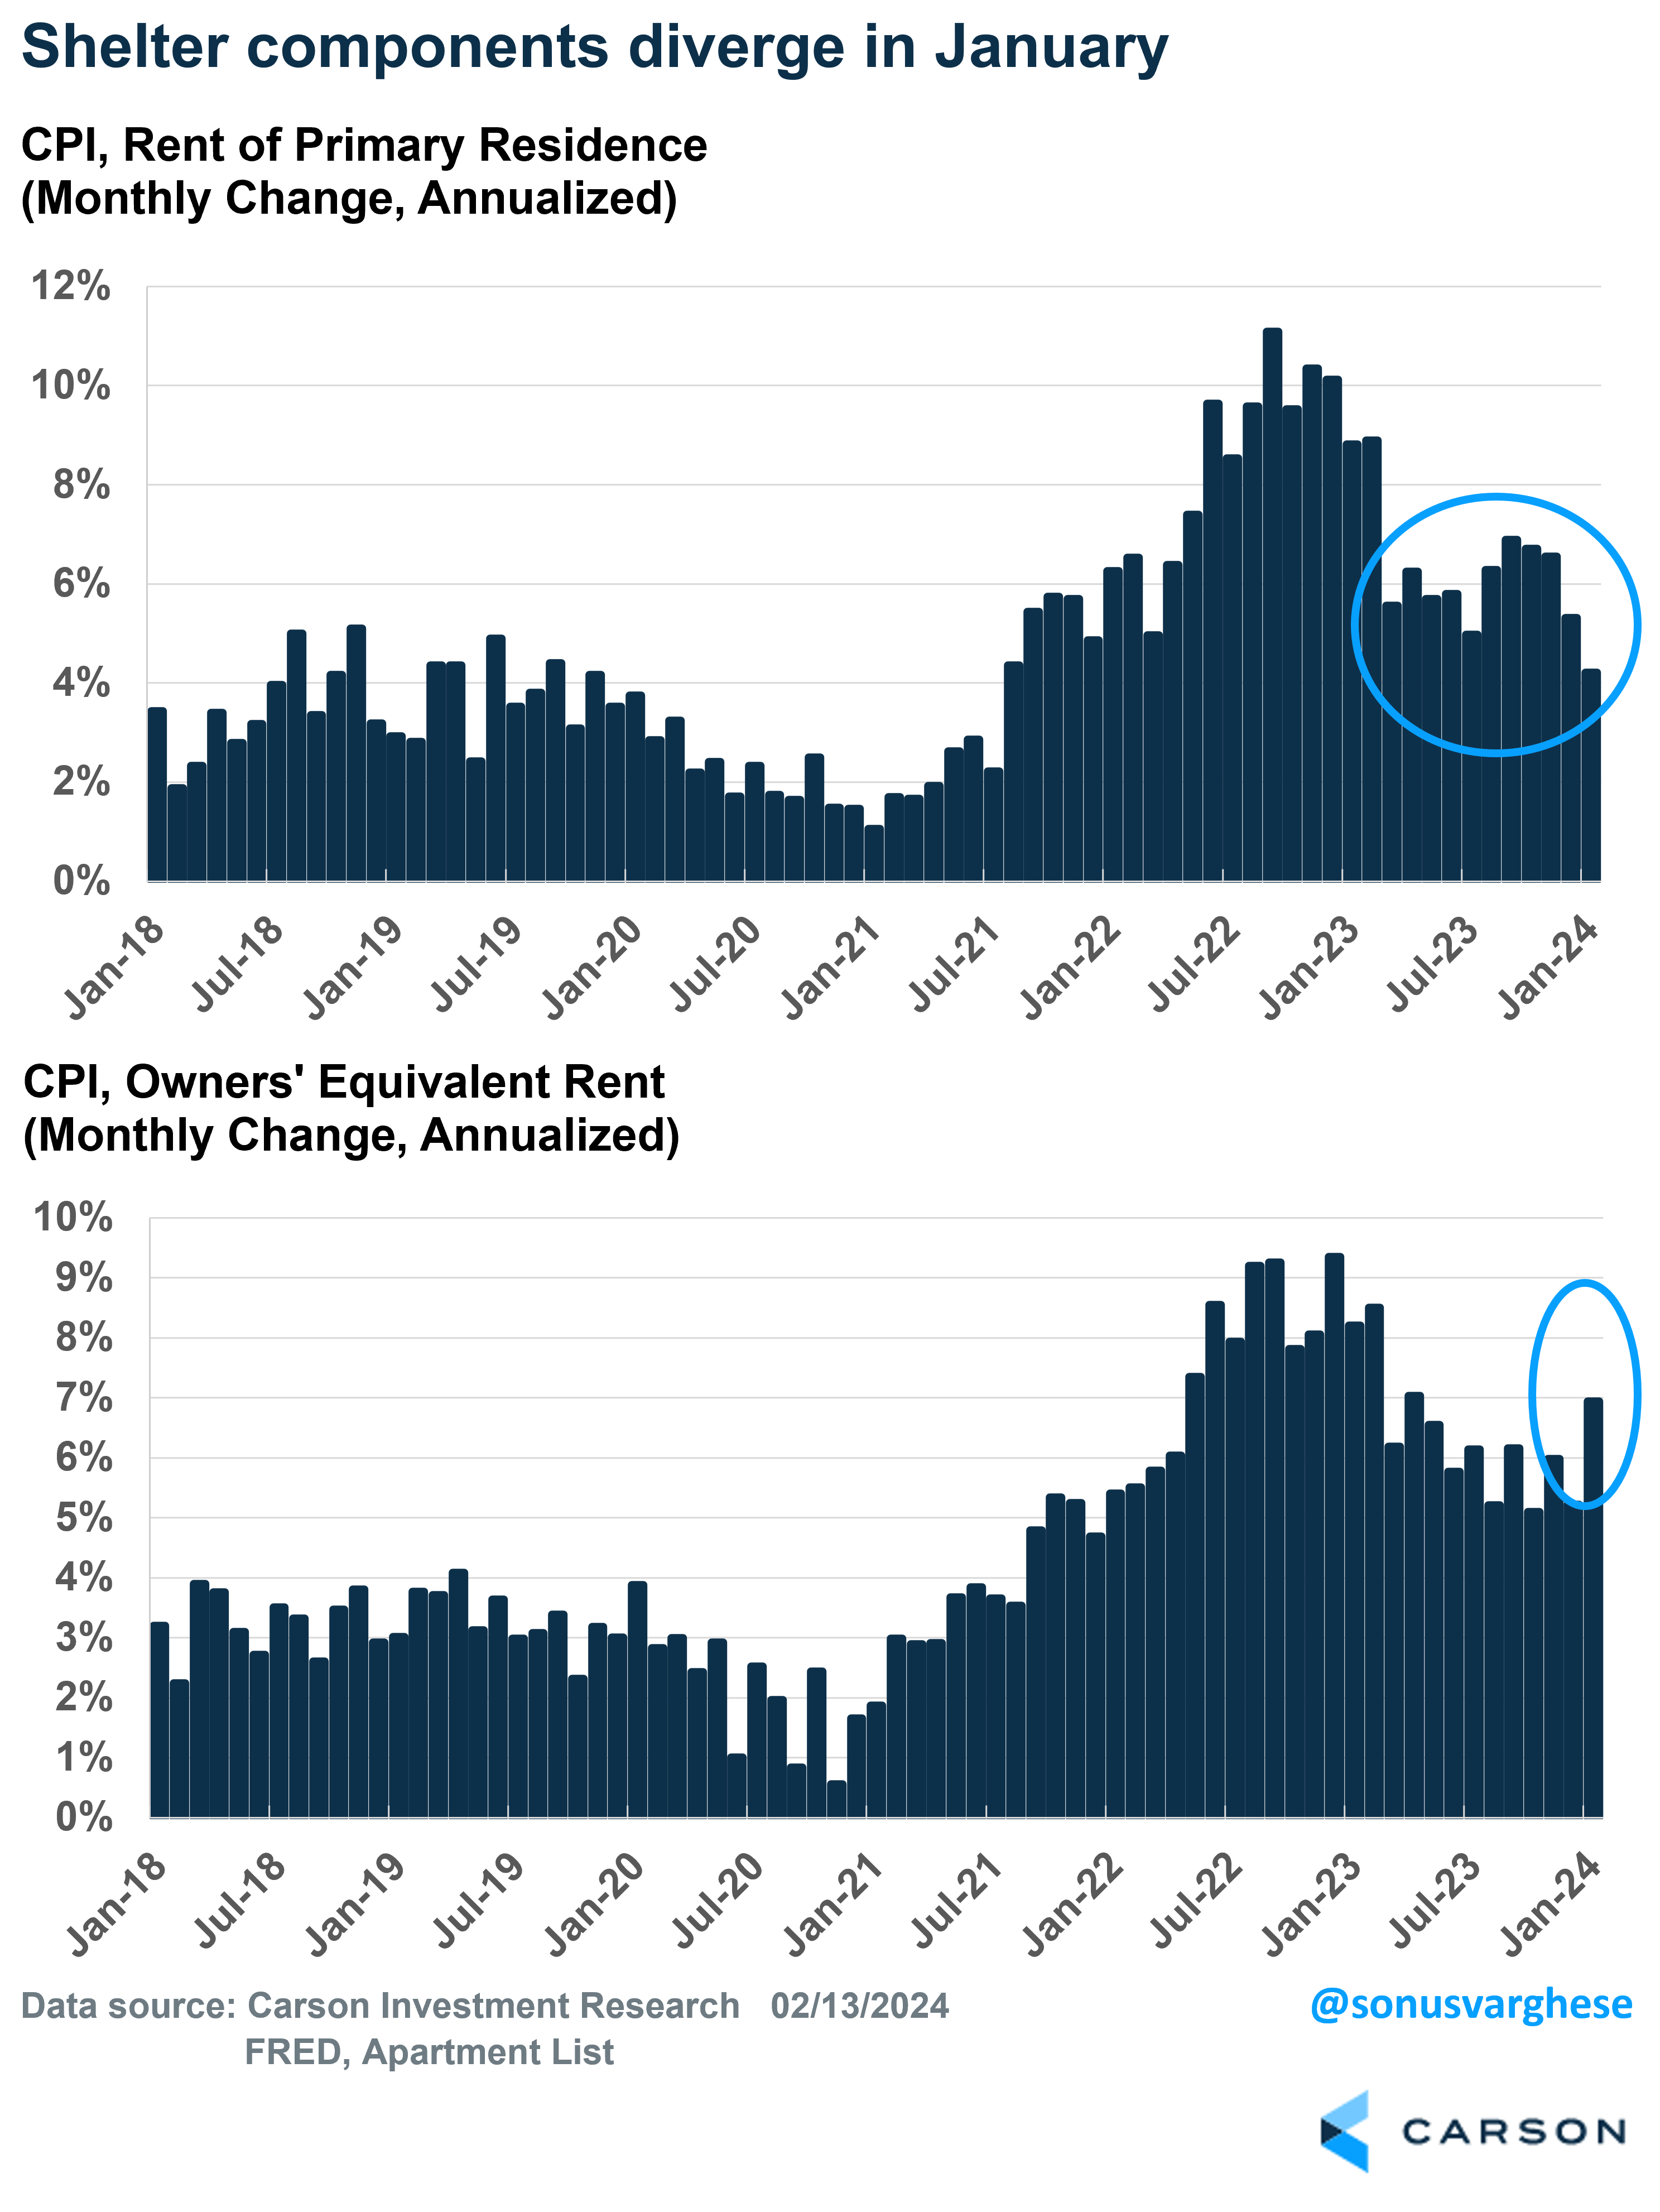
Then January threw a further wrench into the data. Rents rose 0.3% in January, equivalent to an annualized pace of 4.2% — the slowest since September 2021. But OER surged to an annualized pace of 6.9%, the fastest since April 2023. It’s extremely rare for these two to diverge like this, and by itself the rents data is probably more meaningful. In all likelihood, the OER surge is not the start of an upward trend.
How to Make Sense of It All
The big picture is that disinflation is happening, but shelter inflation is keeping CPI elevated. Outside of shelter, services inflation is still relatively high, albeit, skewed by “start-of-the-year” January effects. However, this is being offset by falling commodity prices, even outside energy. Prices for used cars, apparel, household furnishings, and prescription medicines have been falling recently.
A year ago, headline CPI inflation was up 6.4% year over year. That’s now at 3.1%. We’ve made a lot of progress, without a slowdown in economic growth or an increase in unemployment. Nothing we see in other data suggests we’re at the start of another inflation surge. Ultimately, this report is likely to be just a bump in the strong downward inflation trend that began 18 months ago. By mid-2024, barring major surprises, core inflation, especially the Fed’s preferred metric of core PCE, should be very close to the Fed’s target of 2%.
With respect to policy, we still expect rate cuts in 2024. However, absent a recession, we were never in the camp that we’d see much more than four rate cuts in total. That’s where the market is now. Of course, there’s been a big shift, but here’s a big positive: the S&P 500 is up 4% year to date despite markets getting less optimistic about the rate cut path. Now, there may be some volatility over the next month or two. As Ryan wrote in his latest blog, February and March are historically weak periods for stocks. Stocks also just gained for 14 out of the last 15 weeks, and so a break is due. The January inflation report may have served as a catalyst right on cue. But at the end of the day, the economy is strong, and the stock market has momentum, which means the bull market is likely to continue.
Ryan and I talked about the CPI report in our latest blog, as well as the financial status of American households, and whether we’re worried about the amount of debt they’re carrying (short answer: no). Take a listen.
For more of Sonu’s thoughts click here.
02115870-0224-A
