
First off, we hope everyone had a great Memorial Day weekend. We are grateful to all those who have given the ultimate sacrifice so we can remain free and the families that hold them dear.
The incredible disconnect between how people feel and what they do continues. In today’s blog I’ll explain why the stock market isn’t rigged and show why in many cases the consumer is as strong as they’ve been in decades, yet it seems like no one wants to admit it.
For starters, a recent Harris Poll showed that more than half of those polled thought the economy was shrinking and nearly half thought the S&P 500 was down on the year along with unemployment at 50-year highs. Thanks to Carl Quintanilla from CNBC for sharing this.
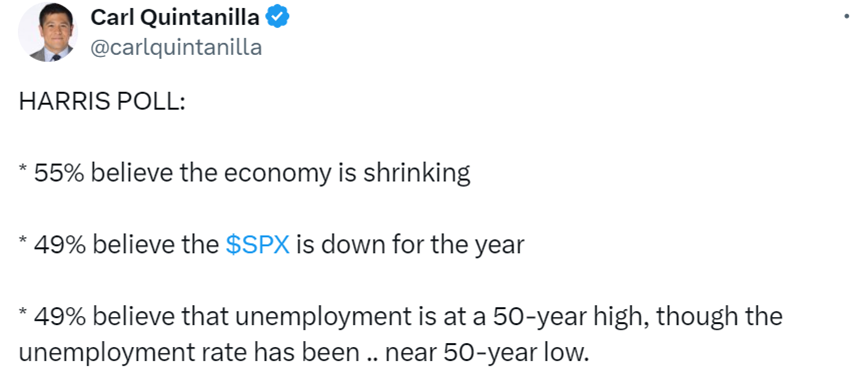
None of this is remotely true. This is the best start ever to an election year ever for the S&P 500 (up about 11% YTD), the economy is on pace to gain more than 3% in the second quarter (Atlanta Fed GDPNow Cast), and the unemployment rate has been beneath 4% for more than two years.
How in the world is this even possible? Sure, not everyone feels good, but they have to at least be aware stocks are at all-time highs. Occam’s Razor tells us that the most likely explanation is usually the simplist, and in this case it is probably due to political beliefs and social media. Many Republicans don’t like President Biden and feel things are worst than they really are. We saw the exact same thing with Democrats and President Trump by the way. Then we sprinkle in social media and you likely have what we have.
Stay on Top of Market Trends
The Carson Investment Research newsletter offers up-to-date market news, analysis and insights. Subscribe today!
"*" indicates required fields
If you asked people how they were doing, most would say fine. Satisfaction with one’s job is at generational highs and consumer spending is very robust (just try to get your kitchen redone, get a reservation at a nice restaurant on a Saturday night, or buy a boat or RV), yet Michigan Consumer confidence just saw a huge drop last month and came in at the lowest level this year.
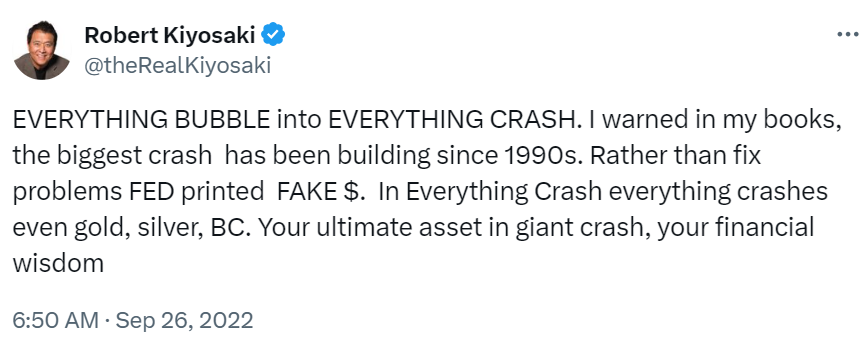
Then of course we have people with huge followings on social media telling us a crash is right around the corner. The problem is they’ve been doing this for years now, in many cases scaring many investors out of a huge bull market. The Rich Dad, Poor Dad guy has been screaming about a crash incessantly for years now and the media continue to give him a microphone. Here’s a tweet he sent that was just a few weeks ahead of this new bull market. Trust me, he’s been saying the same thing all the way up.
Then pizza reviewer and High Noon drinker Dave Portnoy came out claiming the stock market was rigged. This is the same person who crashed and burned during the meme stock craze a few years ago. He even picked the Cincinnati Bengals to win the Super Bowl, only to see Joe Burrow out for the year a few hours later. As a Bengals fan, I don’t want this walking contrarian indicator anywhere near my team! Anyways, here’s what ol’ Dave had to say to his millions of followers.

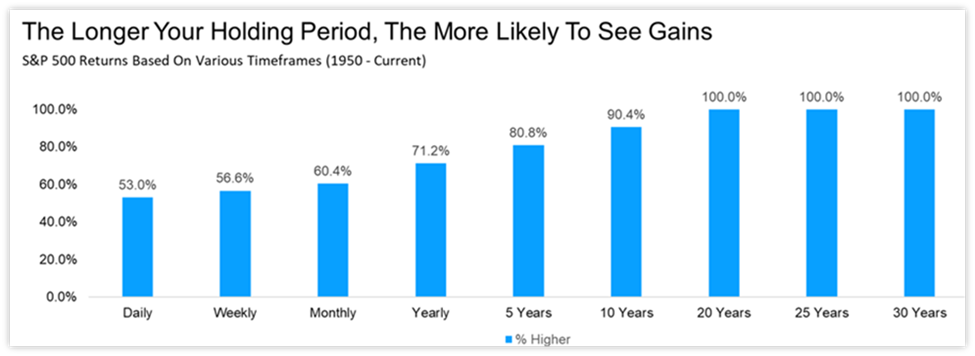
This couldn’t be further from the truth. As we’ve shared time and time again, one of the best ways to create wealth and beat inflation is investing in the stock market. The little guy actually has an incredible advantage over everyone else, as they don’t have to worry about a bad quarter or two. If you manage money and have a few bad quarters it could be the end of your career, but investors have the benefit of knowing that over time stocks go higher and this is a huge advantage.
Let’s now turn to the consumer. We keep hearing the consumer is tapped out, in over their eyeballs in debt, etc. Similar to being told the stock market was rigged, this is simply not true if you look at the data.
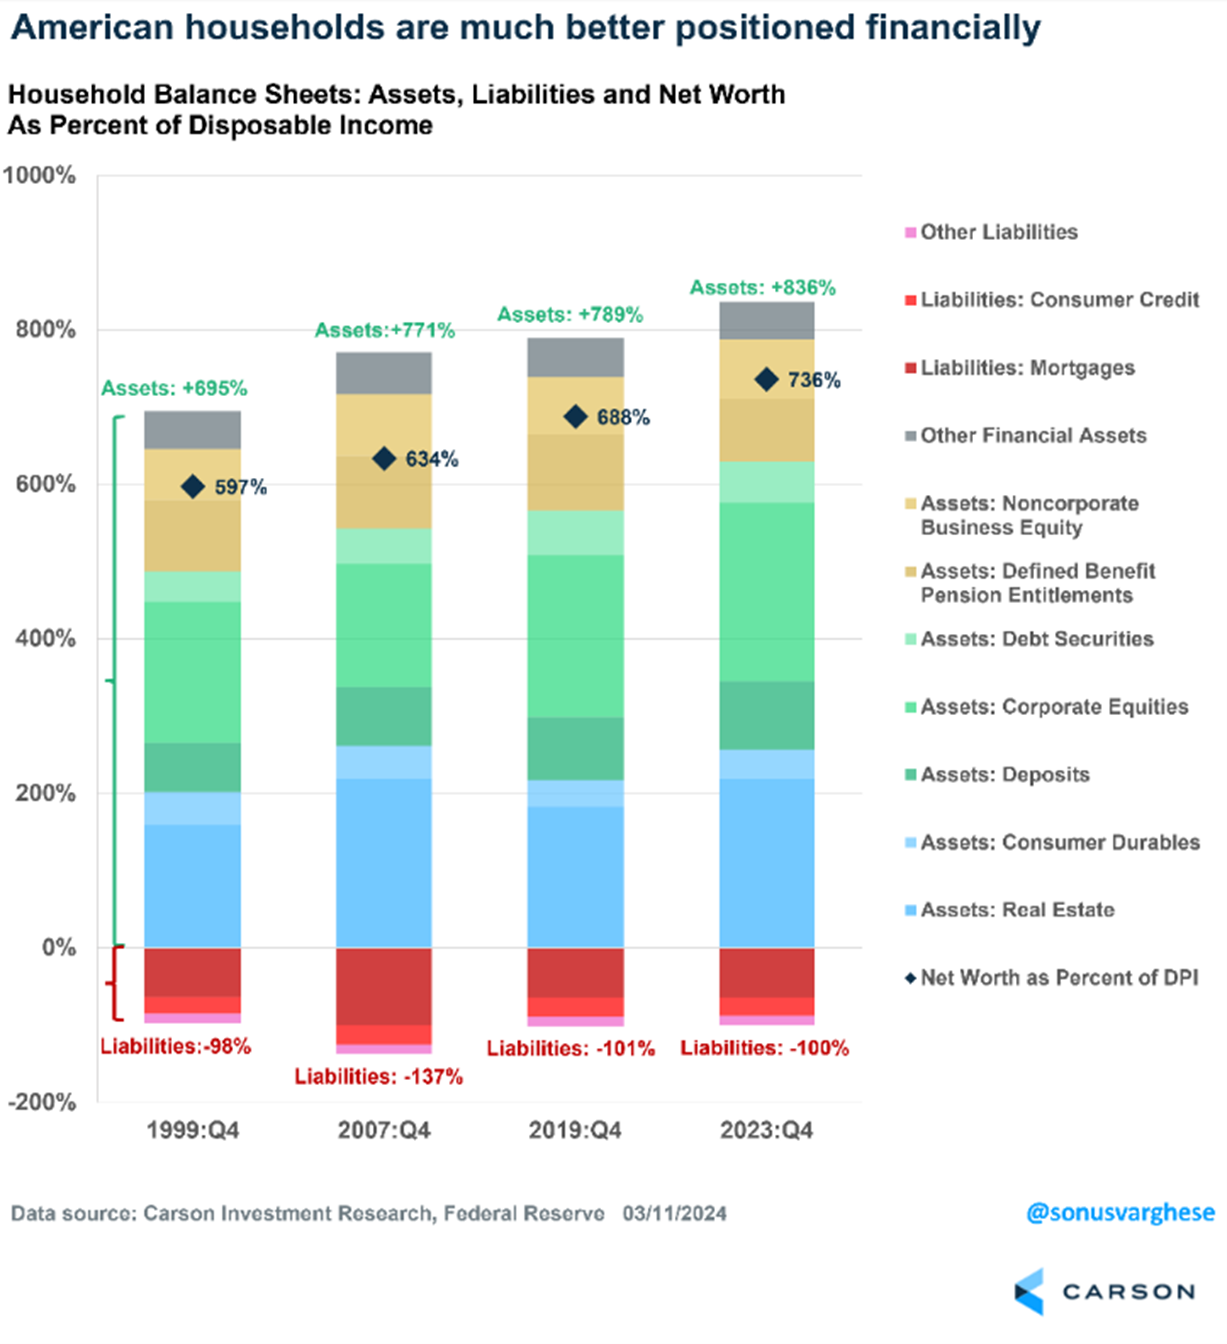
One of my favorite charts that Sonu produces is this one, which looks at household liabilities and assets, but normalizes things by disposable income. Yes, debt overall is much higher than 50 years ago, but so is net wealth and incomes, so we need to do something to get more of an apples to apples comparison. Doing this Sonu found assets to disposable income was more than 800%, the highest level since the late 1990s. Adding to the myth busting, liabilities relative to disposable income was right around 100%, the same level as 25 years ago! So debt hasn’t moved relative to income, yet assets have soared. That right there tells us household balance sheets are in very good shape.
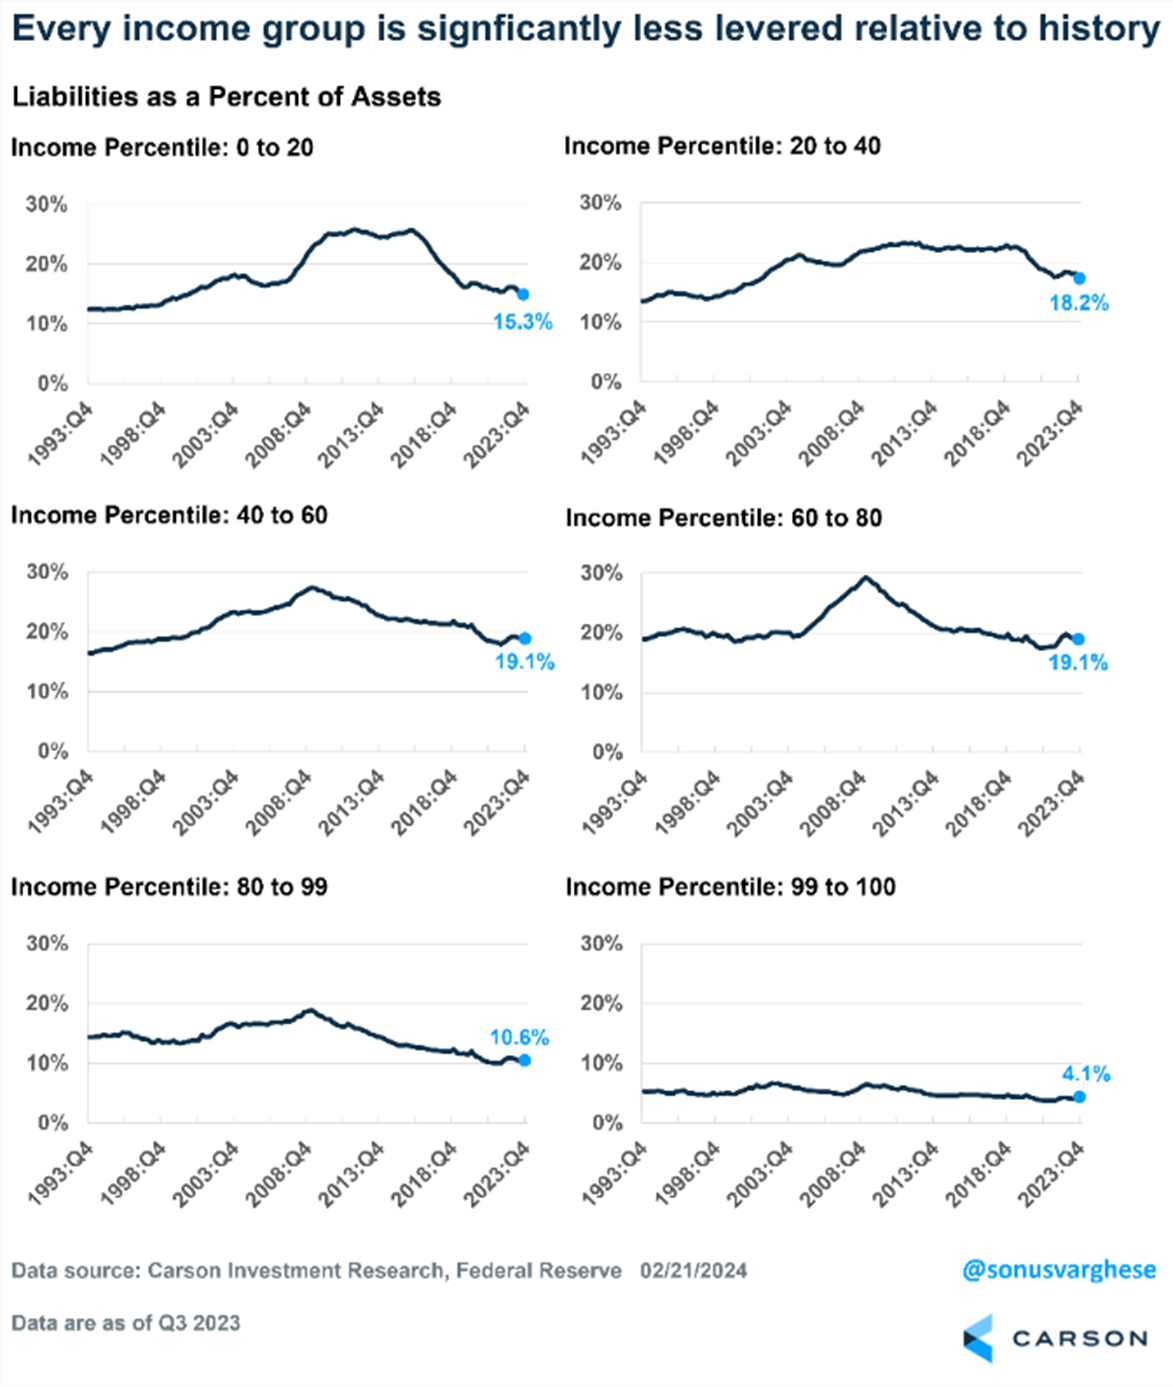
Lower income groups are struggling amid higher interest rates is another thing we hear quite often. We aren’t going to say that a lot of people aren’t struggling, because they are, but overall this appears to be another myth. Using Fed data, breaking things down by income percentiles showed that across all income levels liabilities as a percent of assets have improved the last several years, with lower incomes actually improving the most, something you don’t always hear on TV during the evening news, huh?
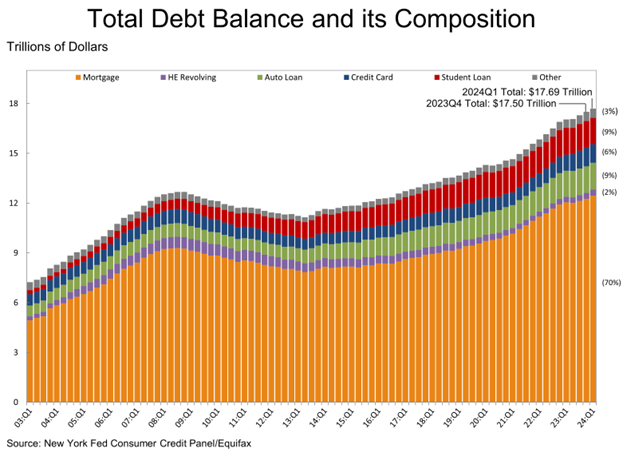
What about overall debt? Yes, it is at an all-time high, up 1.1% last quarter and up to $17.7 trillion overall. But take note, about $12.5 trillion of this is mortgage debt, with much of that set at historically low interest rates. Another potential positive is credit card debt was down last quarter!
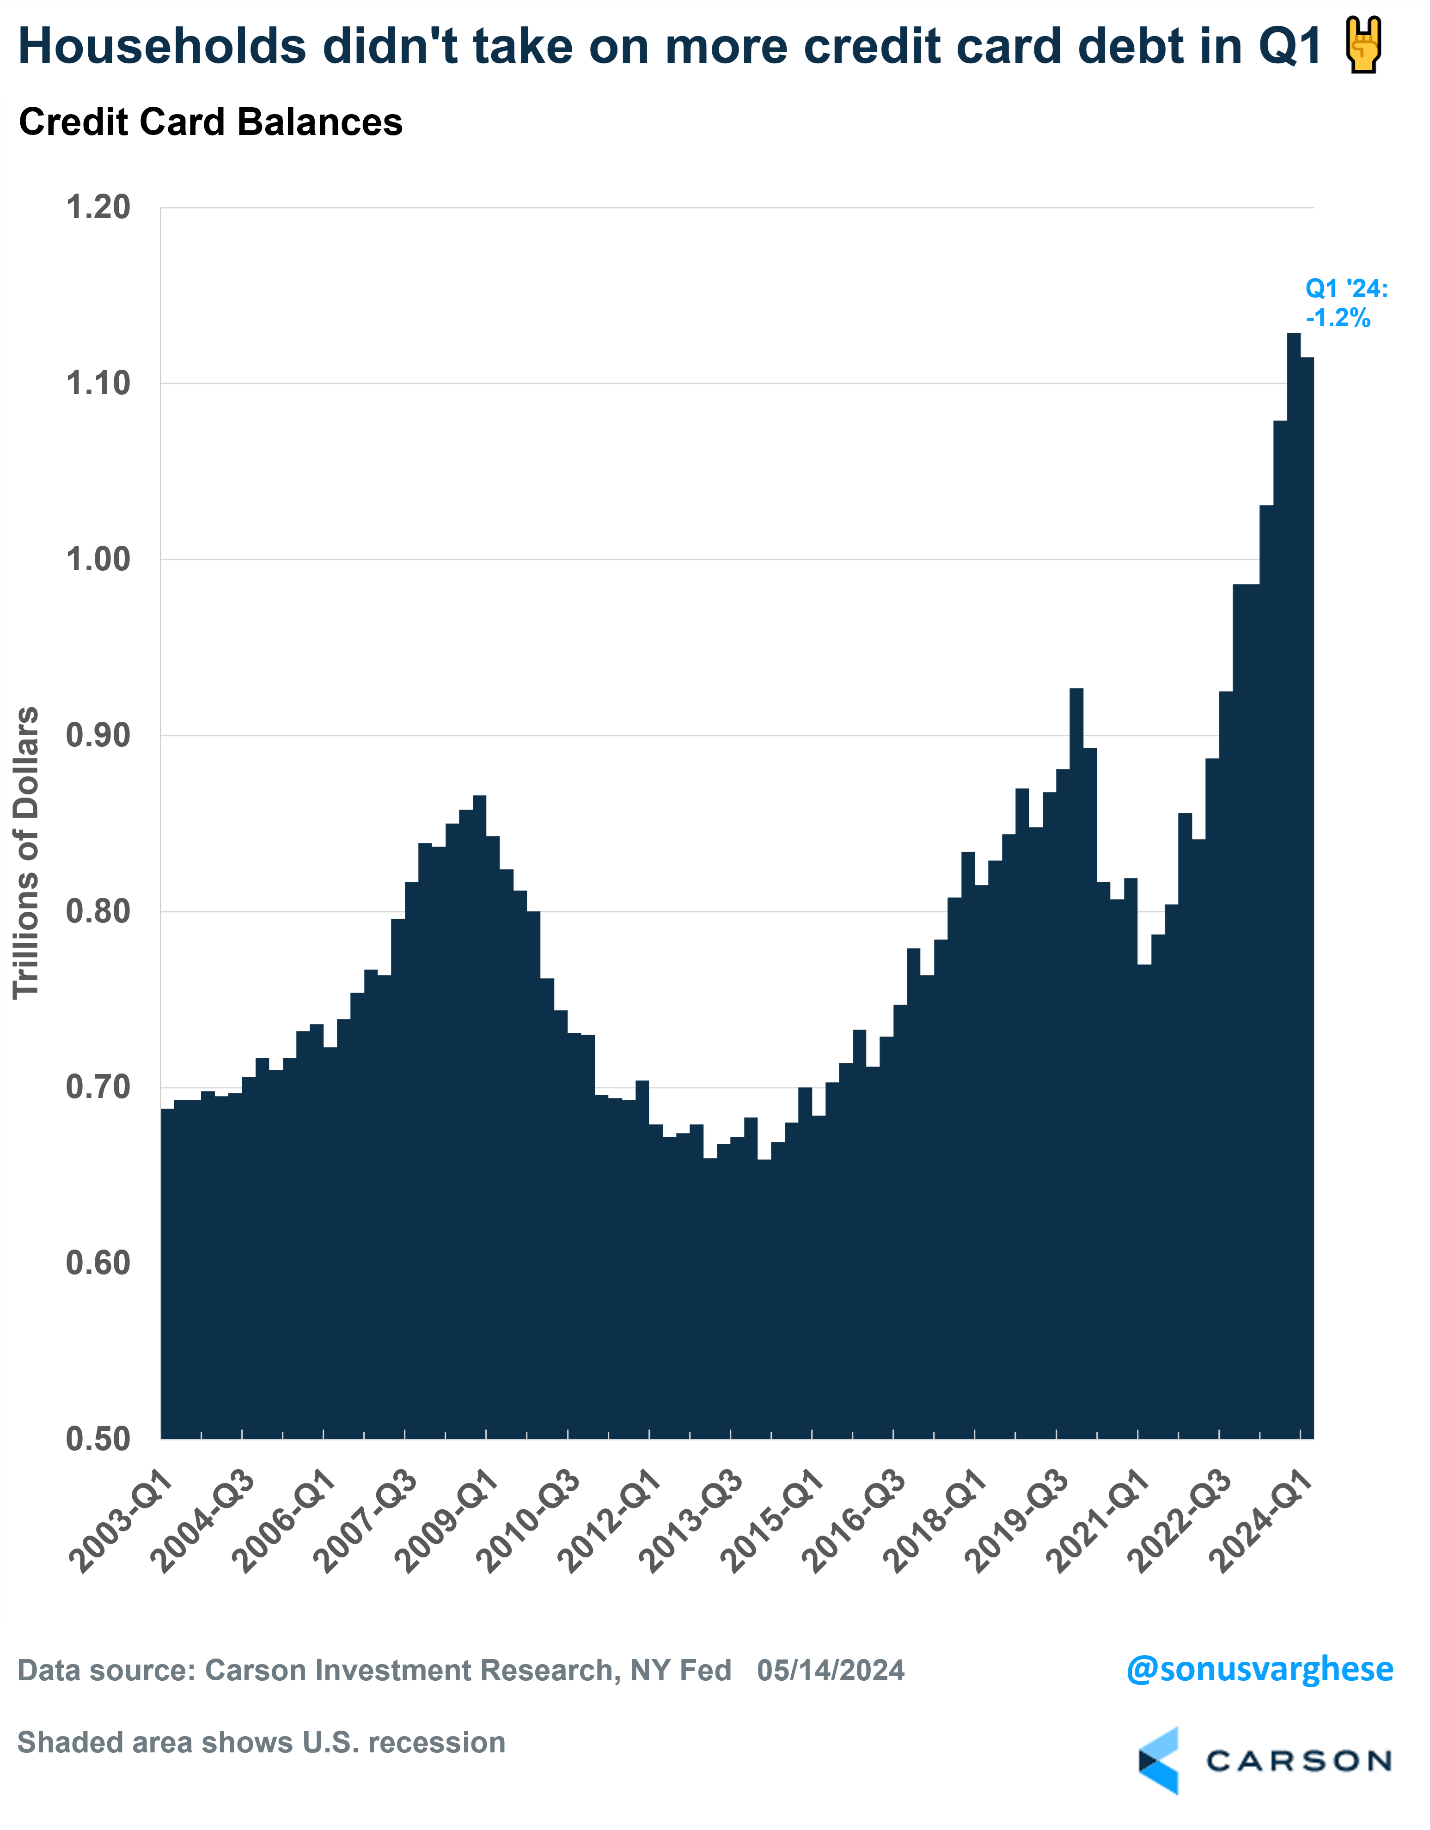
Yes, there’s a lot of credit card debt out there, more than $1 trillion, which no one is crazy about. But take note that credit card debt actually fell 1.2% last quarter to $1.1 trillion. All we hear day after day is how credit card debt is soaring, yet apparently it is slowing, something that has to be a positive.
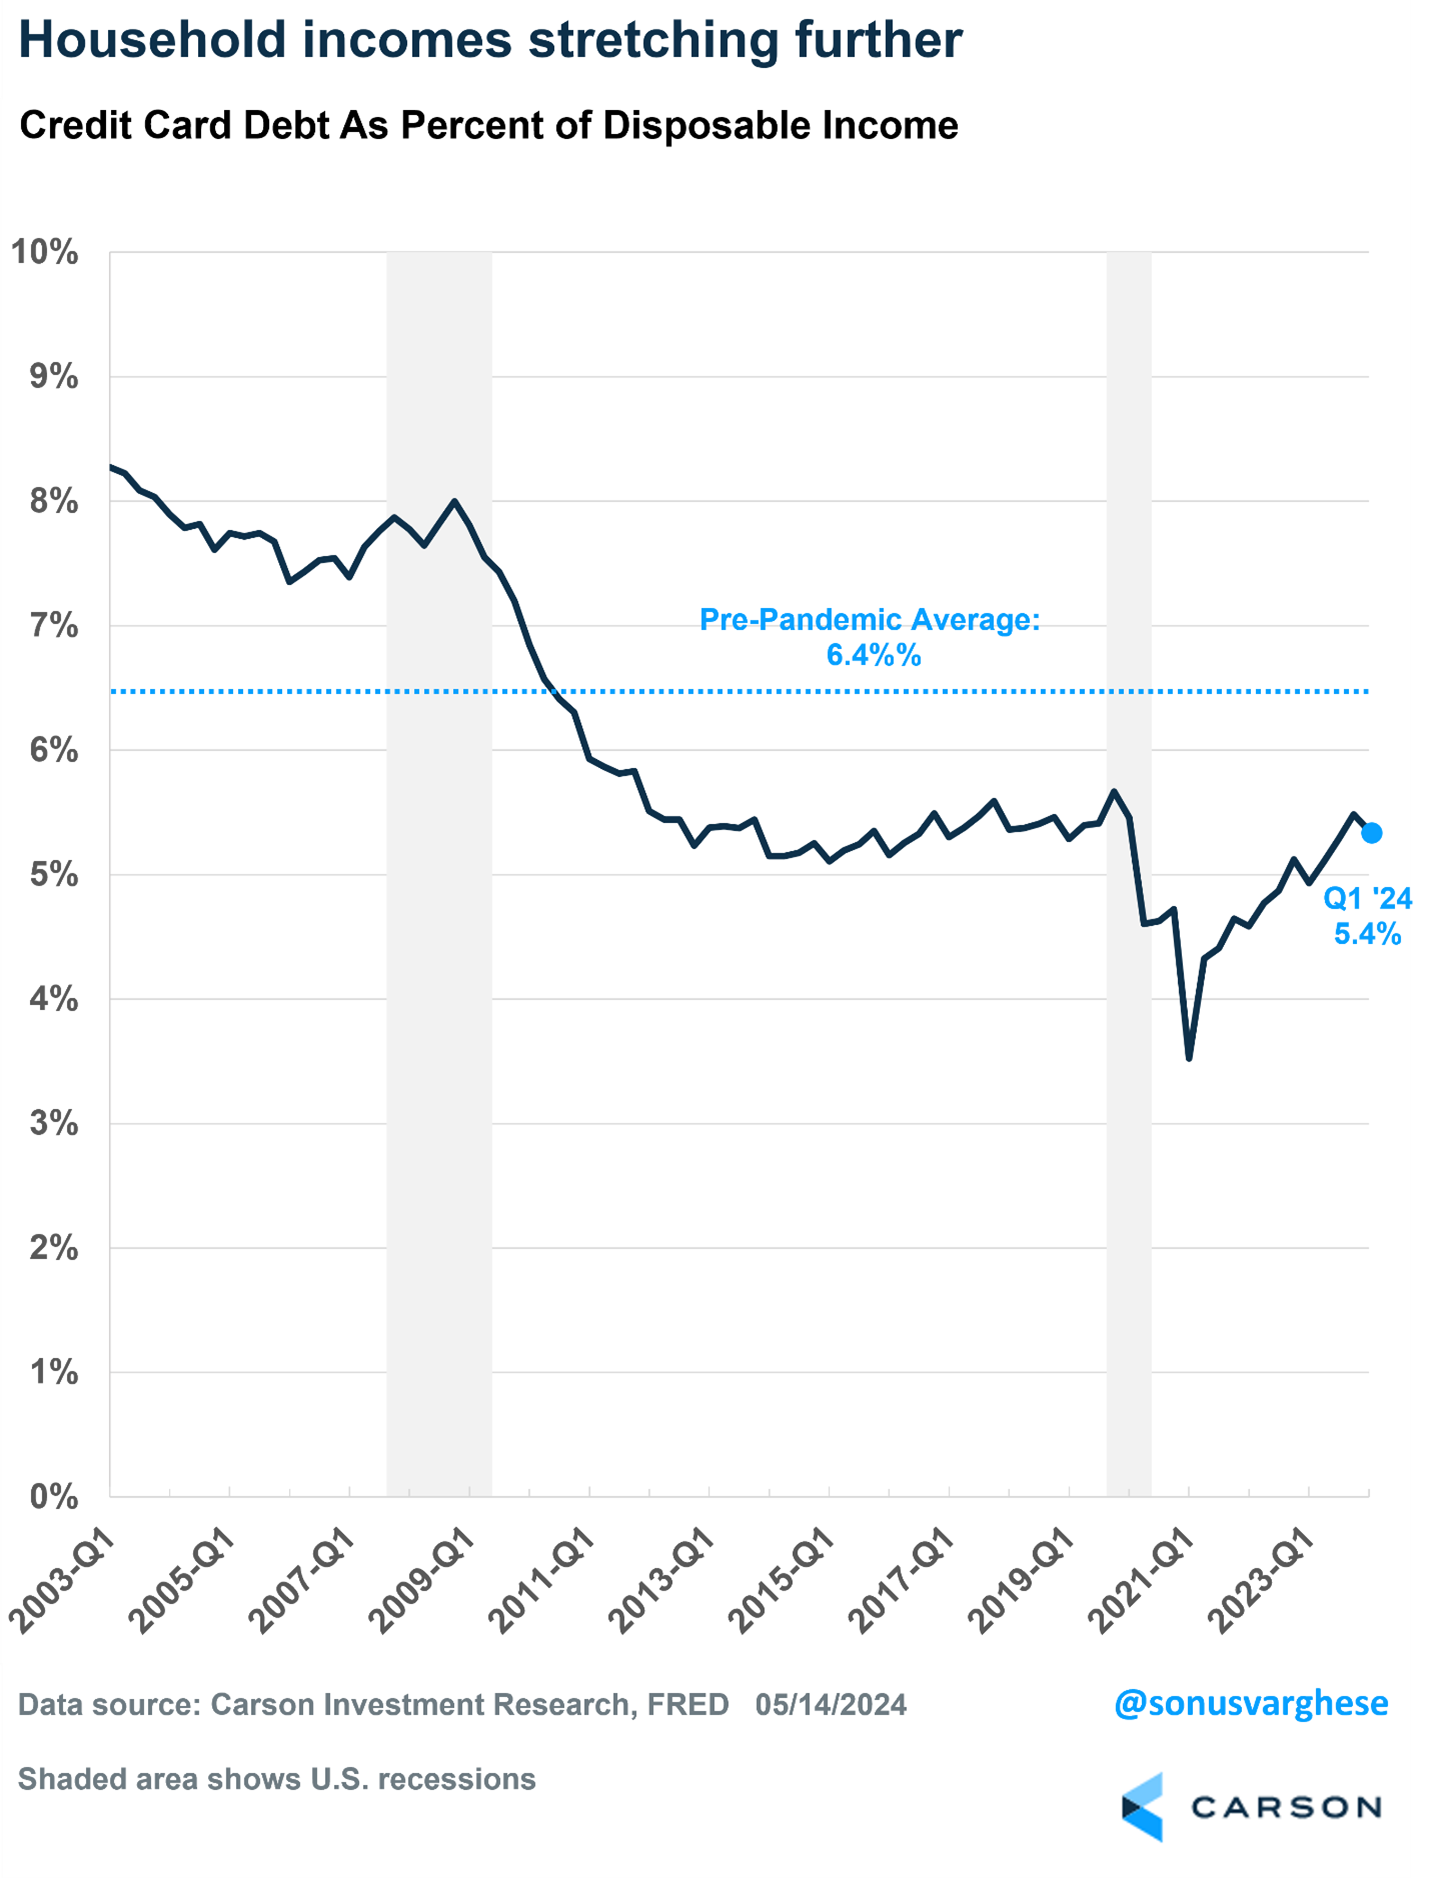
Disposable incomes jumped a solid 1.2% last quarter, which meant household incomes stretched even further. Credit card debt as a percentage of disposable income fell to 5.4% from 5.5%, matching the 2019 levels! Again, if all you heard was credit card debt was ‘up a lot’ you’d probably worry, but when you factor in people are worth a lot more and their income is likely much higher, it puts things in perspective.
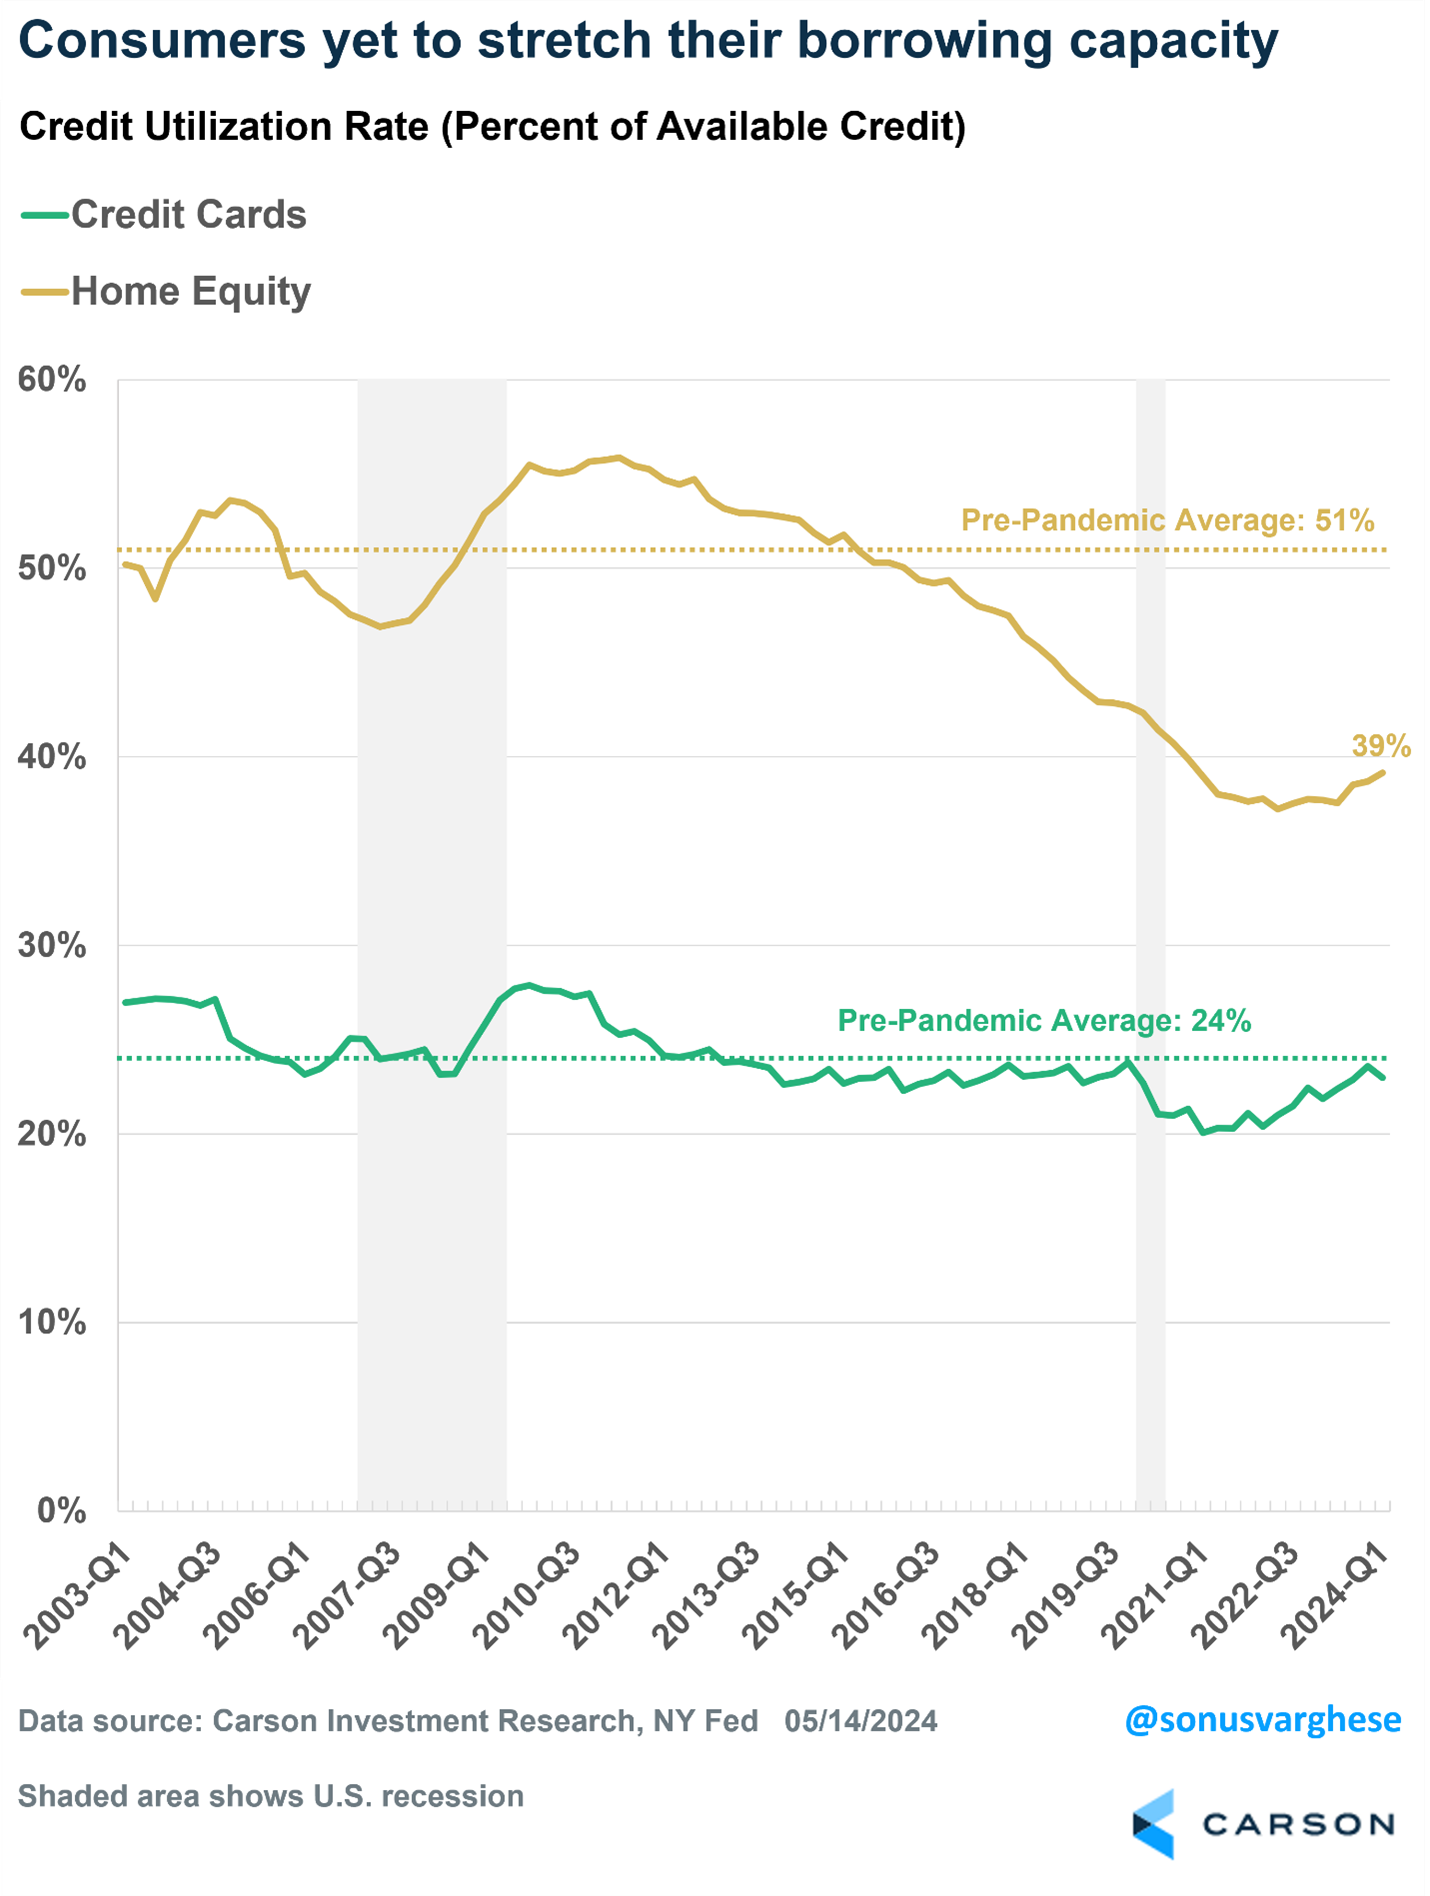
Credit cards maxing out is another common myth we hear. Again, just looking at the data shows this isn’t true. Credit utilization is how much of your credit you are using. If you have a $10,000 credit card limit and you have a balance of $2,000 that is a credit utilization of 20%. Would you believe credit utilization actually fell from 24% to 23% last quarter? Yep, it sure did, once again showing consumers aren’t tapped out or maxing out their credit cards. Oh, and this is still beneath pre-pandemic levels. Additionally, home equity credit utilization was steady near 39%, still well below the historical average of 51%, more dry powder for consumers.
Delinquencies grew last quarter and this could be showing some cracks, but it isn’t all bad. 96.8% of all balances are still on time, which is better than late 2019. The most derogatory balances are moving higher, but they are still only 1.7% of total balances, which is lower than 2.8% levels pre-pandemic and 3.0% in 2007.
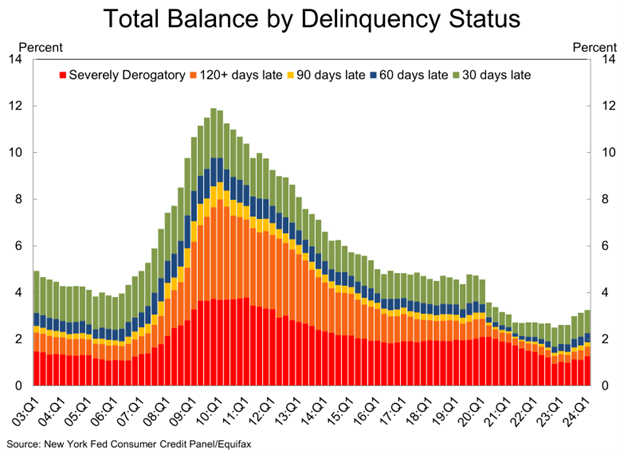
The question is are these increasing due to a weakening consumer, or could it simply be normalizing after historically low levels after the pandemic? For now, we side with things are normalizing.
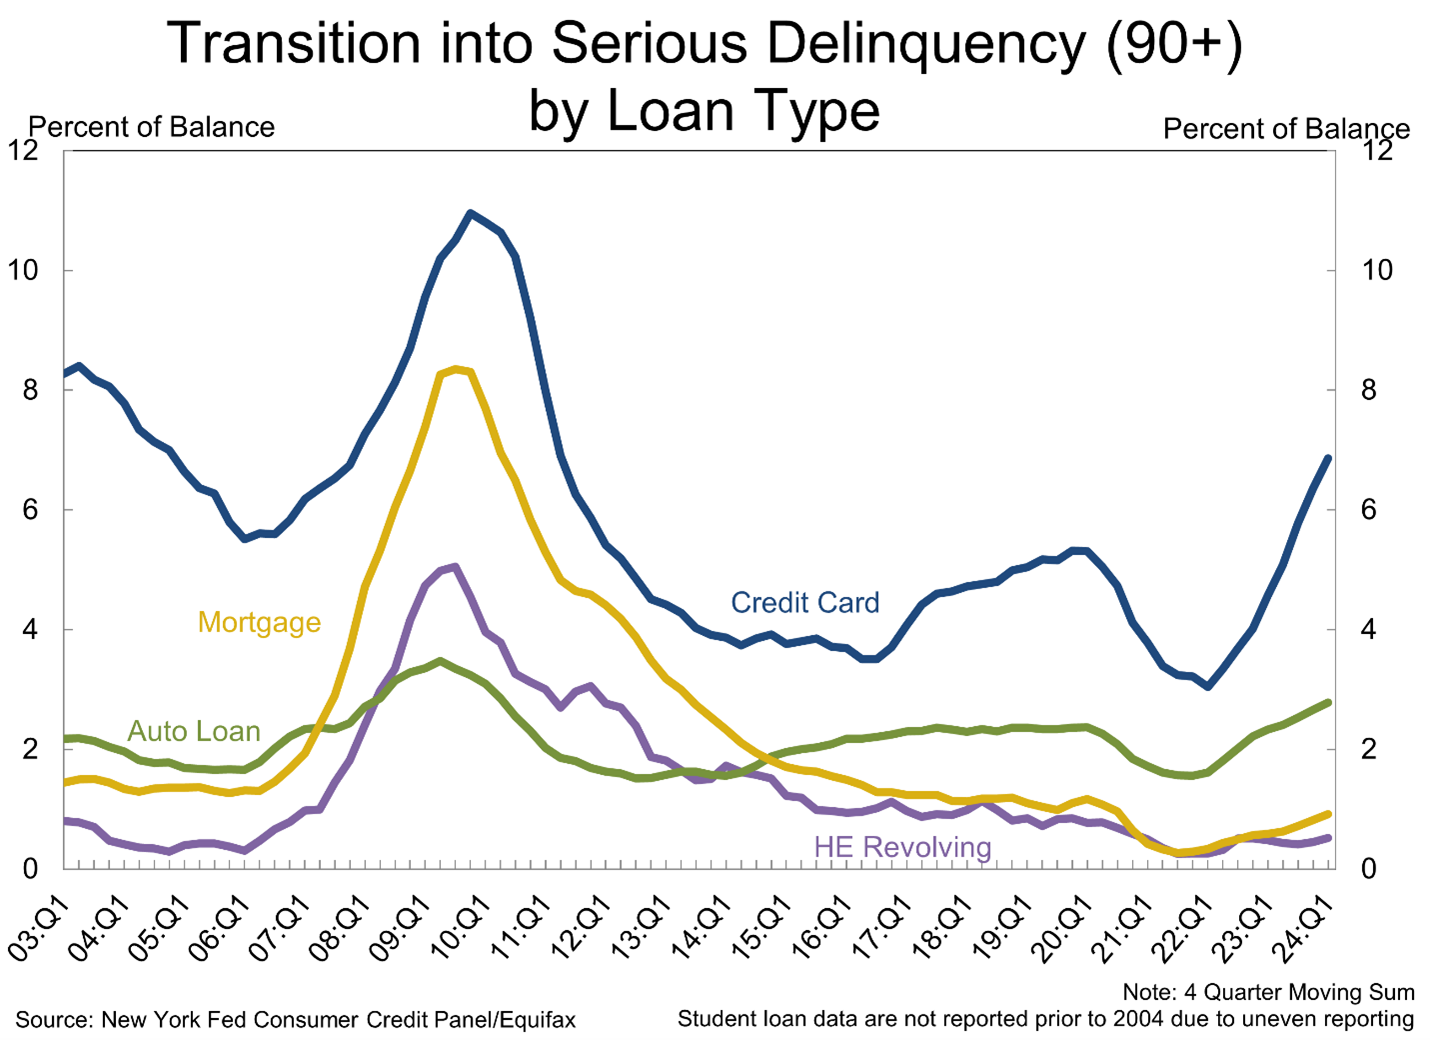
Breaking things down more shows that 90+ day delinquencies for credit cards have indeed surged. As we noted above, credit cards make up just over $1 trillion of the $17.7 trillion in total debt. We can’t ignore this, but for now we remain cautious things aren’t spiraling out of control as auto loan serious delinquencies remain low, with no stress at all coming from mortgages, something we saw spike ahead of the GFC.
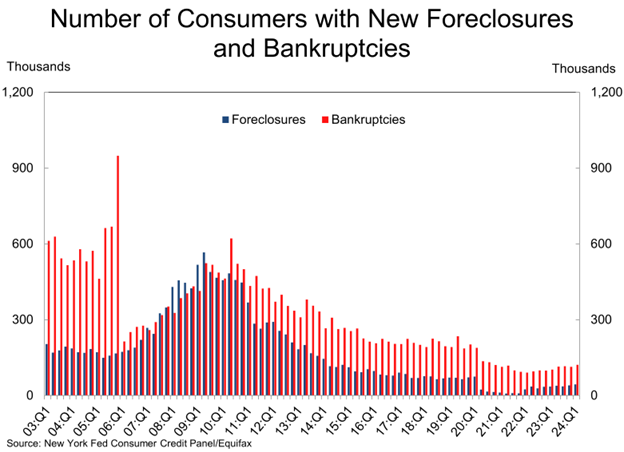
In conclusion, we aren’t seeing any surges in new foreclosures or bankruptcies either. If the “you know what was going to hit the fan,” these would spike. Look at what they did in 2005, 2006, 2007 for example. There was plenty of warning something was wrong well before the wheels fell off in 2008. Again, we aren’t seeing any of those warning signs as of now. To put it in perspective, bankruptcies are running 40% below 2019 levels.
So this might be the longest blog I’ve ever written, but there are so many things we consistently hear that aren’t true, I wanted to take a lot time to push back against the bearish and incorrect narratives. Thanks to my friends Barry Ritholtz, CIO, Ritholtz Wealth Management, and Ben Carlson, Director, Institutional Asset Management at Ritholtz, who both touched on similar things recently and gave me some major inspiration to write this one.
Lastly, thanks to Sonu Varghese, VP, Global Macro Strategist, for creating many of these really cool charts. For more on what Sonu and I think about the Dow at 40,000, please watch our latest Carson Take Five video below.
For more content by Ryan Detrick, Chief Market Strategist click here.
02254743-0524-A