
One of the most popular economic indicators is the Conference Board’s Leading Economic Index (LEI), and it currently points to recession. The LEI has historically had a high correlation with GDP growth – the chart below shows year-over-year change in both. You can see how the index started to fall ahead of the 1990, 2001 and 2008 recession (shaded areas). The 2020 pandemic recession was an anomaly since it hit so suddenly. Using the LEI means we didn’t have to wait for GDP data to tell us whether the economy was close to, or in a recession. GDP data are released well after a quarter ends and revised several times after that.
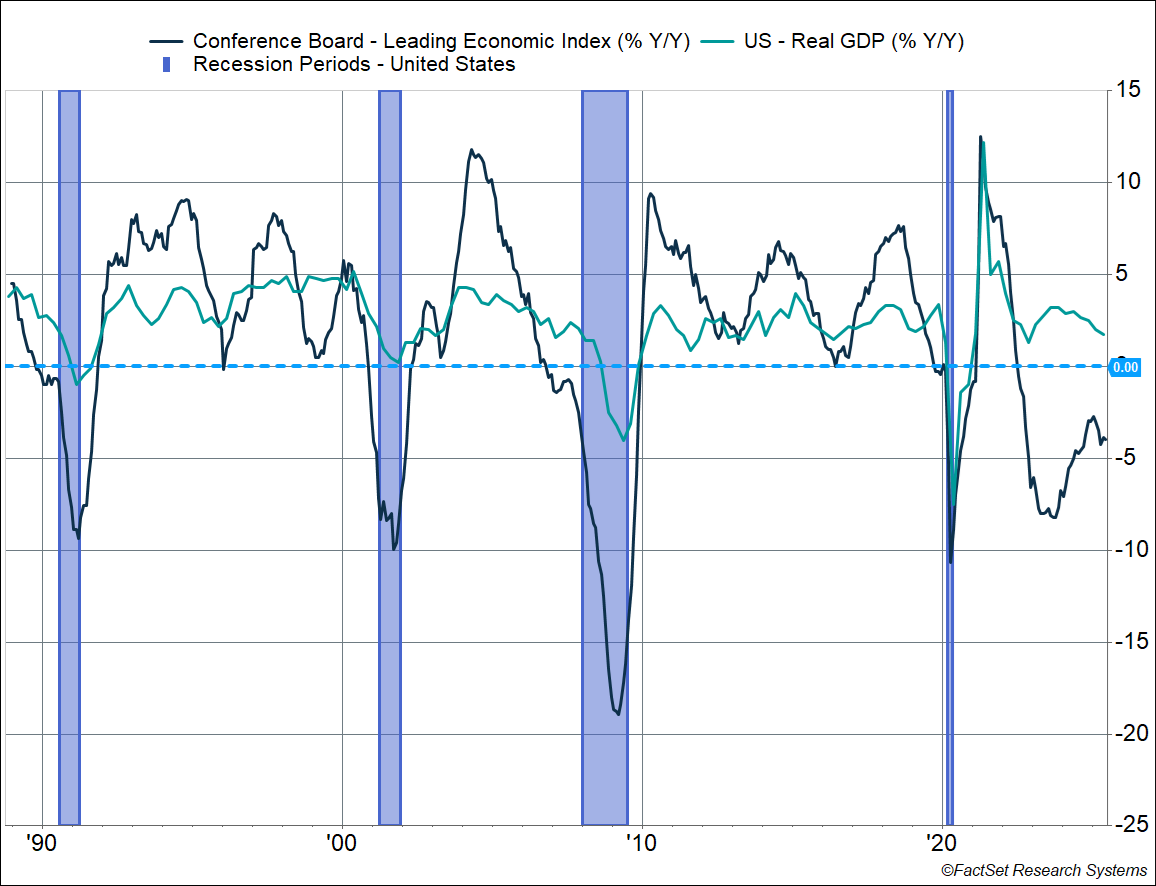
The problem is highlighted on the chart as well. The LEI has been in deeply negative territory since mid-2022 but we haven’t had a recession. For 21 straight months starting in June 2022, the LEI forecasted a recession. Meanwhile, real GDP growth clocked in at an 2.9% annualized pace over that period – not only did we not have a recession, but the pace of growth was well above the prior-decade trend of 2.4% growth, and the 2017-2019 pace of 2.8%.
As you can see above, the LEI started improving in late 2023, and through 2024, though it remains in negative territory. And in recent months, it’s taken yet another turn for the worse – with the data pointing to an imminent recession for three straight months now (April – June).
Note that the Conference Board is not forecasting a recession, despite their own data. Perhaps because it “did not work” back in 2022-2023. Instead, they believe real GDP will slow to about 1.6% this year, “with the impact of tariffs becoming more apparent in H2 as consumer spending slows due to higher prices.”
What’s Inside the LEI
The Conference Board’s LEI has 10 components of which,
- 3 are financial market indicators, including the S&P 500, and make up 22% of the index
- 4 measure business and manufacturing activity (44%)
- 1 measures housing activity (3%)
- 2 are related to the consumer, including the labor market (31%)
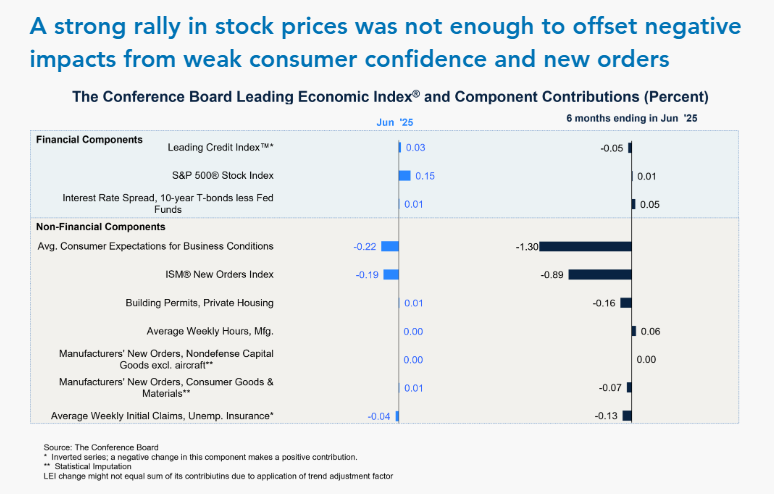
You can see how these indicators, especially sentiment, have pulled the index down by 2.8% over the past 6 months, and by -0.3% in June alone. Despite higher stock prices.
Here’s the thing. This popular LEI is premised on the fact that the manufacturing sector, and business activity/sentiment, is a leading indicator of the economy. The index is very reliant on consumer expectations and manufacturing data (ISM survey data, new orders, weekly hours). There are well known issues with consumer sentiment (including political bias), but I would argue that even the manufacturing indicators are not reflective of how the US economy works today.
Stay on Top of Market Trends
The Carson Investment Research newsletter offers up-to-date market news, analysis and insights. Subscribe today!
"*" indicates required fields
An LEI that Better Reflects the US economy
Consumption makes up 68% of the economy, and we believe it’s important to capture that. Which is not to say that sentiment and even business/manufacturing indicators are not important. But that also means there are a lot of data points that we have to look at and one way we parse through all of it is by constructing our own leading economic index.
We believe our proprietary LEI better captures the dynamics of the US economy. It was developed a decade ago and is a key input into our asset allocation decisions.
In contrast to the Conference Board’s measure, it includes 20+ components, including,
- Consumer-related indicators (make up 50% of the index)
- Housing activity (18%)
- Business and manufacturing activity (23%)
- Financial markets (9%)
Just as an example, the consumer-related data includes unemployment benefit claims, weekly hours worked, and vehicle sales. Housing includes indicators like building permits and new home sales.
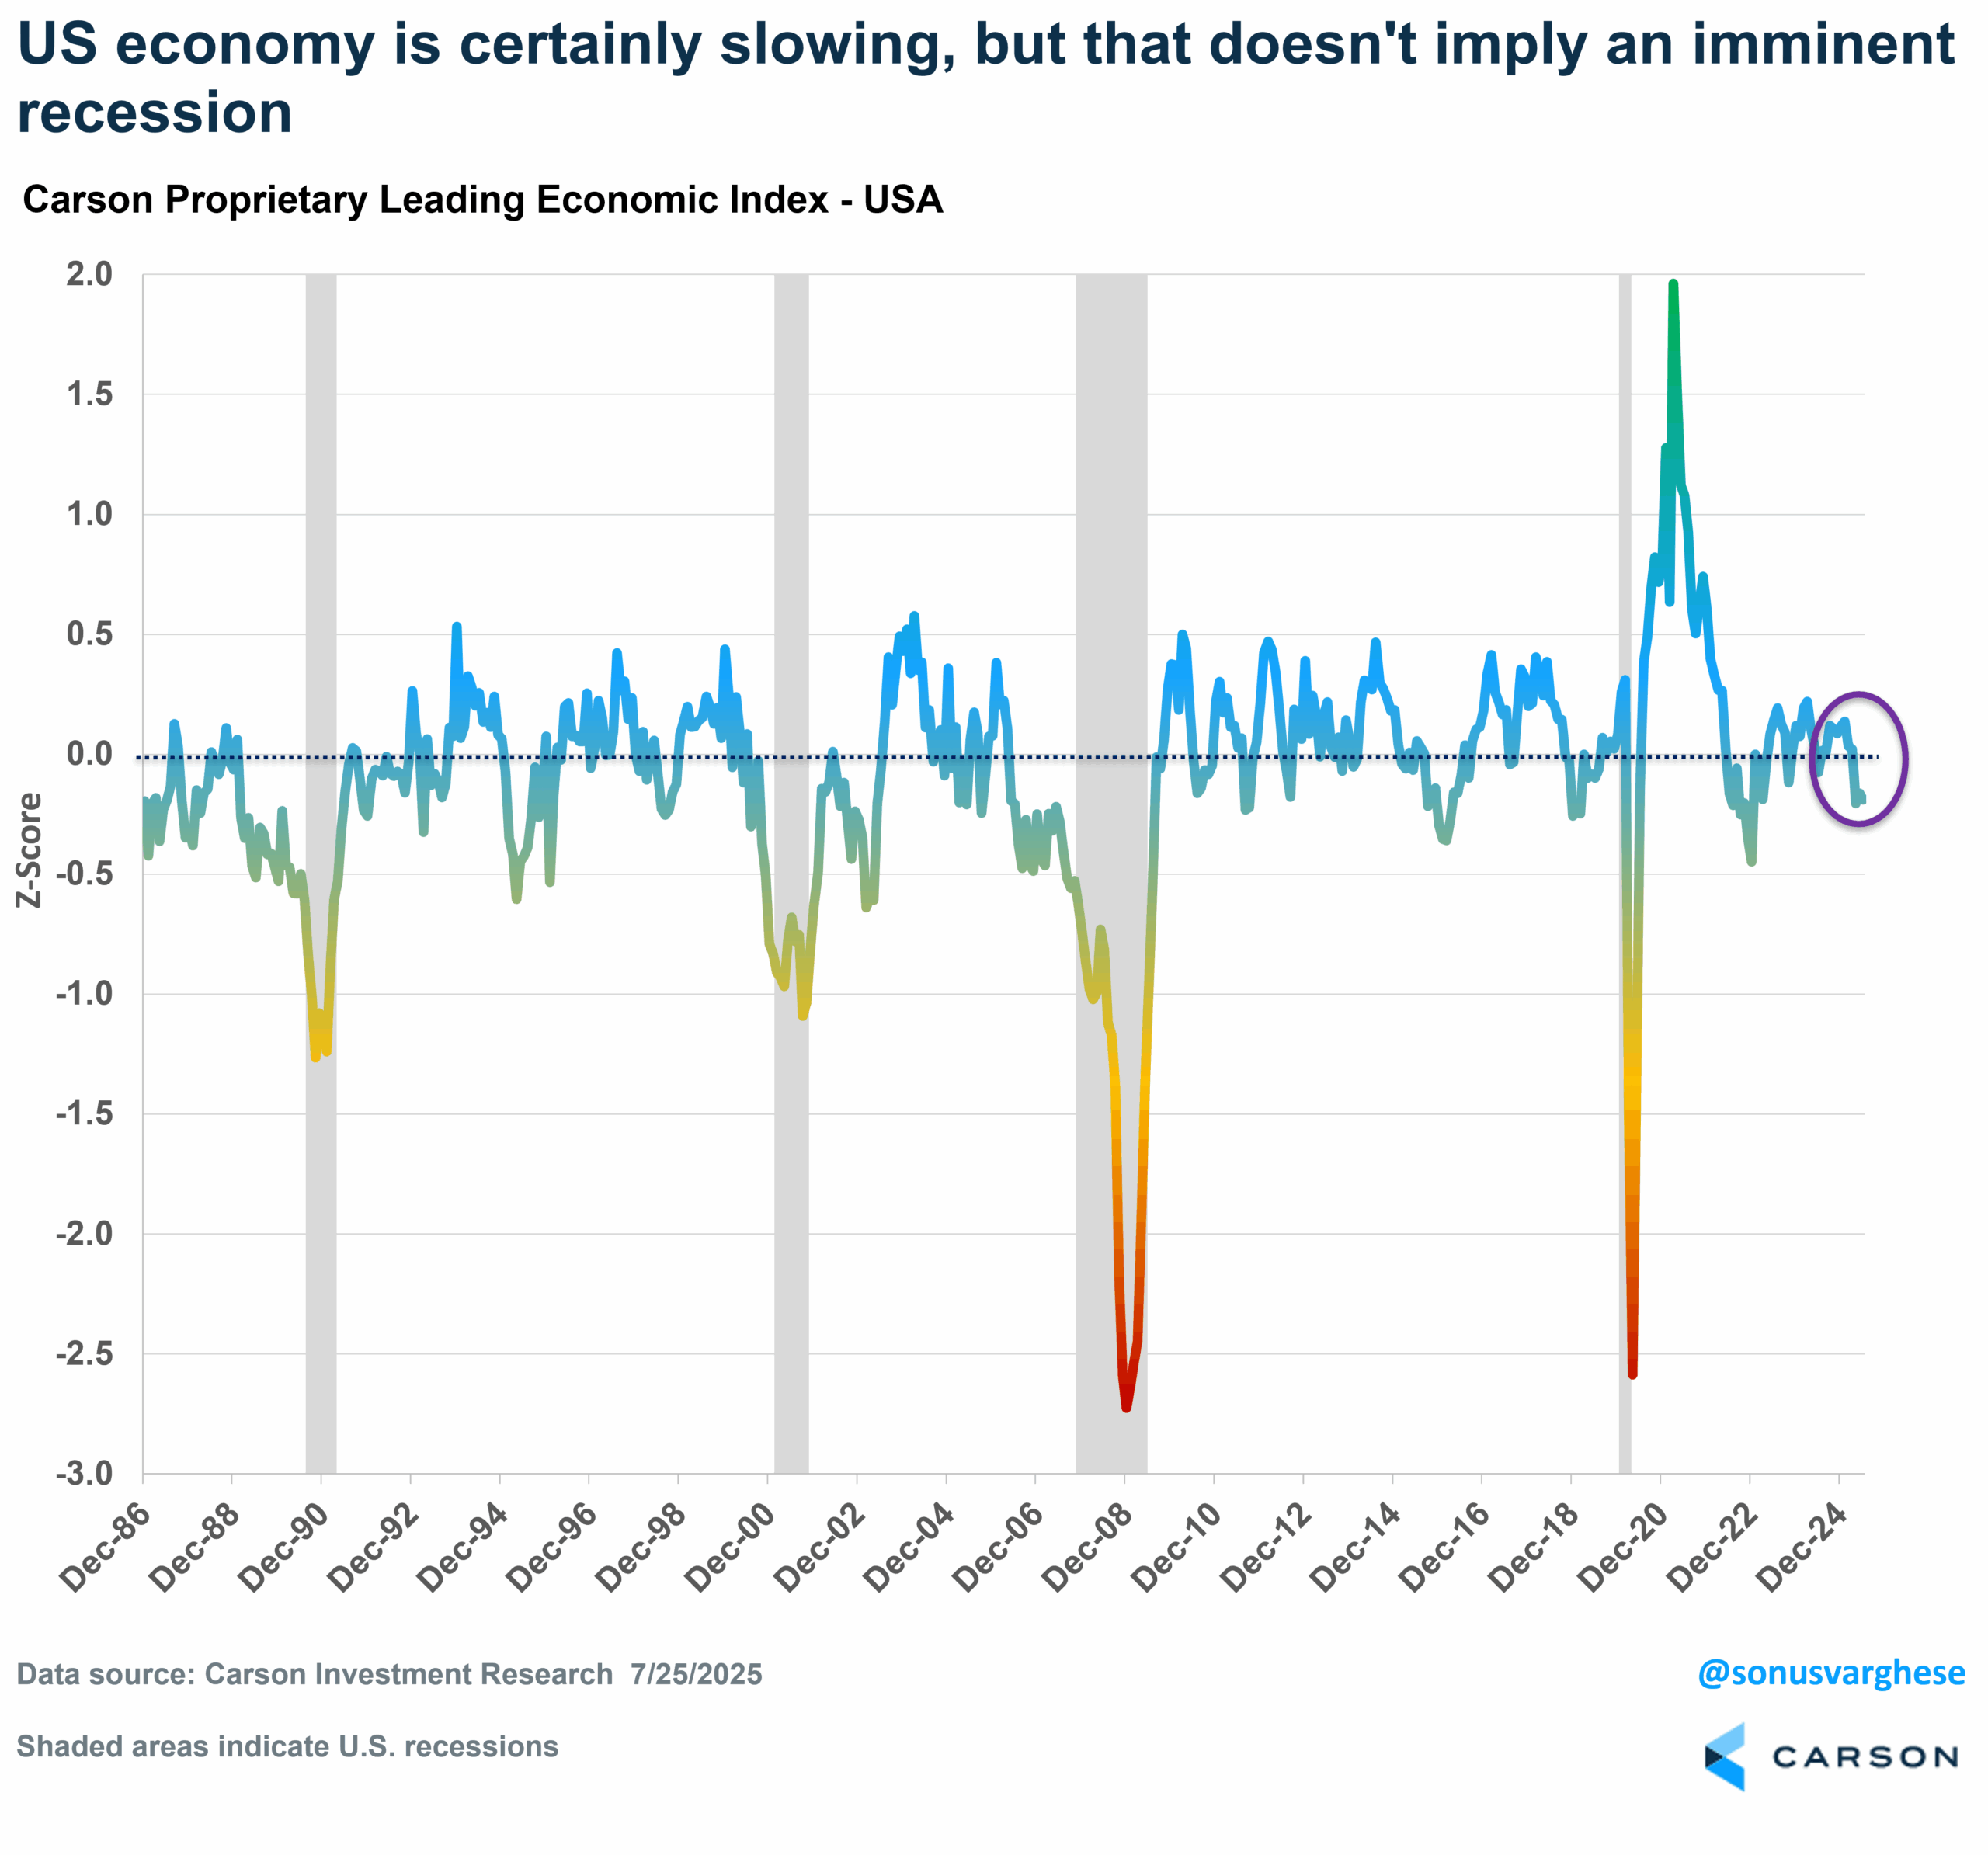
The chart below shows how our LEI has moved through time – capturing whether the economy is growing below trend, on-trend (a value close to zero), or above trend. Like the Conference Board’s measure, it is able to capture major turning points in the business cycle. You can see how the big declines coincide with recessions. The LEI actually started plunging ahead of the three recessions prior to COVID (1990, 2001, and 2007), and keep in mind that the dates for those recessions weren’t known until well after the fact.
Crucially, our proprietary LEI for the US has not pointed to a recession at any point over the last three years (though the risk was on the higher side in late 2022). This was in sharp contrast to all the recession calls you saw in 2022 and 2023 (including the Conference Board LEI). We wrote about this in our Midyear Market Outlook ’25.
Right now, our version of the LEI says the US economy is growing below trend, i.e. it’s slowing, but the index is nowhere close to recession-like levels. At least for now.
We’re seeing weakness across the board, including consumption, business investment, and housing.
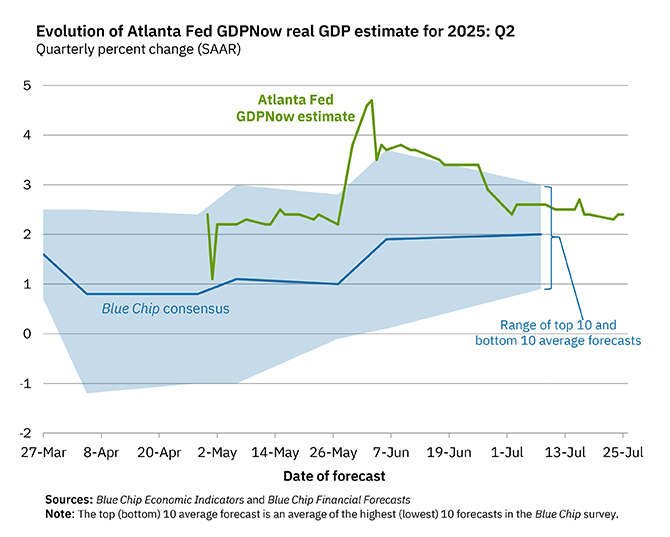
This is reflected even in the Atlanta Fed’s GDP Nowcast. Real GDP growth is expected to rebound to 2.4% in Q2, following the 0.5% decline in Q1. That is still below recent trend, but the headline figure also hides a lot of weakness under the hood – the headline is being driven by a plunge in imports, thus boosting net exports (exports minus imports). Real final sales to the private sector, reflecting demand from households and businesses, are expected to clock in between 0.5 – 1%, well below trend (it was actually stronger in Q1, running at a 1.9% annualized pace).
I discussed our version of the LEI when Ryan and I were on The Compound and Friends with Josh Brown and Michael Batnick a few weeks ago. Take a listen:
For more content by Sonu Varghese, VP, Global Macro Strategist click here
8214756.1-07.25.25A
