
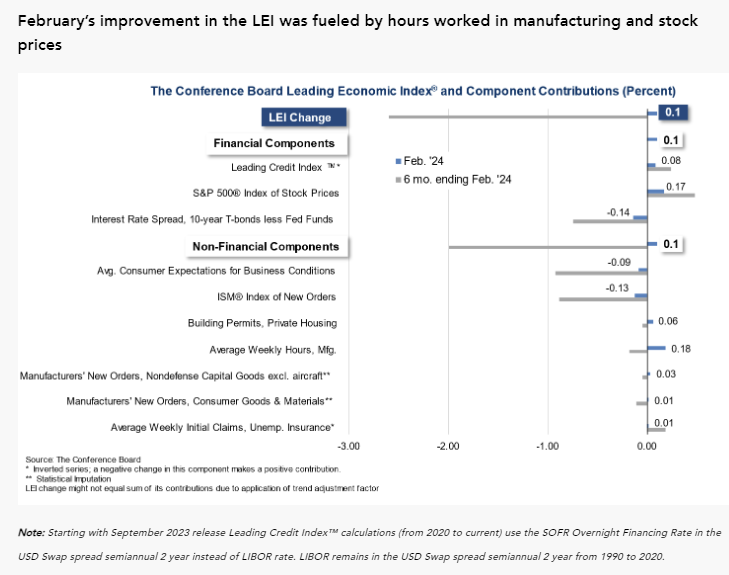
- The Conference Board’s Leading Economic Index (LEI) gained month over month in February after 23 consecutive months of declines.
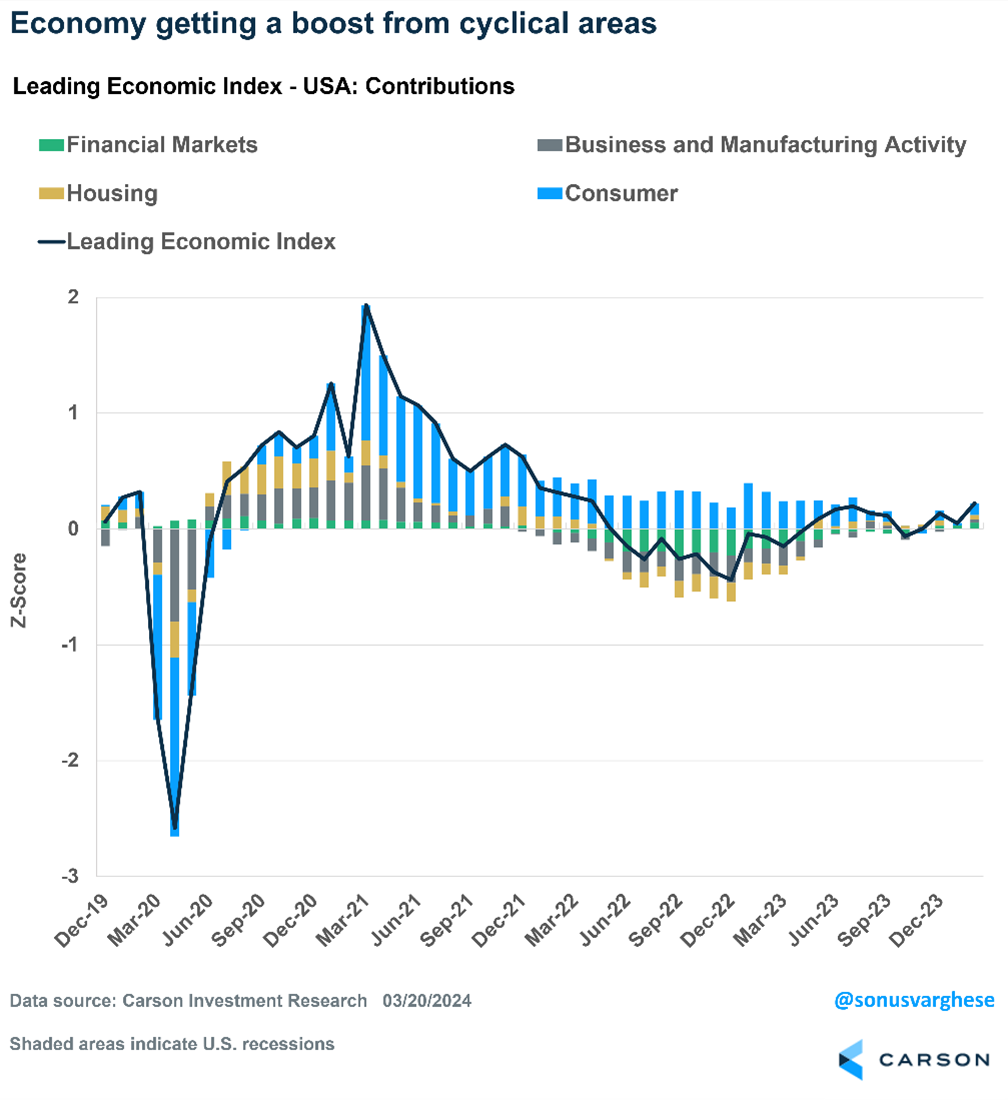
- Carson Investment Research’s proprietary leading indicator, which never signaled recession, continues to point to near-trend growth, versus the Conference Board’s forecast of slowing growth.
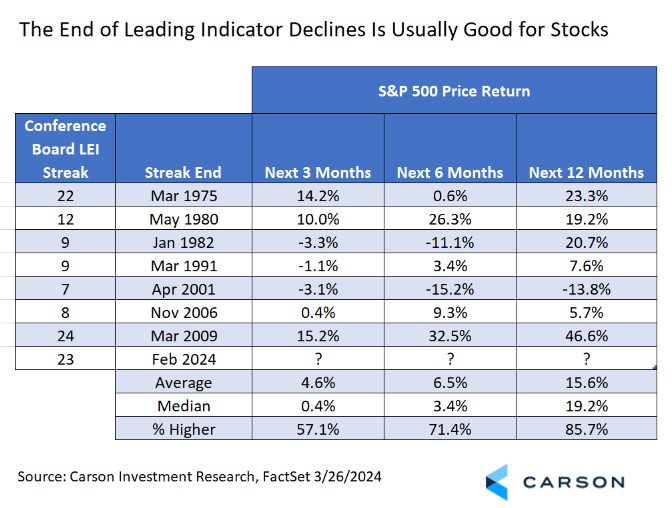
- The end of extended Conference Board LEI declines has generally been a positive signal for stocks.
- The Conference Board’s LEI continues to be weighed down by survey data and the yield curve while our leading indicator is getting a boost from cyclical areas of the economy.
Stay on Top of Market Trends
The Carson Investment Research newsletter offers up-to-date market news, analysis and insights. Subscribe today!
"*" indicates required fields
Last Thursday, the Conference Board updated its Leading Economic Index (LEI) with data from February. After 23 consecutive months of month-over-month declines, the LEI finally inched higher, granted by the smallest of margins, gaining 0.1%. Throughout the current rally we have deferred to our proprietary leading economic index, created by our VP, Global Macro Strategist Sonu Varghese, whose PhD in engineering doesn’t make him literally a rocket scientist (his work was in fluid dynamics), but close enough for us.
Our leading indicators not only covers the U.S., but all major economies based on their individual economic sensitivities, which we can then roll up to regional and global leading indicators. While our U.S. indicator did show risk elevated compared to average back in 2022, it was not signaling a recession. Rather, it pointed to something closer to a mid-cycle slowdown, which is in line with what actually happened.
Right now, our U.S. leading indicator, shown below, is signaling something in the neighborhood of trend growth for the rest of the year, supported by cyclical areas of the economy. The Conference Board continues to see growth slowing to below-trend growth after announcing that their LEI is no longer signaling a recession just last month. Of course, even that’s a big improvement over those who repeat that a recession is coming, with the timing pushed out every time they are wrong. Do that for long enough (and it’s been long enough), and you’re in “even a broken clock is right twice a day” territory.
Looking at the market impact, we’ve had only two streaks of monthly declines similar to the one we just broke, a 22-month streak ending in March 1975 and a 24-month streak ending in March 2009. There have only been five other streaks that have lasted as long as six months and no other longer than a year.
These streaks in themselves don’t mean a whole lot. It’s really the change in the index over time that matters and there may be occasional positive months. But the two previous streaks that lasted around two years did correspond to longer recessions, so they aren’t without meaning. The end of the 22-month streak in 1975 was coincident with the end of a one year and four month recession, while the end of the 24-month streak in 2009 came just three months before the end of the Great Recession, which lasted one year and six months. Compare that to the average post-WW II recession of just over 10 months.
It is noteworthy that the end of these two longer streaks corresponded to the end of some longer recessions. That gives us added confidence that we are past near-term recessionary risk. After the end of the two previous long streaks, the S&P 500 returned an average of 34.9% over the next year, although circumstances were quite different. If you look at the end of all declines of at least six months, you still get an average of over 15%.
Even though the streak is over, it doesn’t take much to get a 0.1% lift, even if it’s something we haven’t managed one in a while, and as shown below most subcomponents were flat to moderately positive. Over the last six months, the biggest drag continues to be consumer expectations; manufacturing purchasing managers’ expectations of new orders; and the yield curve. That’s two survey-based readings and elevated short-term rates due to inflation (which has declined quite a bit) rather than an overheated economy.
The bottom line is that no matter which indicators you pay attention to, economic headwinds are slowly being taken out of play. Despite a strong first quarter so far for equities and the likelihood of bumps along the way, the outlook for stocks over the rest of the year still looks solid, whether looking at the macroeconomic backdrop or market history. You can read about the latter in yesterday’s insightful blog from our Chief Market Strategist Ryan Detrick.
For more content by Barry Gilbert, VP, Asset Allocation Strategist click here.
02175282-0324-A