
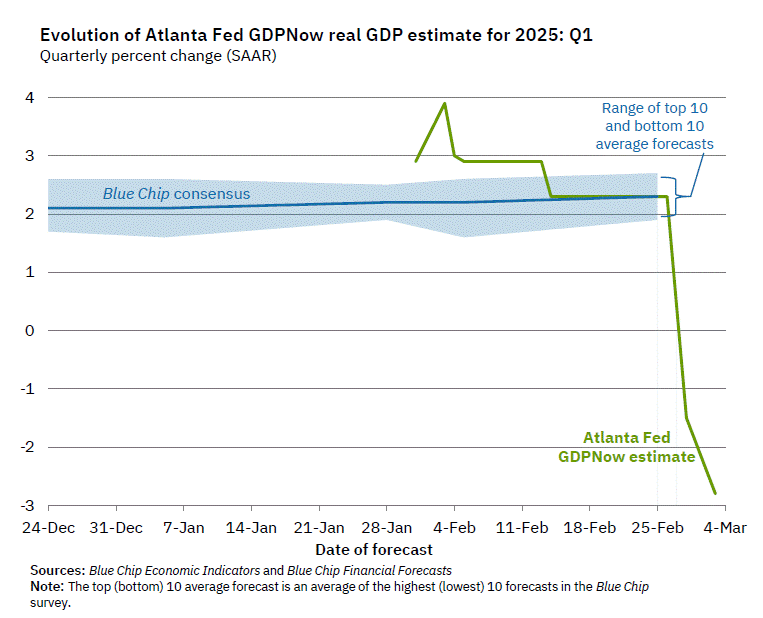
Even as the world’s attention last Friday was focused elsewhere, we got a real doozy of a data update in one corner of the economic universe. The Atlanta Federal Reserve’s Real GDP “Nowcast” for Q1 plunged from 2.3% to -1.5%, and then down to -2.8% after more data on Monday. Yeah, that’s not a typo, nor is it a computational error by the folks who run what is normally a very good, and popular, GDP growth tracker (typically even better than economists’ consensus forecast, which right now is close to 2% for Q1). The GDP Nowcast is a running estimate of GDP growth in the current quarter and is continually updated as data are released. However, as this latest batch of data just showed, the Nowcast has a big flaw, which gets to why the GDP growth tracker collapsed. In short, you shouldn’t panic, though that doesn’t mean there are no concerns.
A Surge in Imports Drives Nowcast Lower
The Nowcast plunge was triggered by the advanced estimate of goods trade data in January. Before looking at that, it’s worth recapping the components of GDP:
- Household consumption: 68% of GDP
- Nonresidential (business) investment: 14%
- Residential investment (housing): 4%
- Net exports (exports minus imports): -3%
- Federal government: 6%
- State/local government: 11%
Net exports are negative because the US imports more than it exports (a lot more). On the face of it, it looks like imports are a “drag” on GDP, but that is not really accurate (or how you should think about it). If a consumer or business buys something that’s manufactured abroad (like a TV), it doesn’t add to US gross “domestic” product. So, imports are just subtracting all the goods and services households and businesses buy from abroad, since it doesn’t represent domestic economic production. But if imports surge, that means there’s a lot of domestic demand, which will show up in higher consumption/investment and/or an inventory buildup (as businesses stock up in anticipation of higher demand in the future, or for another reason, like higher tariffs).
Stay on Top of Market Trends
The Carson Investment Research newsletter offers up-to-date market news, analysis and insights. Subscribe today!
"*" indicates required fields
That brings us to the January trade data. Imports surged in January by 12% (you can see this in the chart below), whereas exports rose just 2%. It would be one thing if imports and exports were mostly equal, but imports usually run 1.5-2 times larger than exports, and so the trade deficit (net exports) widened by 26% in January. Over the last four months, imports surged 15% while exports fell 1%, leading to a whopping 40% increase in the trade deficit.

There are a few things happening here.
One, the dollar has appreciated by over 8% between October and January (partly in anticipation of tariffs), making exports more expensive and imports cheaper. We saw a similar dynamic in 2017 – 2019 when the dollar was elevated. An elevated dollar is a drag on US exports, and the manufacturing industry. And lower exports are a drag on US economic growth. This is a risk we highlighted in our 2025 Outlook.
Two, there’s been a surge in gold imports. But this should ultimately not impact GDP, as gold is typically not widely consumed or used for production.
Three, there’s a good bit of tariff frontrunning. This is not unexpected given the tariff rhetoric and tariff reality. We saw a 10% increase in tariffs on Chinese goods plus yesterday’s announcement of 25% tariffs on Canadian and Mexican, let alone tariffs on several other trading partners.
Now, as I mentioned above, imports don’t count toward GDP, since it’s offset by a corresponding increase in household or business consumption/investment or inventories. The problem is that we got data showing an import surge, but other data haven’t shown a corresponding surge in household consumption (in fact, we got the opposite). or business investment. That leaves an inventory build-up, but we’ve simply not received that data yet, which is causing a timing problem in the data.
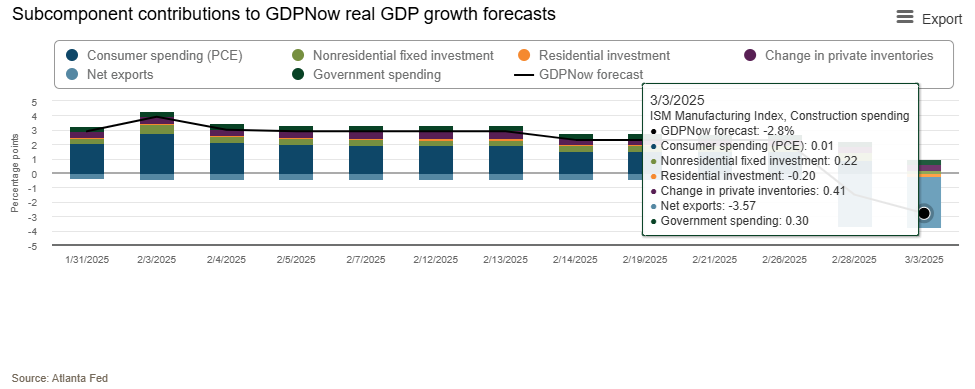
The Atlanta Fed is now estimating a whopping -3.6% contribution from net exports to Q1 GDP growth. Here’s the complete breakdown of how they get to -2.8% GDP growth for Q1:
- Household consumption: +0.01%-points (pp), i.e. no contribution from consumption!
- Business investment: +0.22 pp
- Housing: -0.20 pp
- Government spending (Fed + State/Local): +0.30 pp
- Net exports (exports minus imports): -3.57 pp
- Change in private inventories: +0.41 pp
Now, this is just one month of data (January) and there are two more to go. We’re also likely to see a big jump in inventories when that data comes out, which should send the nowcast into positive territory.
Keep in mind that the tariff frontrunning is likely not over and we could see the impact continue into February—especially as companies look to import more steel, aluminum, and even cars and car parts, before new tariffs on these items are imposed.
There are also valid reasons for concern once you look beyond the import data. GDP growth is likely to slow down considerably from the 3% annualized pace we’ve seen over the past 2 years. Real GDP growth is likely to clock in anywhere between 1.5-2.3% in Q1. I already mentioned the headwind to manufacturing exports from a strong dollar. It’s also not a surprise that investment, both business and residential (housing), is lagging. As we wrote in our 2025 Outlook, these areas are facing a big headwind from elevated interest rates. But we saw a pullback in consumption too.
Is It Time To Worry About Consumption?
The GDP nowcast estimates practically zero contribution from consumption to real GDP growth in Q1. It was just under 2%-points in each of 2023 and 2024.
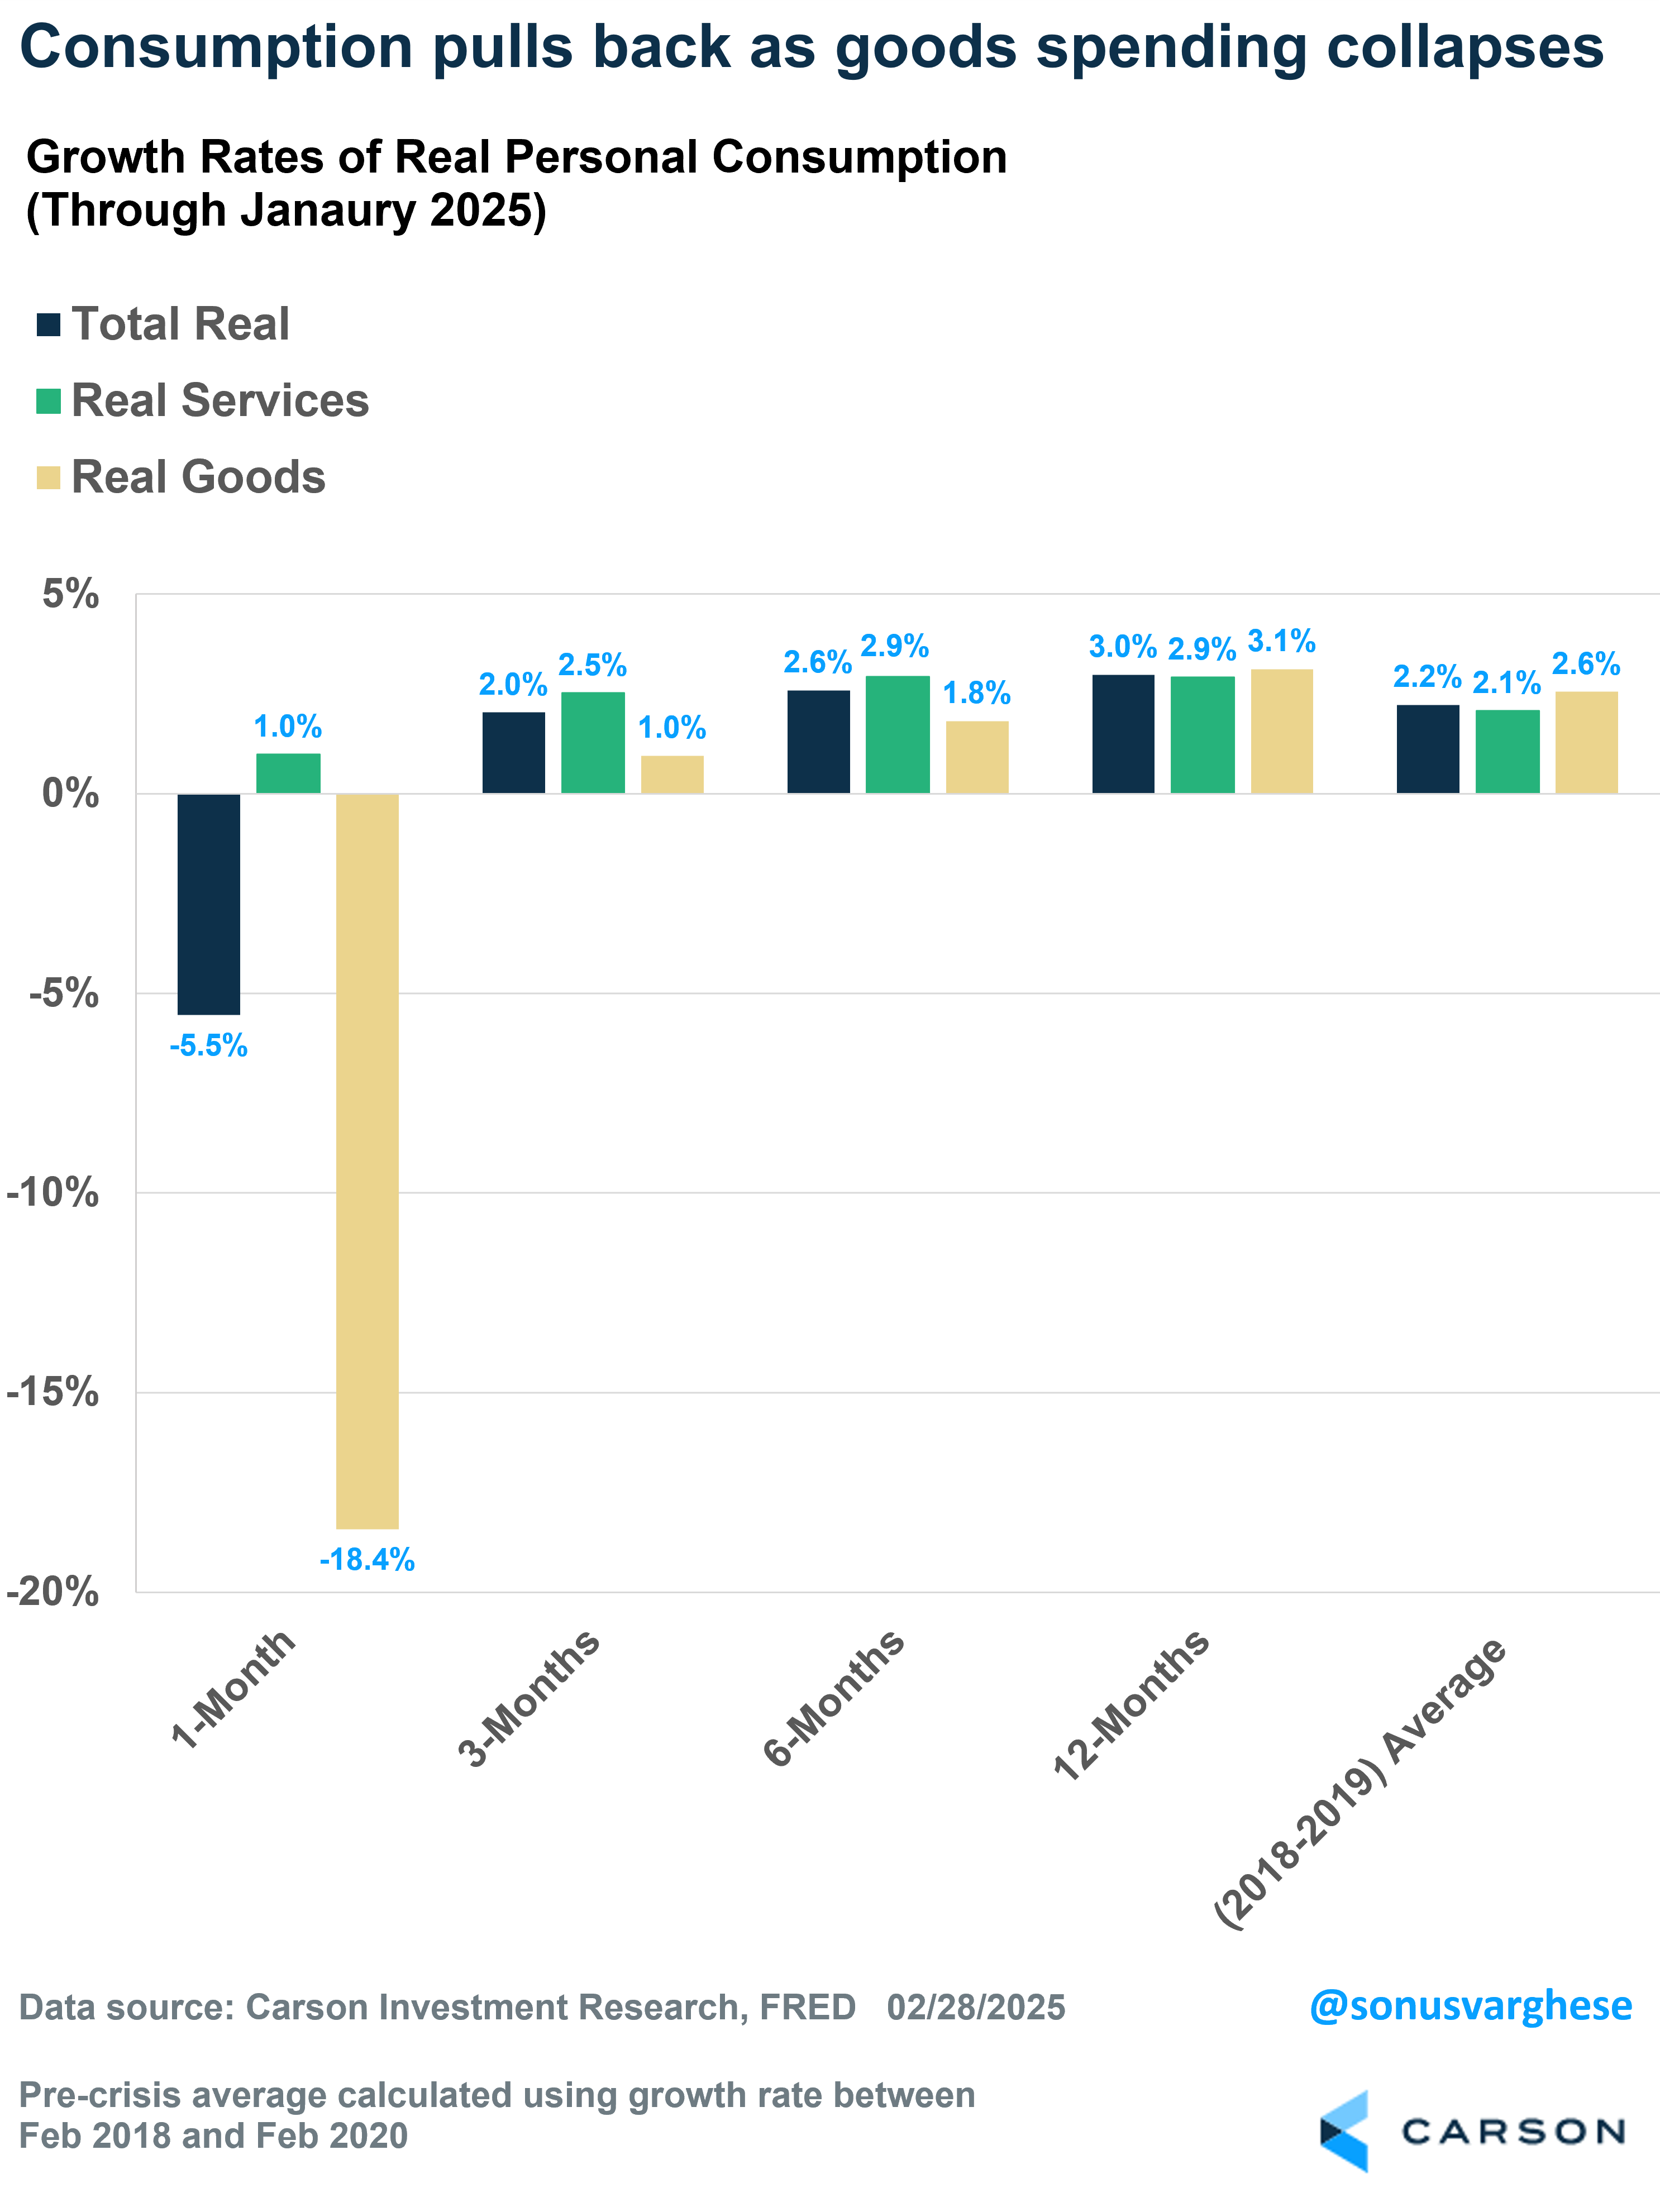
After adjusting for inflation, personal consumption fell 0.5% in January (equivalent to 5.5% on an annualized basis). This was driven by an 18.4% annualized decline in goods spending, as Americans bought fewer cars, furnishings, appliances, and recreational goods in January. It was likely due to a several reasons, including the fires in California, and unseasonably cold weather in the South, factors which suggest we could see a rebound in February and March.
At the same time, we saw real services spending rise at an annualized pace of just 1% in January, the slowest pace we’ve seen in a year. There’s been a bit of loss of momentum recently as well. Services spending was up 2.5% annualized over the last 3 months, and 2.9% over the last 12 months. Goods spending can be volatile, but what holds steady is services spending (which makes up 46% of GDP). It’s too early to tell whether the January services spending data is a blip. We saw the same drop in January 2024, but services consumption picked up and eventually rose 2.9% in 2024, well above the 2018-2019 average of 2.1%.
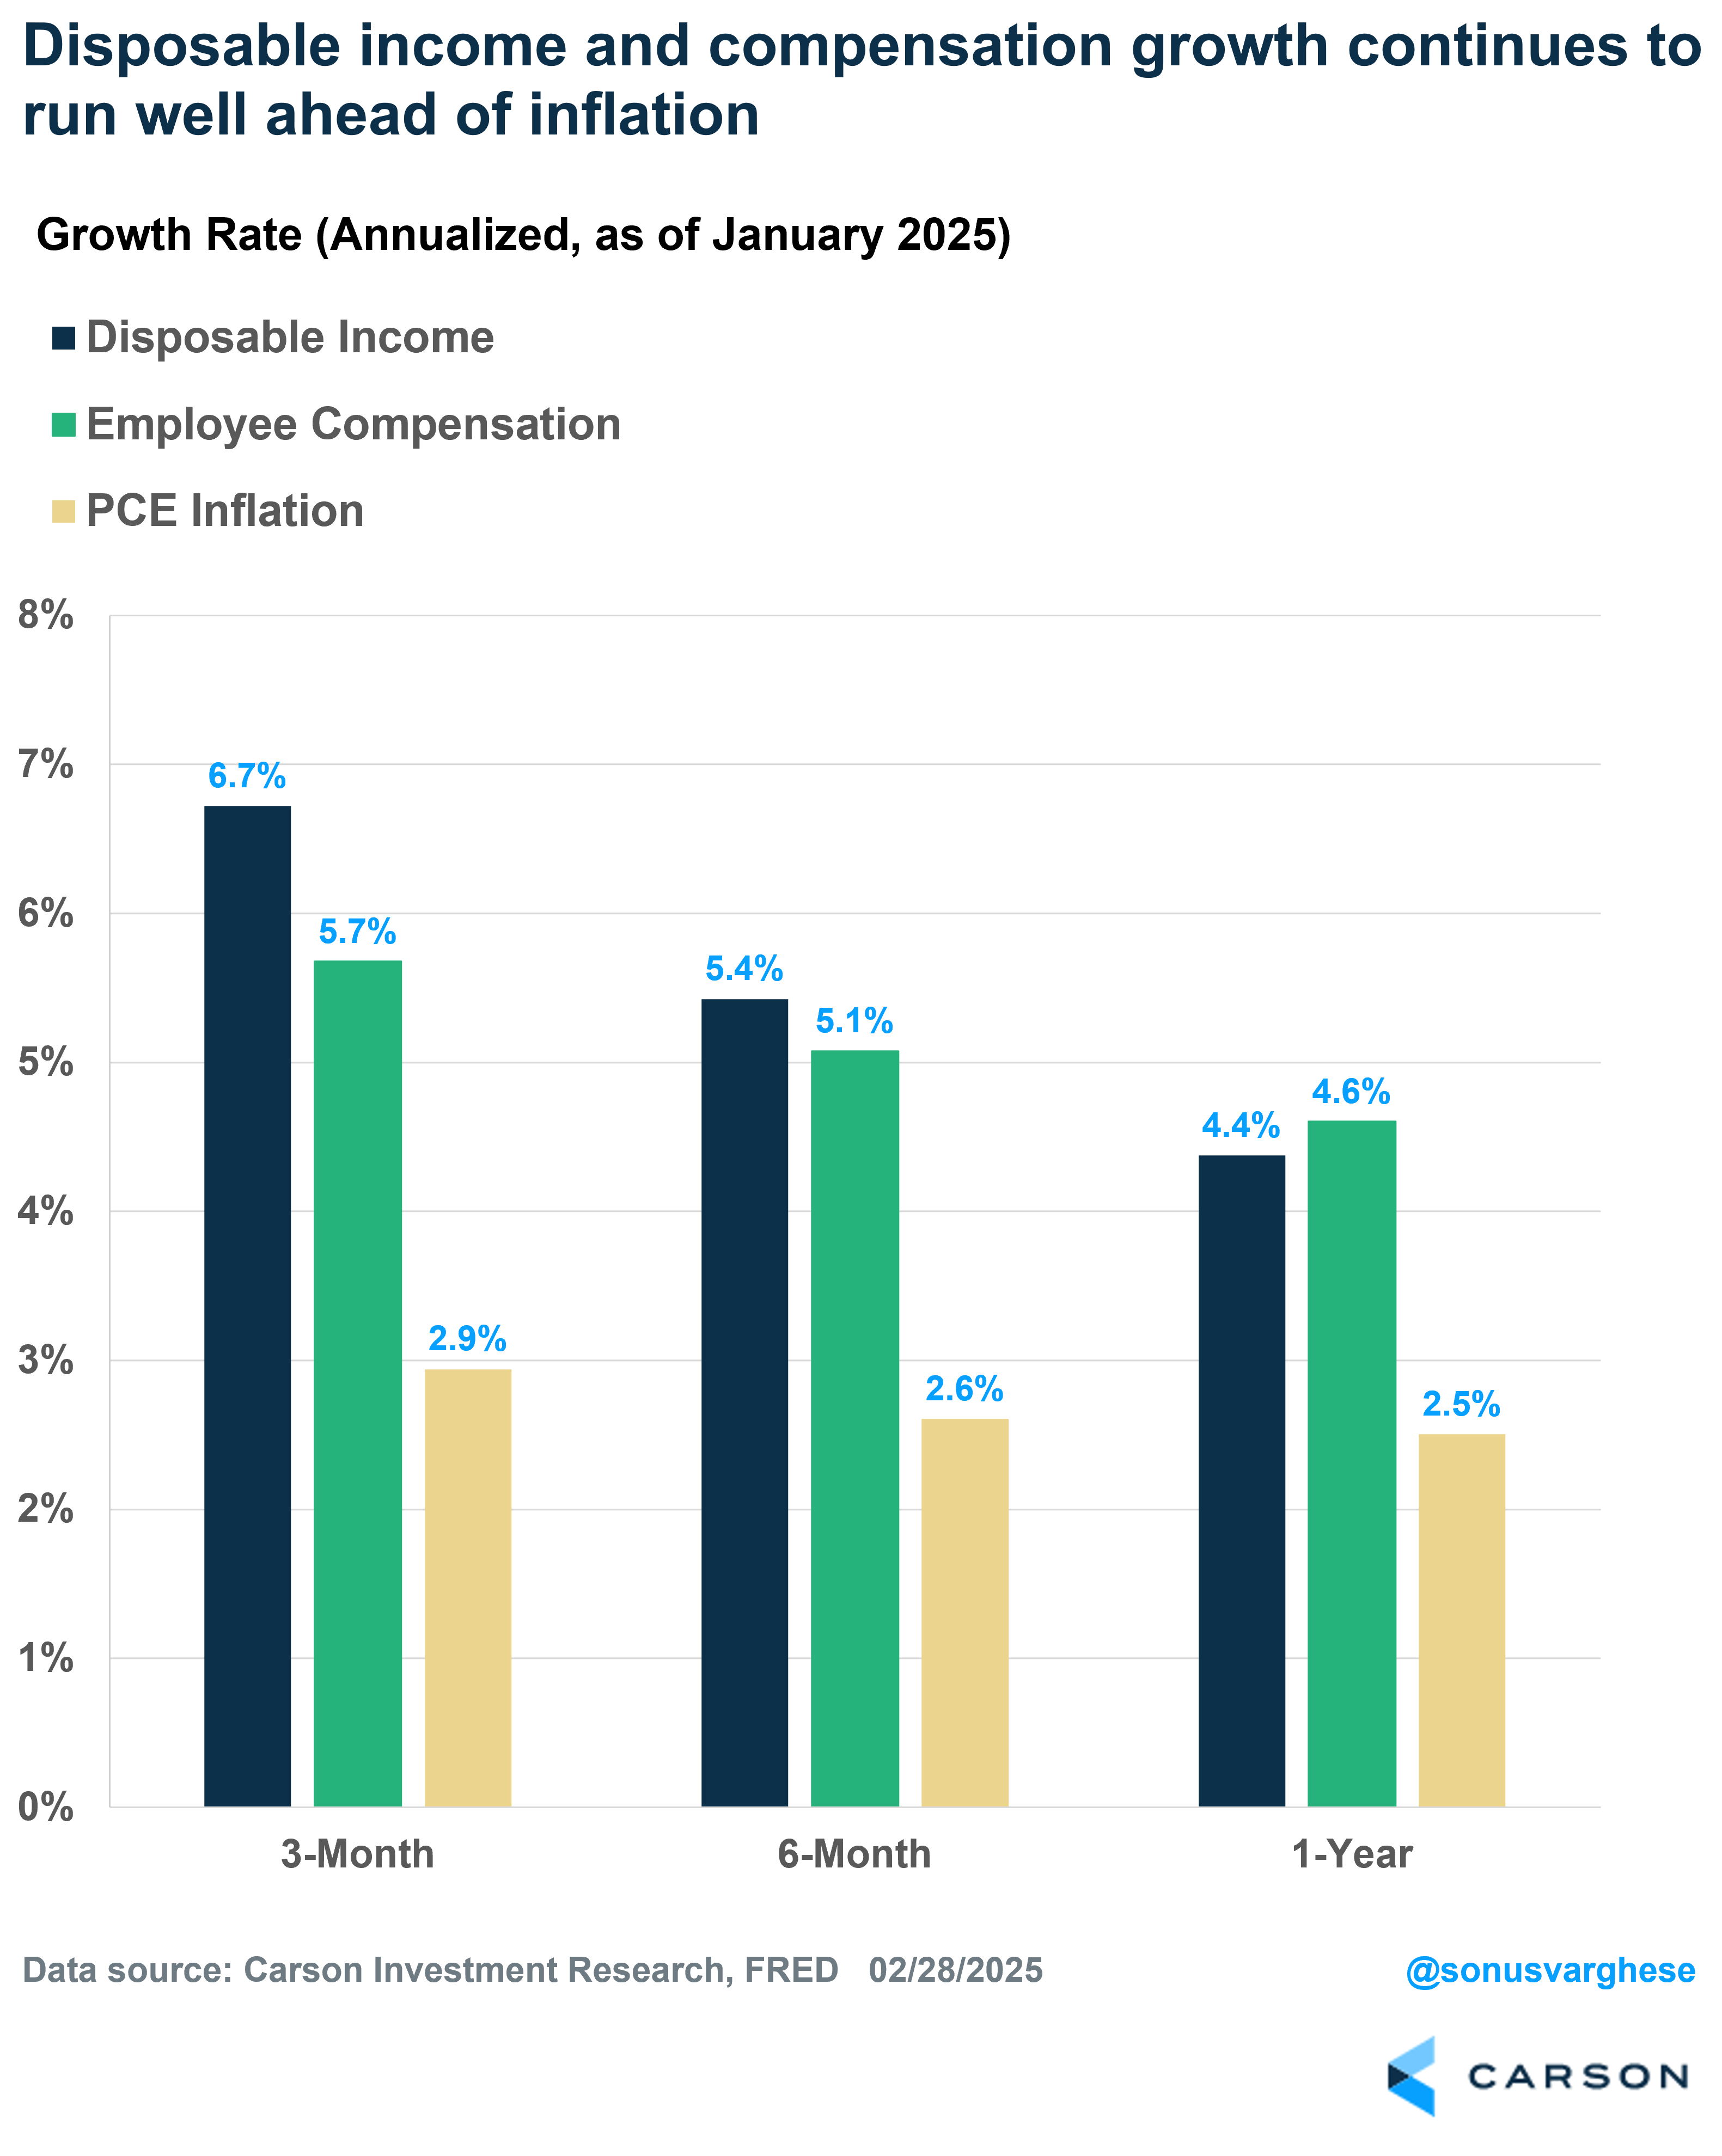
The good news is that income growth, which is what has driven spending for the last two years, was strong in January. Disposable income surged 0.9%, which translates to an annualized pace of 11.1%. This was mostly because Social Security benefits rose by 2.8%, as the government adjusted them higher for inflation. Looking at the last three months, disposable income has risen at an annualized pace of 6.7%. If you exclude the impact of government transfers (including Social Security, Medicare, Medicaid) and things like dividend and interest income, you’re left with employee compensation, and that’s also strong. Employee compensation rose at an annualized pace of 5.4% in January and was up 5.7% annualized over the past three months. These numbers are well ahead of the pace of inflation. Headline inflation as measured by the Fed’s favored metric, the personal consumption expenditures (PCE) index, rose 2.9% annualized over the last three months.
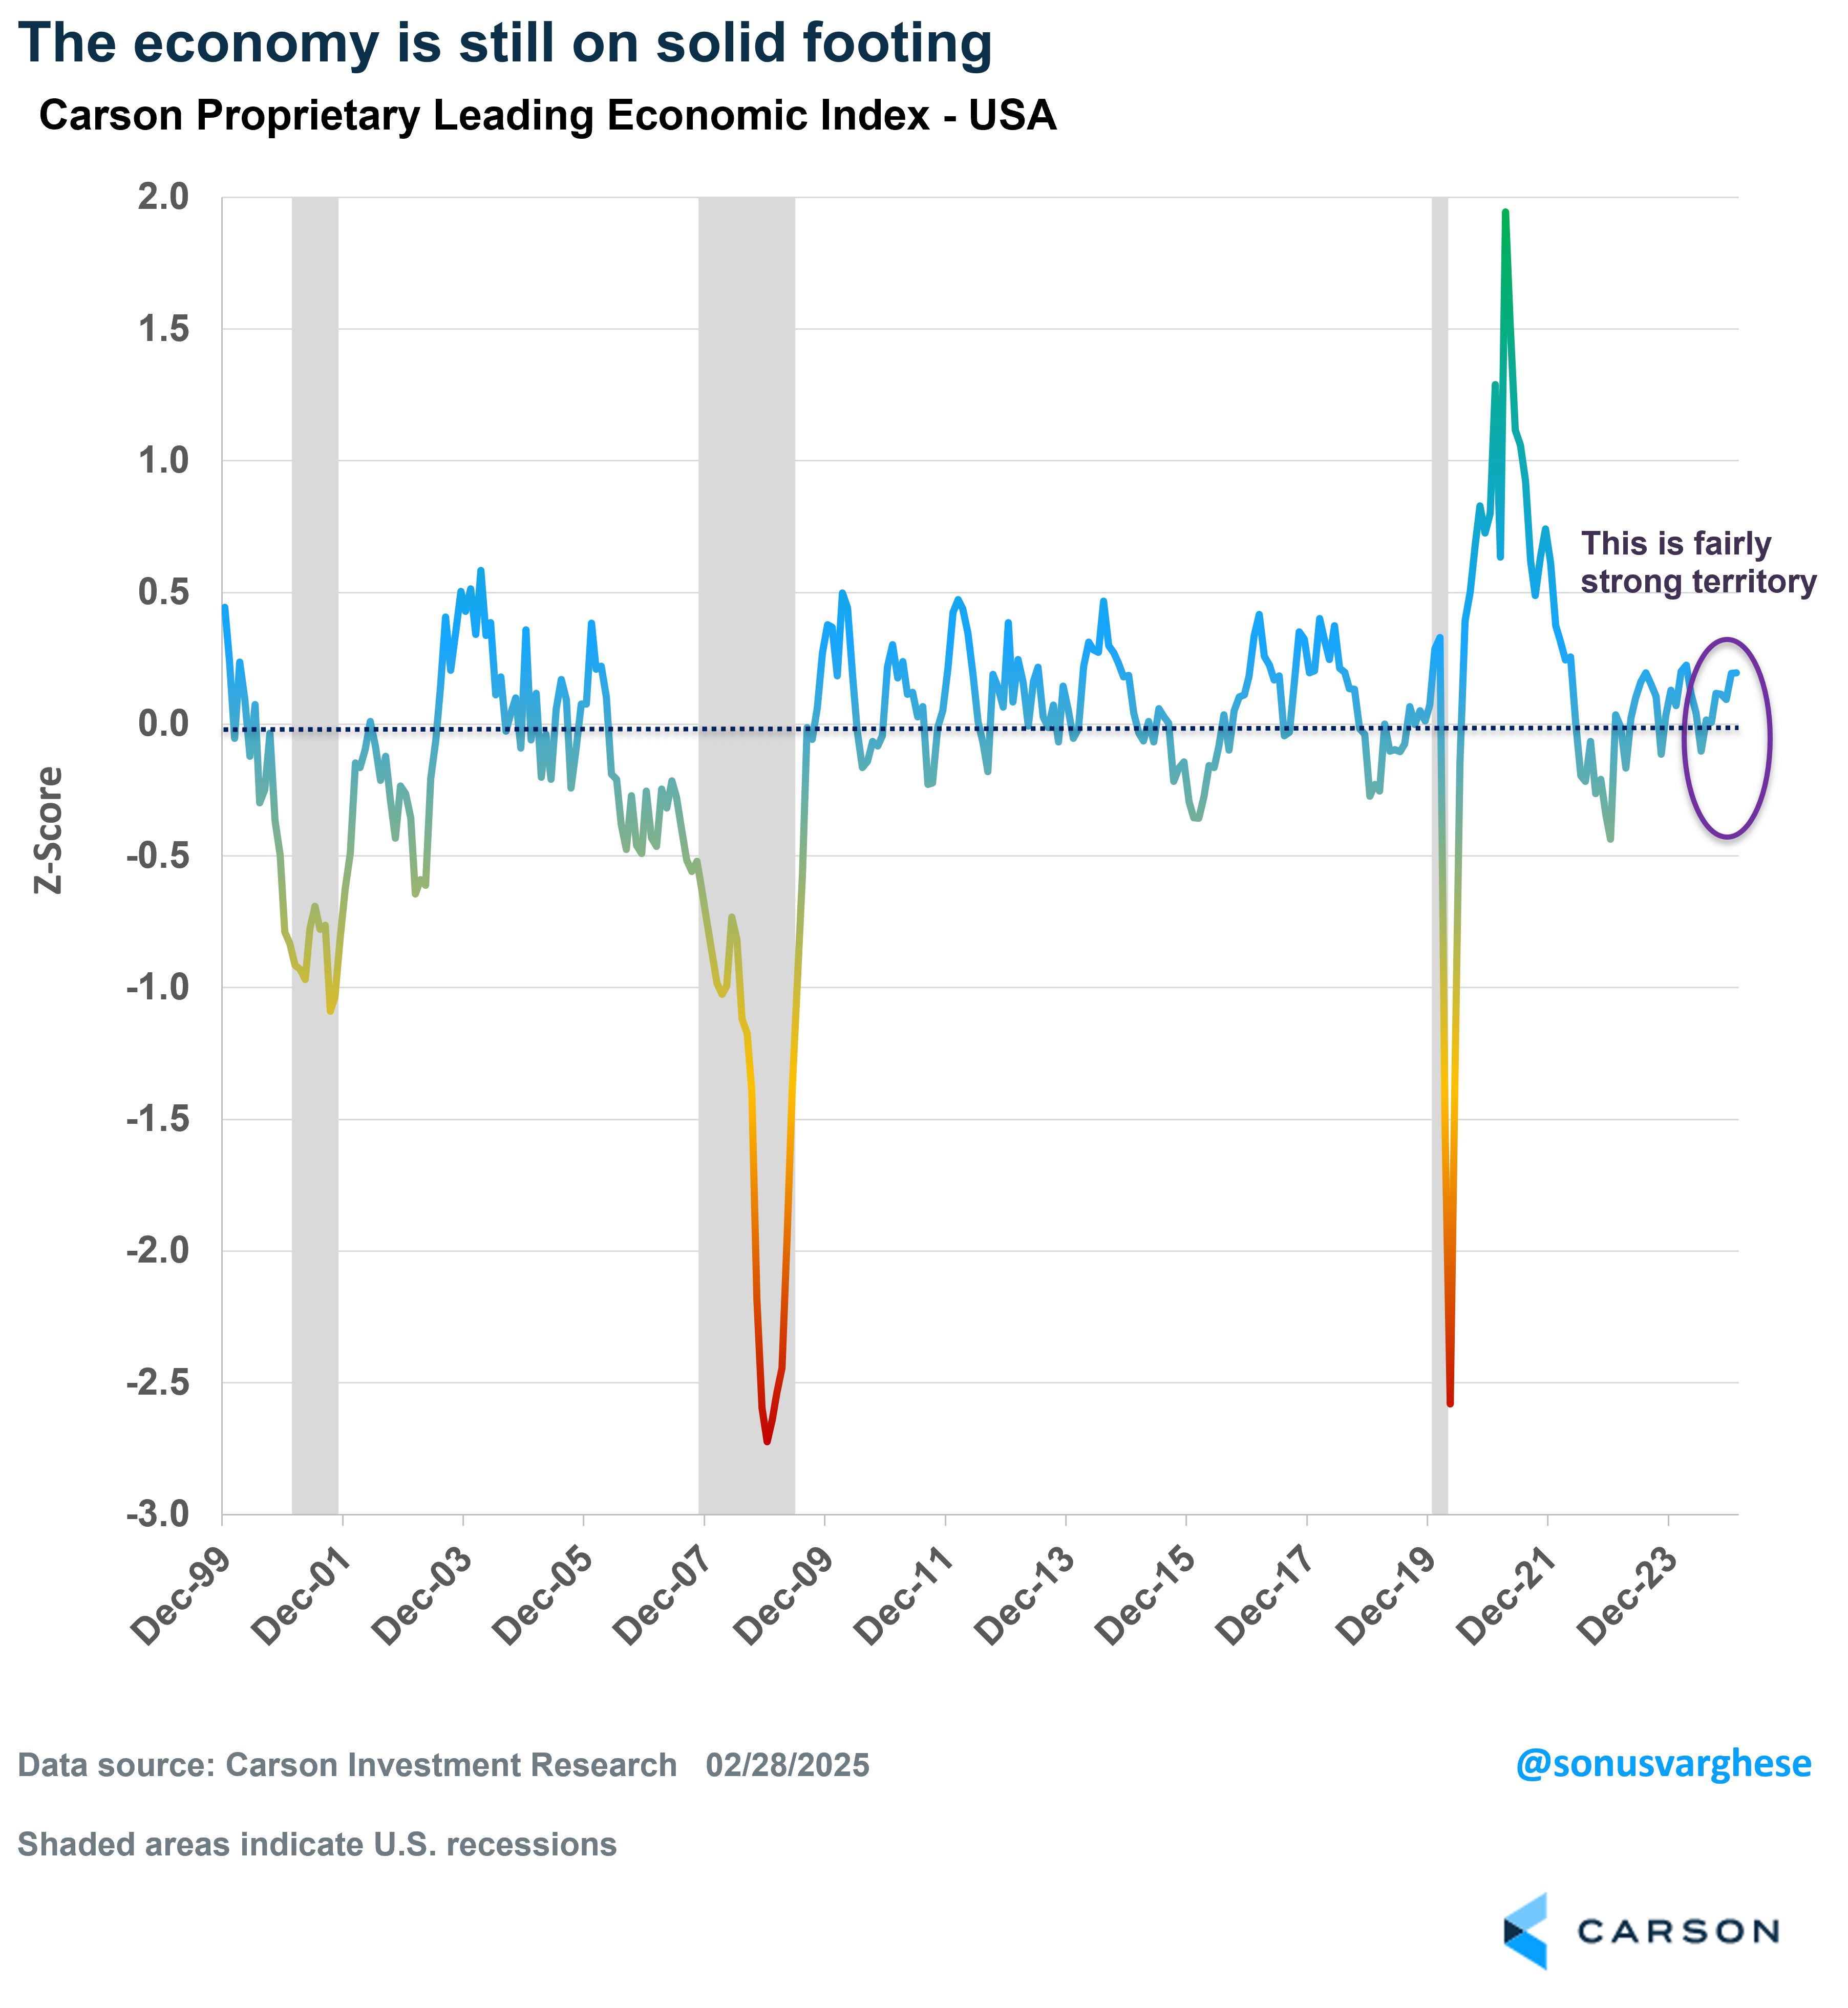
Carson’s Proprietary Index Still Points to a Healthy Economy
The noise from discrete data points is one reason why we like to get a bigger picture view using our proprietary leading economic index (LEI), which is something we populate for the US and 28 other countries. It tells us whether the US and other global economies are growing along trend, above it, or below it (and perhaps near a recession). For the US, our LEI combines various data, including consumption and labor markets, housing, business and manufacturing, as well as markets and financial conditions. As we have written in outlooks over the last two years (2023 and 2024), this was key in telling us that the economy would likely avoid a recession. Right now, our US LEI is sitting in fairly solid territory, indicating growth is close to trend, if not slightly above it. But that also means we’re likely to see GDP growth closer to 2% than 3%.
Our LEI is also a “nowcast” and reflects the breadth of current data. But we recognize that things can change. As I pointed out above, and we wrote in our 2025 Outlook, there certainly are risks and threats on the horizon, which is why we’re going to continue keeping our ear to the ground but focus on the data that actually informs us of what’s happening.
For more content by Sonu Varghese, VP, Global Macro Strategist click here.
7700562 – 0325-A
