
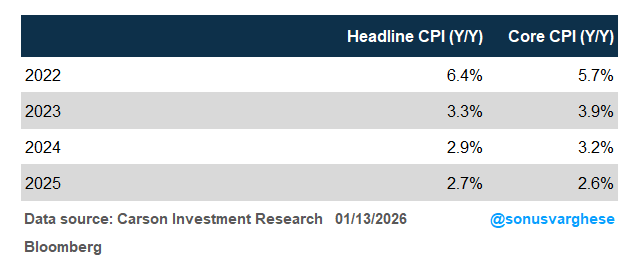
The December CPI release was an important one because it closes the book on 2025. Here’s how headline and core CPI inflation (ex food and energy) have ended each of the last 4 years:
By itself, the drop in inflation is more than welcome, and allows the Fed to focus on labor market risks. But … there are quite a few buts.
The December print for core CPI was a bit of a surprise because it came in a tad soft. Core CPI rose 0.24% m/m in December, a tad below expectations for a 0.30% reading . Note that 0.24% m/m translates to an annualized pace of 2.9%. Here’s the thing—the 3-month annualized pace is just 1.6%. Which means inflation has collapsed over the last quarter (Q4).
But not quite. As it turns out the CPI readings are skewed by the lack of data collection in October. As a result, the BLS assumed a zero percent m/m increase for rents in October, both for rents of primary residences in October and Owners’ equivalent rent (OER). Without getting into the technical details of all this, the long and short of it is that the pace of housing inflation is a lot lower than it would normally be if there was indeed data collection in October.
- In September, rents were up 3.4% y/y. That fell to 2.9% in December.
- In September, OER was up 3.8% y/y. That fell to 3.4% in December.
Yes, private market data suggests rents are easing, but the big drop from September to December is solely due to the messy data situation. This matters a lot to the overall inflation numbers because housing makes up about 34% of CPI and 42% of core CPI.
All this to say, take the overall headline and core CPI number for 2025 with several grains of salt. The problem is less pronounced for the Fed’s preferred inflation metric, personal consumption expenditures (PCE). That’s because housing makes up just about 15% of headline PCE and 17% of core PCE.
PCE is now expected to run ahead of CPI (via our friends at Employ America):
- Headline PCE is expected to be up 2.8% y/y in 2025, vs 2.7% in 2024.
- Core PCE is expected to be up 2.9% y/y in 2025, vs 2.8% in 2024.
What’s interesting is that historically PCE runs well below CPI, but right now the wedge has gone the other way. And it gets to the fact that several underlying components of CPI, which have a higher weight within PCE, are seeing elevated inflation. A couple more important points related to PCE:
- PCE has many more components than CPI.
- PCE is weighted based on how consumers actually spend (and weights change based on this) whereas CPI has a fixed-weight basket of goods and services (updated only once a year).
What the underlying CPI data shows is that goods and services that people actually buy more of are seeing elevated inflation, which is why I think it’s useful to look at some of the major categories, and individual components.
Lower Gasoline Prices Offset by Higher Electricity and Utilities Prices
The good news in 2025 was that oil prices fell and drove gasoline prices lower. The nationwide average gasoline price fell from $3.06/gallon at the end of 2024 to $2.83/gallon at the end of 2025. CPI for gasoline showed a decline of 3.4%.
The problem is that prices for energy services (electricity and utilities (piped gas)) surged in 2025:
- CPI for electricity rose 6.7% in 2025, up from 2.8% in 2024 and well above anything we saw in the 2010s. This is a direct result of surging power requirements amid the AI boom.
- CPI for utilities rose 10.8% in 2025, up from 5.0% in 2024 and close to the highest pace we saw in the 2010s. This tends to move with natural gas prices but that gets to how commodity prices other than oil moved up in 2025.

Food Price Inflation Also Picked Up in 2025
Food prices also rose in 2025. Grocery prices rose 2.4% y/y, up from 1.8% in 2024. Several everyday items saw a big pickup in prices:
- Meats: 9.2% y/y in 2025 (2.7% in 2024)
- Coffee: 19.8% (3.8%)
- Baked products like bread: 2.3% (0.4%)
One item that saw a welcome price decline was eggs—prices dropped 21% after a 37% gain in 2024, though that still leaves egg prices 8% higher relative to 2023.
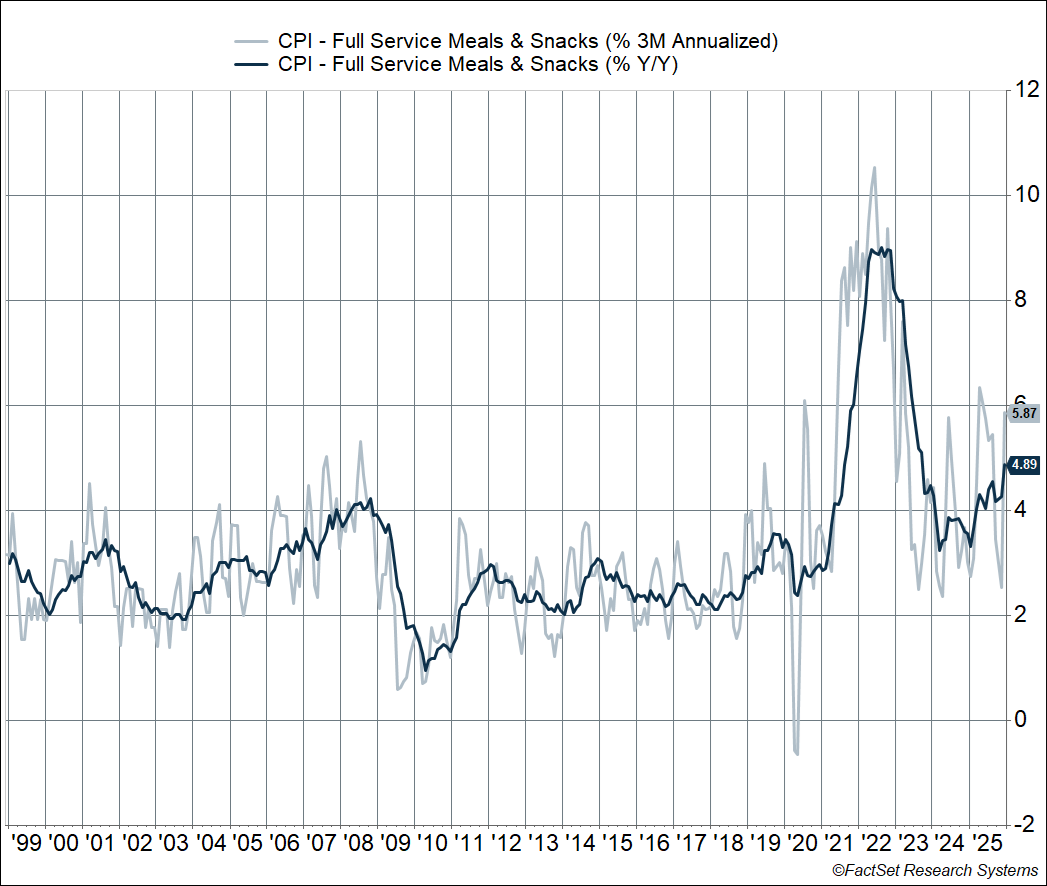
My favorite thing to keep an eye on is CPI for “full services meals and snacks,” primarily seated restaurants, to gauge underlying inflationary pressure. That’s because it combines several inflation drivers including:
- Food inflation, and even energy prices (including transportation)
- Rent of restaurant premises
- Worker wages
Inflation for seated dining restaurants rose 4.9% in 2025, up from 3.6% in 2024. That’s a faster pace than anything we saw between the late 1990s and 2020. In fact, over the last quarter, prices rose at an annualized pace of 5.9%. That’s hot, and by itself, inconsistent with “normal” 2% inflation.
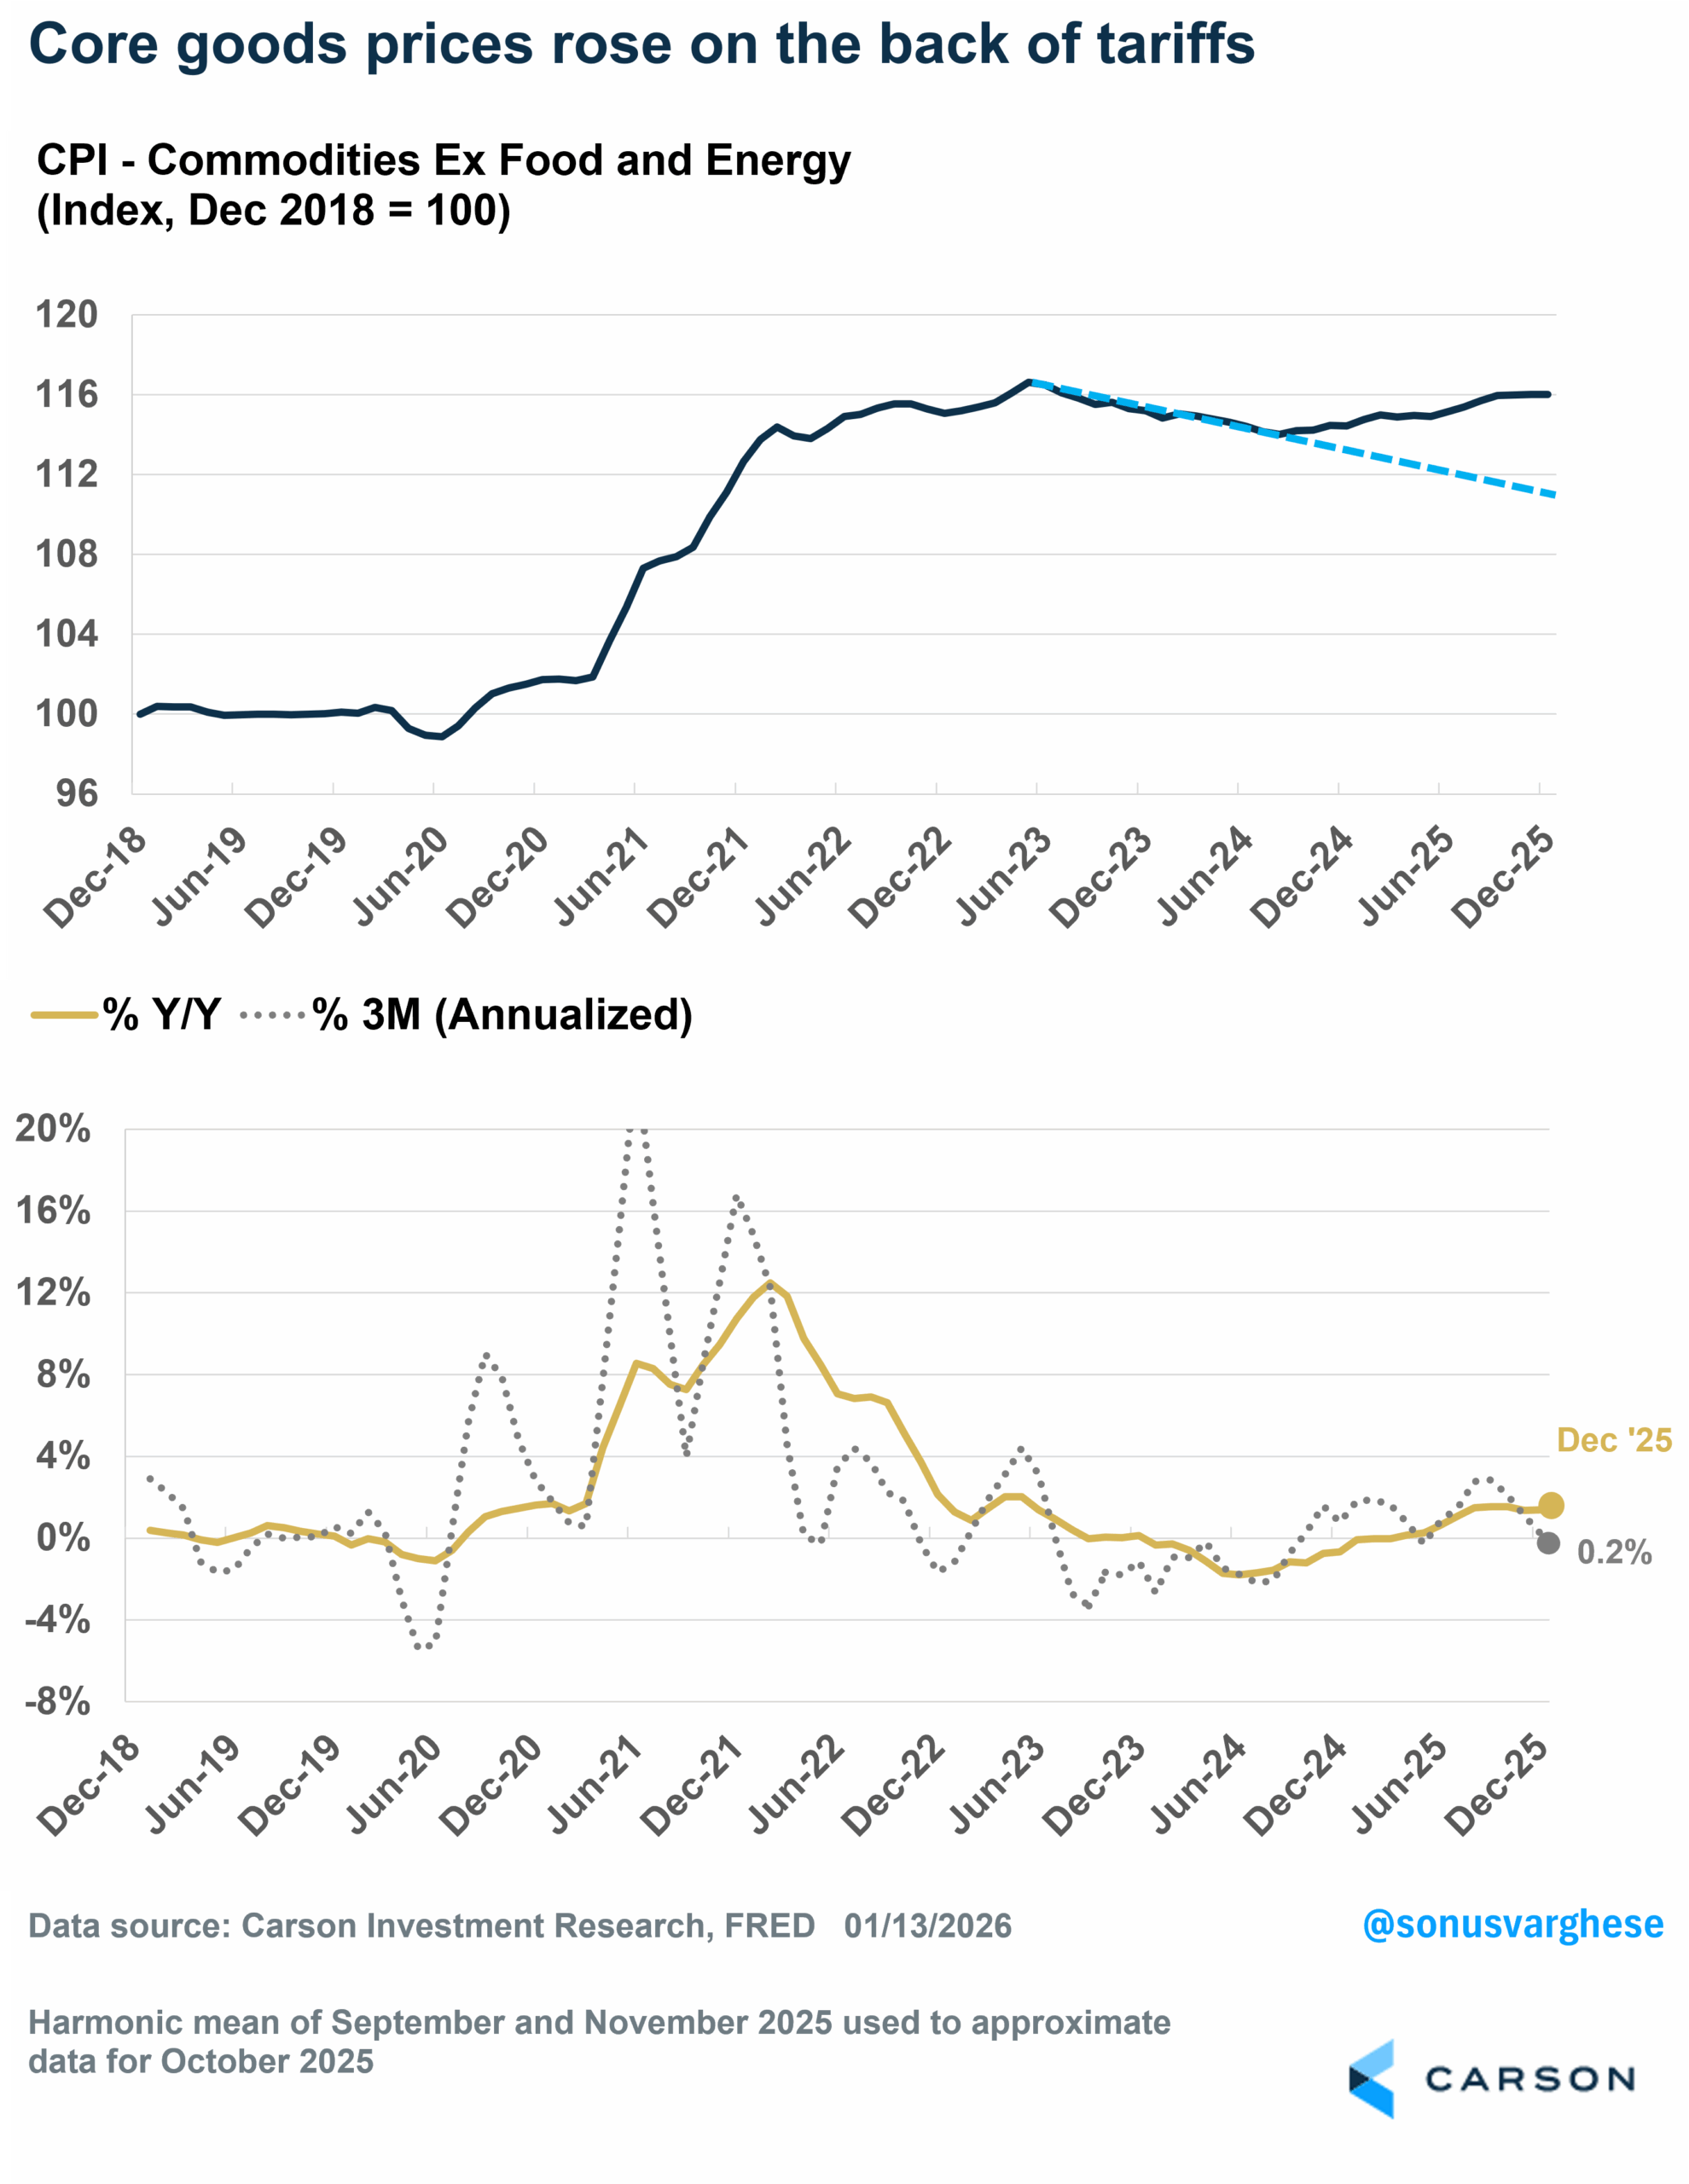
Core Goods Prices Rose Due to Tariffs, but That May Be Easing
Core goods inflation has picked up on the back of tariffs, which shouldn’t be a big surprise. The place where you would expect to see the tariff impact is in core goods prices (like furniture, appliance, car parts, and apparel), and the tariff impact is showing up there, though it’s not as bad as expected for two reasons:
- A lot of the tariffs have been rolled back. We’re near the “best case” scenario with tariffs at an effective rate of about 10%. Less than 50% of imports are currently being tariffed more than they were in January (with a lot of products getting exemptions).
- Companies are eating more of the tariffs rather than passing them on to consumers (this may be because they’re still working off lower cost inventory for now).
CPI for core goods (commodities excluding food and energy) rose 1.4% in 2024. That doesn’t seem like a lot, but keep in mind that prices for core goods were falling last year, reverting to their pre-pandemic trend after the big spike in 2021–2022. Core goods inflation was running at -0.5% in 2024, which means we saw a near 2%-point upswing for these goods in 2025.
Here’s what we saw for several key items
- Furnishings & supplies: 3.4% y/y in 2025 (vs -0.9% in 2024)
- New vehicles: 0.3% (-0.4%)
- Used cars: 1.6% (-3.3%)
- Prescription drugs: 2.0% (1.1%)
- Recreational commodities: 1.2% (-1.5%)
The good news is that the tariff impact may be fading. Core goods inflation eased to a 0.2% annualized pace in the fourth quarter. Prices have started to flatline and if the trend reverts to what we saw pre-tariffs, prices should fall in 2026. Still the chart below shows that tariffs indeed did have an impact by raising prices above where they would have been in the absence of tariffs.
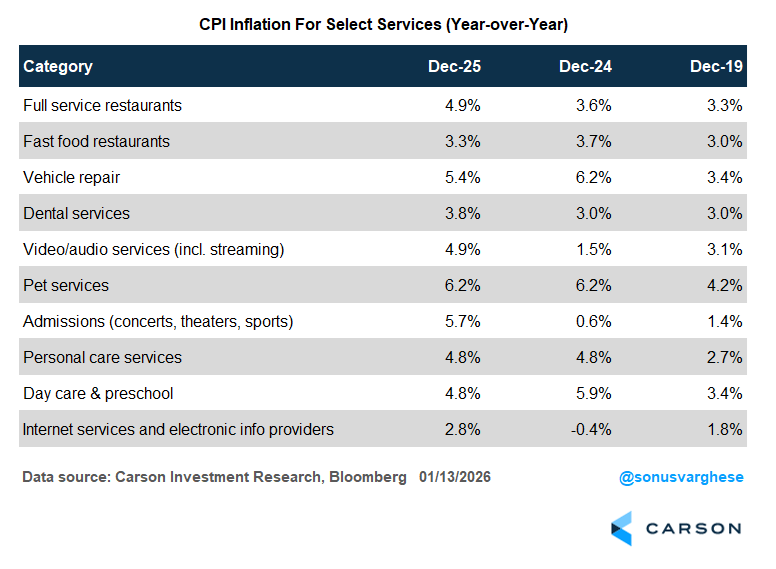
The Problem: Inflation for Services Other Than Housing Remains Hot
Even if you argue that core goods inflation is transitory, which looks to be the case, the fact that core services ex housing inflation is as elevated as it is a problem.
The following table shows inflation for several salient services over the past year, compared to 2024 and even 2019. These are everyday services that households spend money on, and you can see that they’re running above even the elevated 2024 pace, let alone the pre-pandemic (2019) rate.
Stay on Top of Market Trends
The Carson Investment Research newsletter offers up-to-date market news, analysis and insights. Subscribe today!
"*" indicates required fields
The Glass Half-Full View
Higher food and electricity/utility prices, combined with elevated inflation for everyday services, explains why there’s a lot of angst about inflation and affordability. This would explain poor consumer sentiment.
Inflation basically has 3 main drivers:
- Oil prices
- Housing
- Labor market
Oil prices have fallen, with perhaps more downside pressure to come, especially if more oil comes out of Venezuela (and maybe Iran). Official housing data is likely to show more disinflation (setting aside data issues temporarily), especially if it follows the trajectory of private rental data. Apartment List still shows nationwide rents declining 1.3% year over year, the 31st straight month of declines.

That leaves the labor market. On the face of it, the labor market is slowly cooling but hiring is certainly weak as I wrote in my prior blog. This should drive prices lower, especially for core goods and core services. Core goods have been hit by tariffs, but that headwind looks to be fading.
However, hot core services inflation, as we’re seeing now, is not what you would expect amid a weakening labor market. In fact, I’d argue that the strength in core services inflation, especially for things like restaurant prices, tells you that the labor market is perhaps not as weak as hiring data suggests.
We’ve seen this in the labor market data too. The employment-population ratio for prime-age workers (25-54) is at a level that is higher than at any point during the last two expansion cycles (in the 2000s and 2010s), telling us more people in their prime years are working now than they did during the 2000s and 2010s. Wage growth is also running ahead of the pre-pandemic trend. Average hourly earnings are up 3.8% year on year in 2025, above the pre-pandemic (2018-2019) trend of 3.2%. This by itself would explain why services inflation is running on the hotter side, never mind dynamics around housing inflation.

Of course, this is also a glass half-full view, where stronger services inflation (outside of housing) implies that the labor market is perhaps not as weak as the hiring data implies. But this also means things could heat up further if hiring picks up. This is one reason why we don’t really expect inflation to head back to the Fed’s target of 2% in 2026. Rather, we expect inflationary growth. That doesn’t mean we expect inflation to surge above 3%. That’s not likely in the face of shelter disinflation. But inflation could run at 2.5-3%, unless we see significant weakening in the labor market, and the economy. But that’s not our base case right now, as we write in our 2026 Outlook: Riding the Wave, which was just released last week.
Ryan and I also talked about all this on our latest Facts vs Feelings episode
For more content by Sonu Varghese, VP, Global Macro Strategist click here.
8712403.1. – 14JAN26A
