
“Please, God, just one more bubble.” Popular Silicon Valley bumper sticker after the tech bubble burst
With stocks back at all-time highs, many are of the opinion that stocks must be in a bubble. Take note, many of these bubble callers were the same bears that fought this bull market all the way up. Now they are taking a different angle on their incorrect calls and blaming things on being in a bubble, because it can’t possibly be their fault. It must be a bubble.
We disagree, as this is not a bubble. Could there be parts that feel a little over the top? Sure, the excitement toward the Mag 7 at the start of this year was maybe a bubble in how much everyone talked about these names and sure enough, we’ve seen both Apple and Tesla drastically underperform lately. But a bubble overall? We’d say no way.
Stay on Top of Market Trends
The Carson Investment Research newsletter offers up-to-date market news, analysis and insights. Subscribe today!
"*" indicates required fields
Let’s start at the beginning. What is a bubble? I found this definition in a Forbes article and liked it:
A stock market bubble—also known as an asset bubble or a speculative bubble—is when prices for a stock or an asset rise exponentially over a period of time, well in excess of its intrinsic value. Eventually, prices hit a wall and then fall very far, very fast, as the bubble “pops.” Bubbles can occur to all kinds of assets in addition to stocks, from real estate and collectibles, to commodities and cryptocurrencies.
Famous bubbles include tulips in Holland in the 1600s, the South Sea bubble in London in 1720, railways bubbles of the 1840s, the roaring ‘20s and crash of 1929, the Japanese real estate and stock market bubble of the 1980s, the tech bubble in the US of the 1990s, and the housing bubble that burst in 2008. There were many others, like baseball cards, beanie babies, and even Wordle if you ask me. Bubbles can be anything that is popular, sees tons of excitement, then the hype is simply too much and the excitement falls, likely along with prices.
The other thing about bubbles is in some cases the prices drop in excess of 90% (or more) and rarely recover or can take decades to recover. It took Japan’s Nikkei 40 years to get back to new highs, while many tech bubble stocks will never recover their losses.
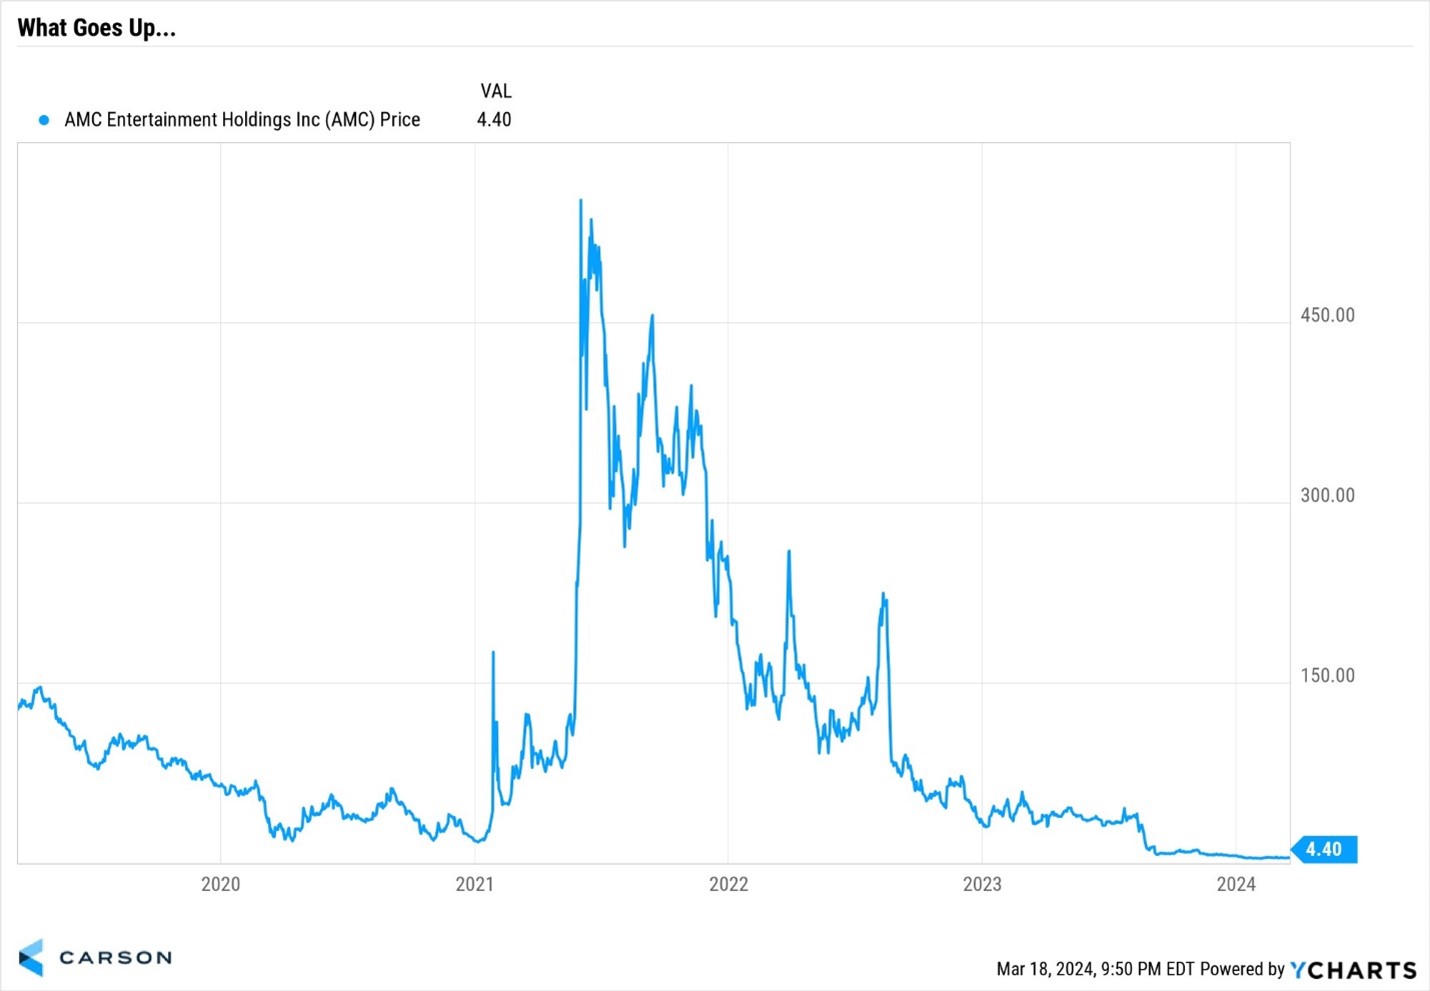
Is the Mag 7 a bubble? Many really smart people are saying this, but let’s not forget that these companies are making money, a lot of money. How many companies in the late 1990s soared simply because they added “dot com” to their names? Trust me, it was a lot. More recently the meme stock craze of 2021 stands out as a bubble. Many of those stocks had very little value, poor earnings potential, weak future growth along with headwinds to growth, yet traders pushed them up to astronomical levels. Sure enough, many of them have come all the way back to earth. Here’s AMC for a perfect example.
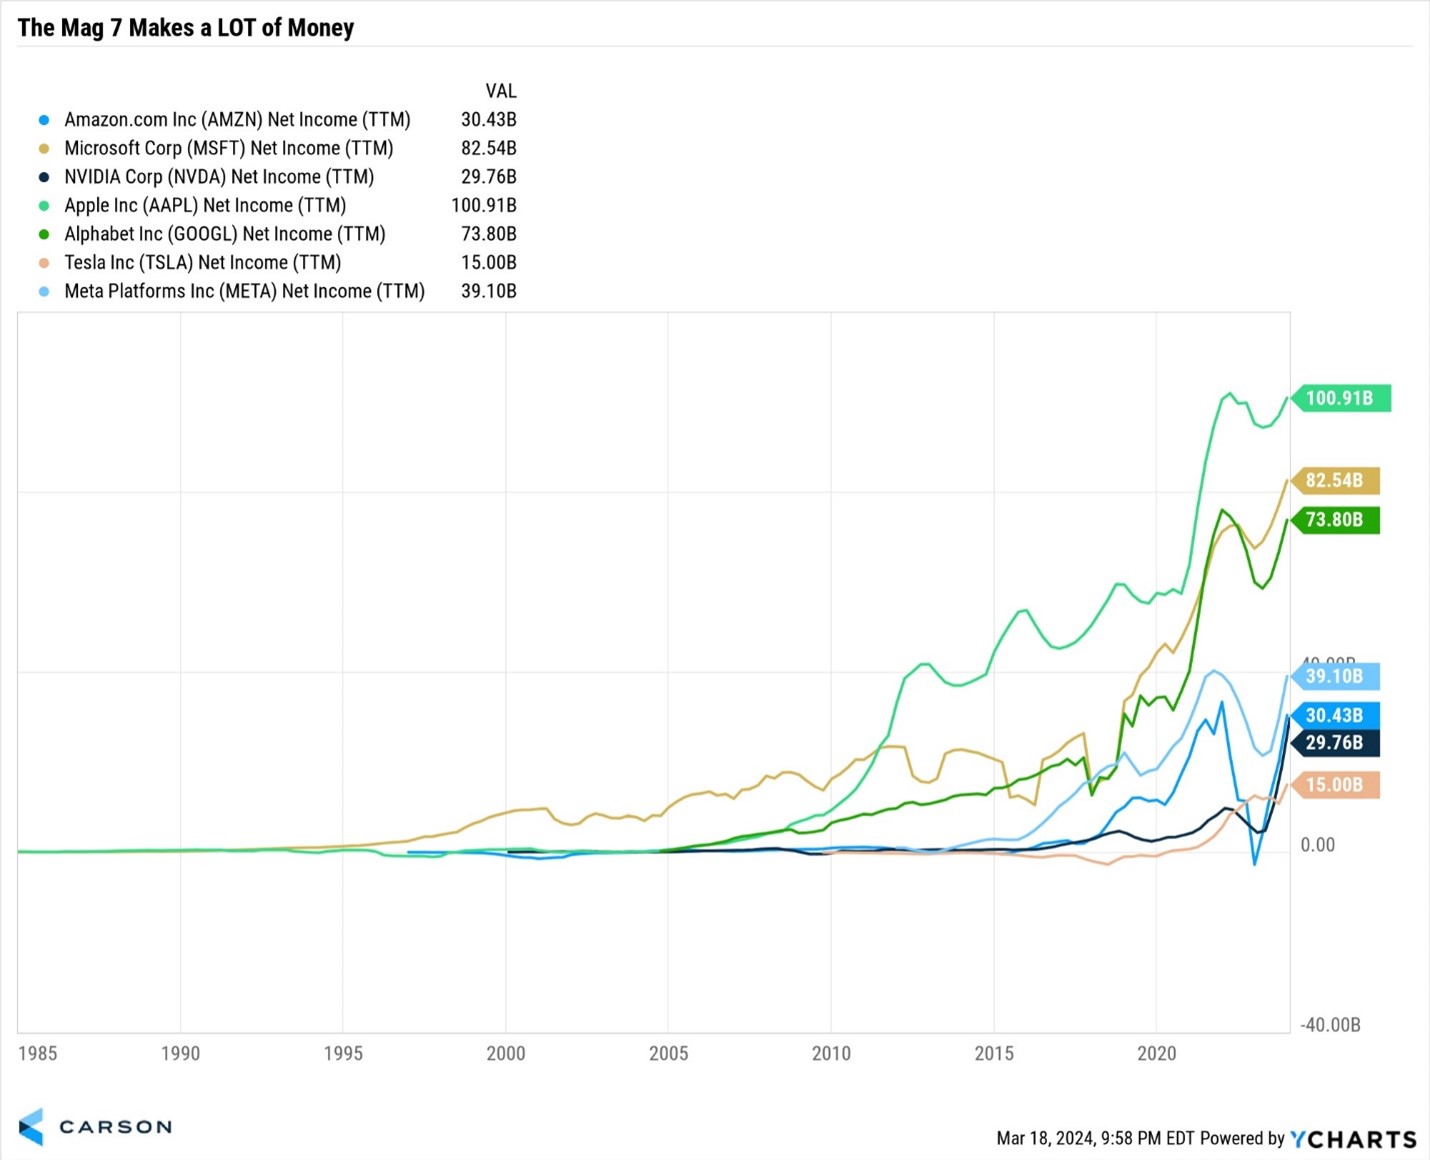
Back to the Mag 7 for a second. Amazon now sends you medicine and Apple is practically a bank with Apple Pay. In the past, a railroad stock was just a railroad stock, but that really isn’t the case anymore with these large companies. I will end it with a look at how much money these companies are making. They make a lot of money. A LOT OF MONEY.
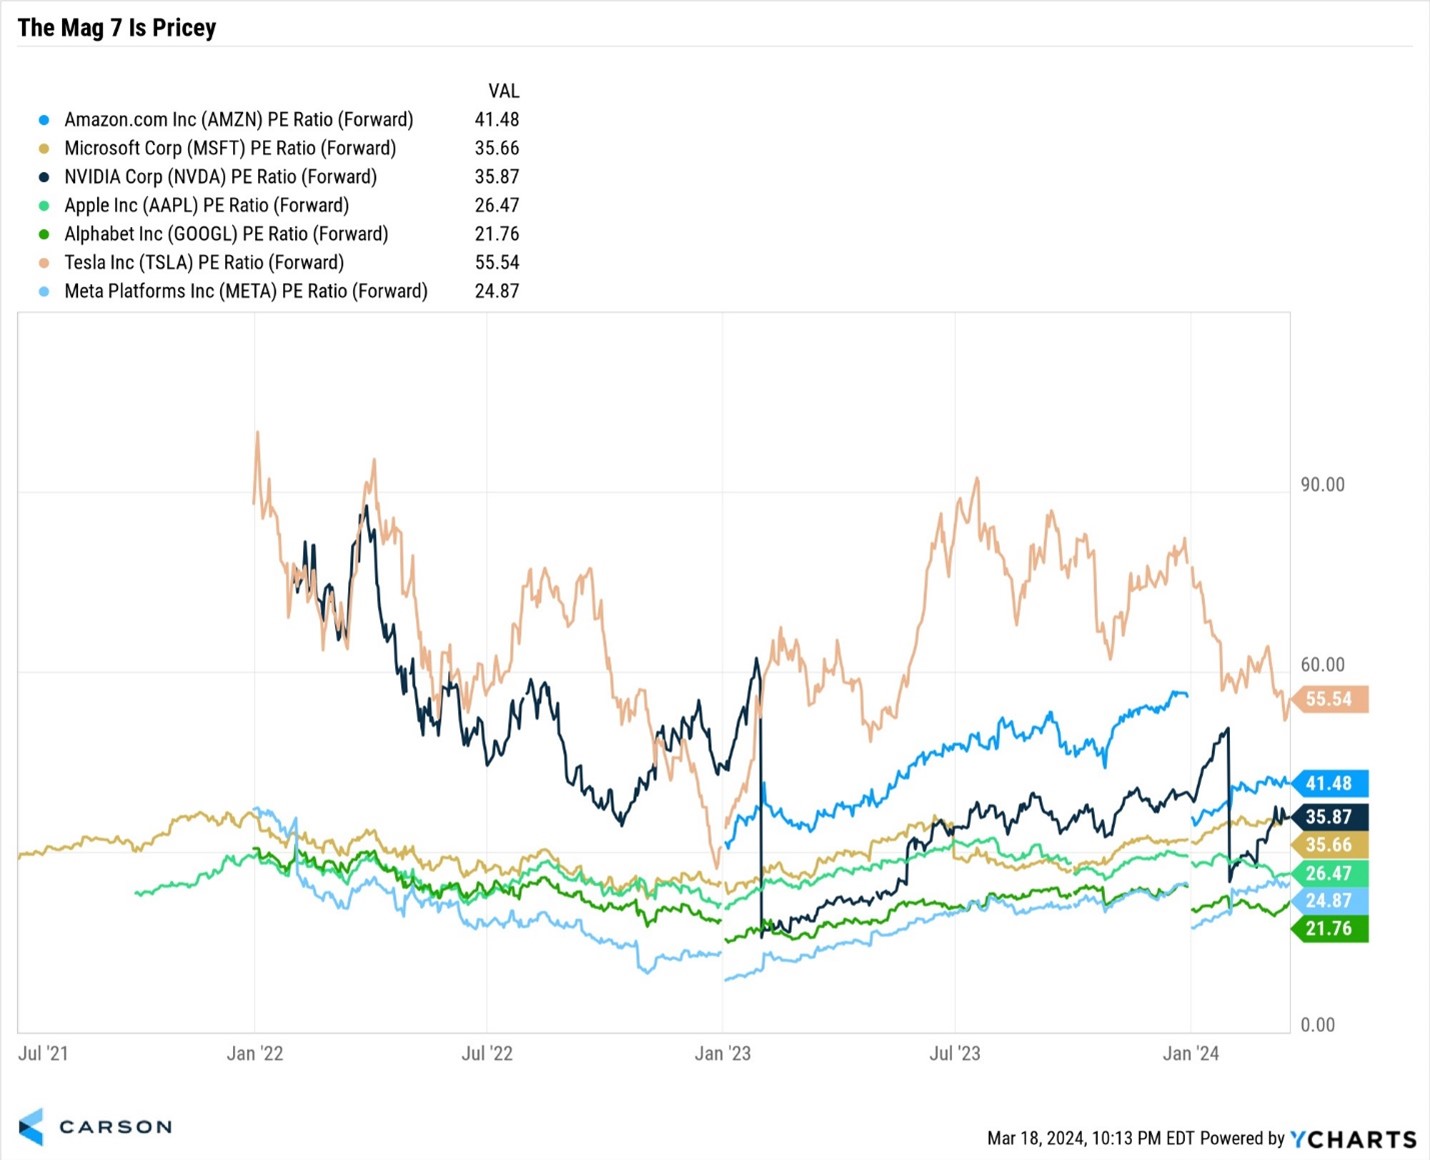
Here are price/earnings (p/e) ratios on the Mag 7. I’m old enough to remember the late 1990s and how p/e ratios in the 100s were normal, at least until they weren’t. P/E ratios in the 30s, 40s, and 50s are indeed pricey, but, in my opinion, to say this is a bubble is a bit much.
Is the stock market over in a bubble? Some pockets are quite pricey, but overall we don’t see signs of a bubble. Small caps aren’t even at all-time highs (and are historically cheap relative to large caps) and the Nasdaq is practically flat since November of 2021. That doesn’t exactly scream stocks have gone too far, does it?
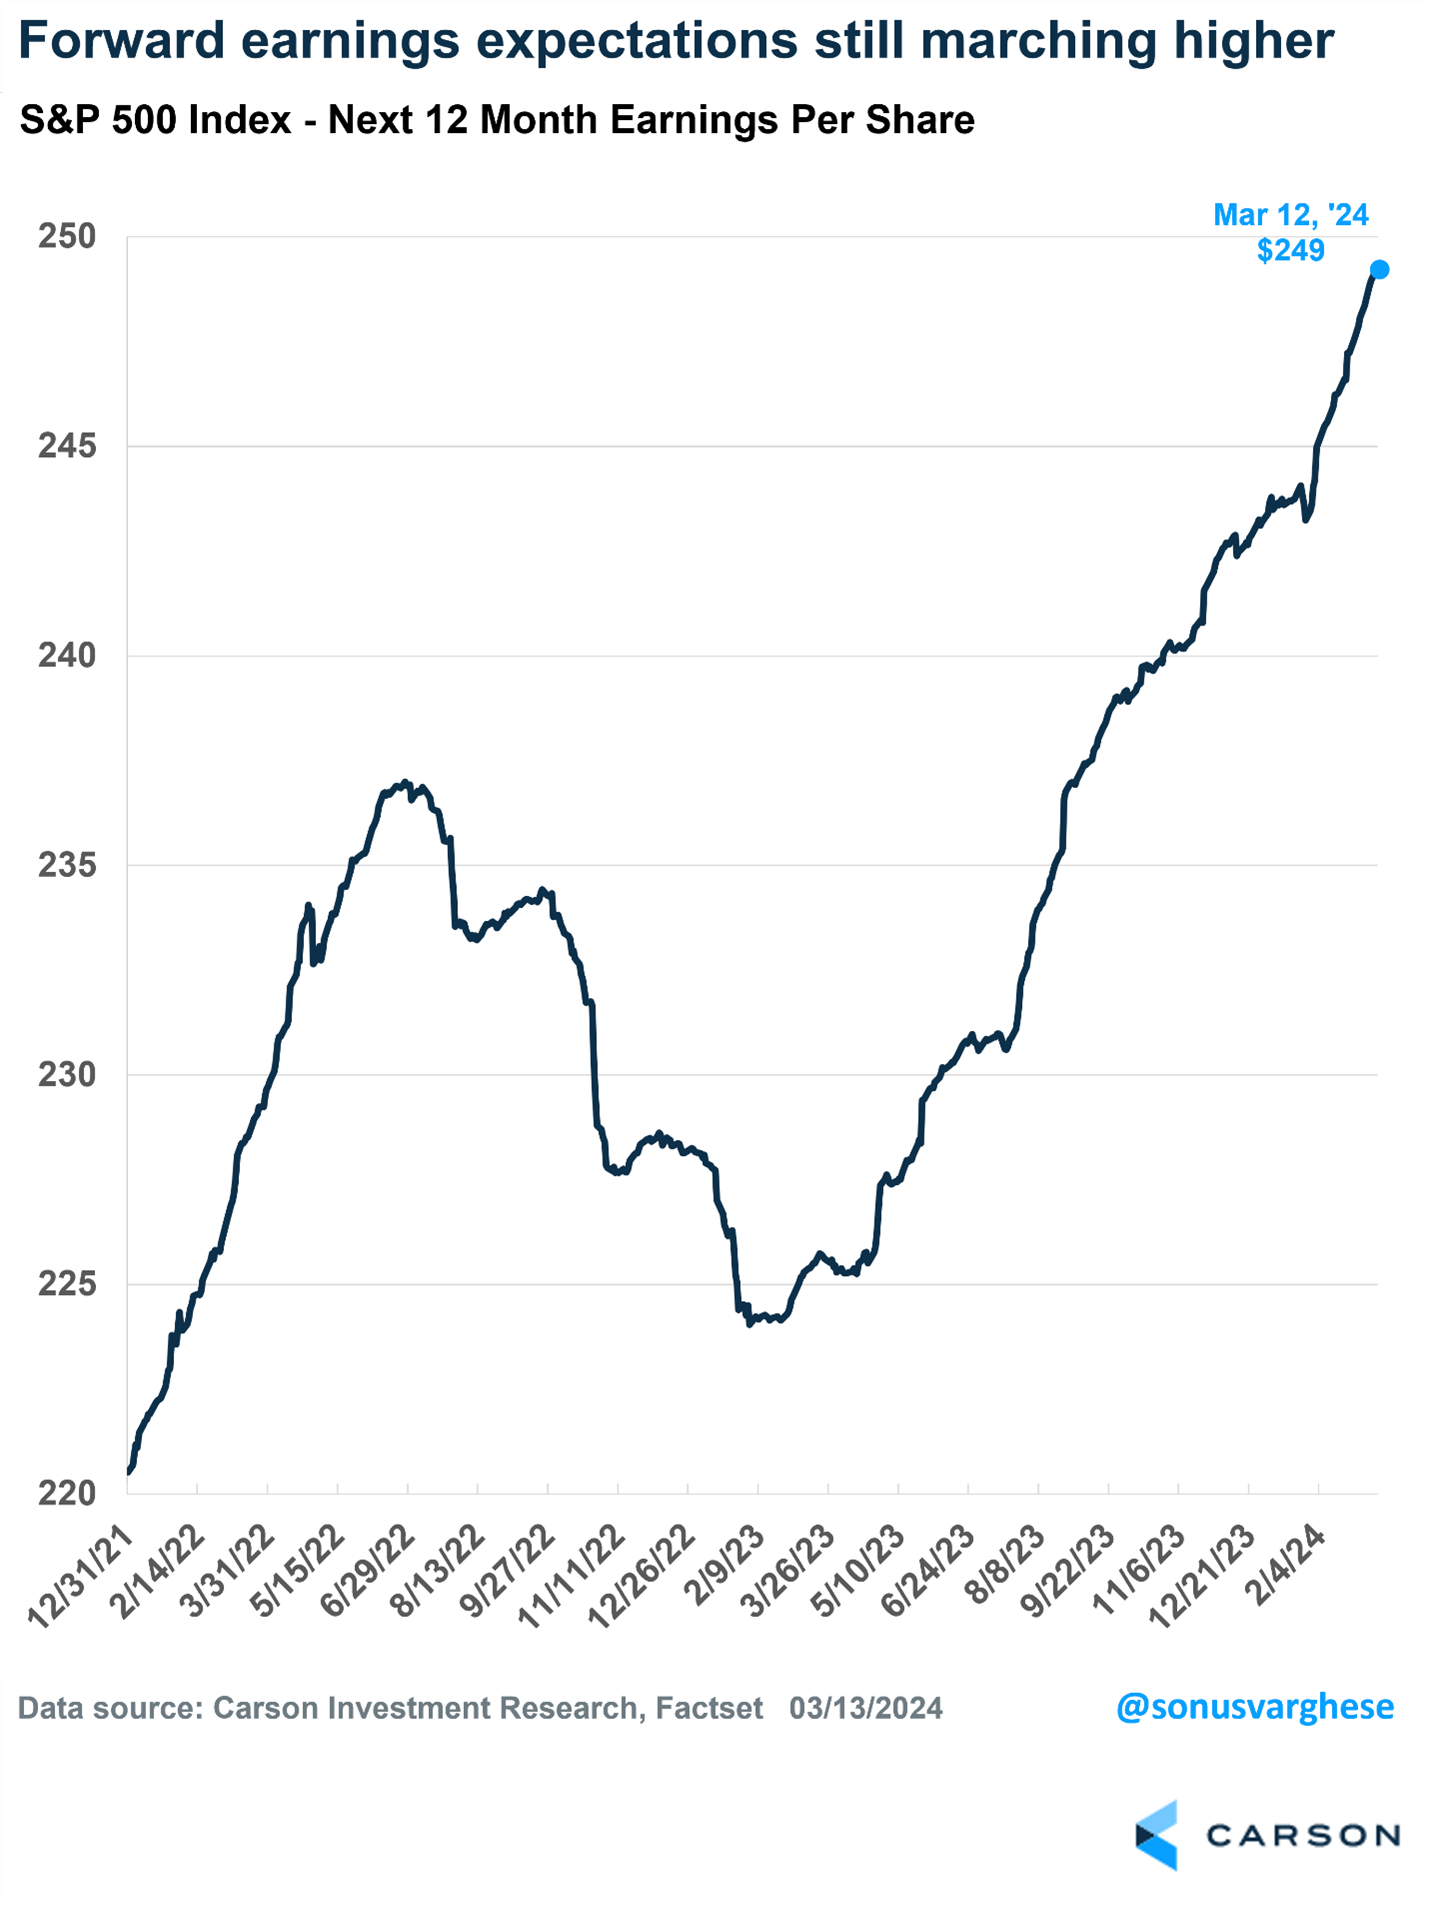
We’ve been overweight equities since December of 2021 and we comfortably remain there. One of the main reasons is earnings are really strong. In fact, forward 12 month S&P 500 earnings hit another record recently. Incredibly, earnings estimates have jumped 2% the past six weeks. Yes, stock have soared the past six weeks, but with earnings improving we think this helps to justify things.
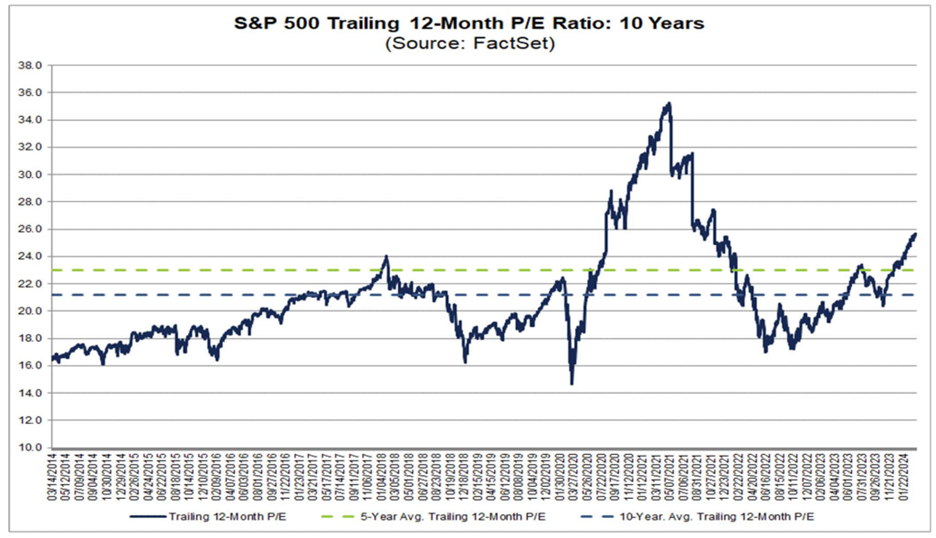
Speaking of earnings, the trailing 12-month p/e ratio for the S&P 500 is about 26 versus the five year average of 23 and 10 year average of 21. Yes, stocks are a bit pricey, but by no means historically out of line. Then if you remove tech stocks from the equation, it is estimated those numbers drop another 3 points approximately, putting most stocks right in line with historical averages.
One of the big reasons many claim this is a bubble is because earnings last year were barely positive, while stocks soared, implying it was all multiple expansion. As American football analyst Lee Corso would say, “not so fast my friends.”
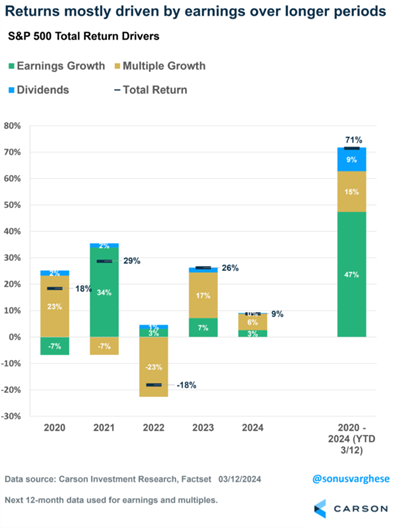
Going back to the end of 2019 though last week, the S&P 500 gained 71%. Not bad given two bear markets took place over this time. But where did those 71 points come from? Before I go there, returns can come from three places, earnings growth, multiple growth, and dividends.
Breaking things down like this we found the 71% gain was:
- 47% earnings growth
- 15% multiple expansion
- 9% dividends
In other words, that bubble came from mainly earnings and dividends. Not quite the story that loud guy on X told you, huh?
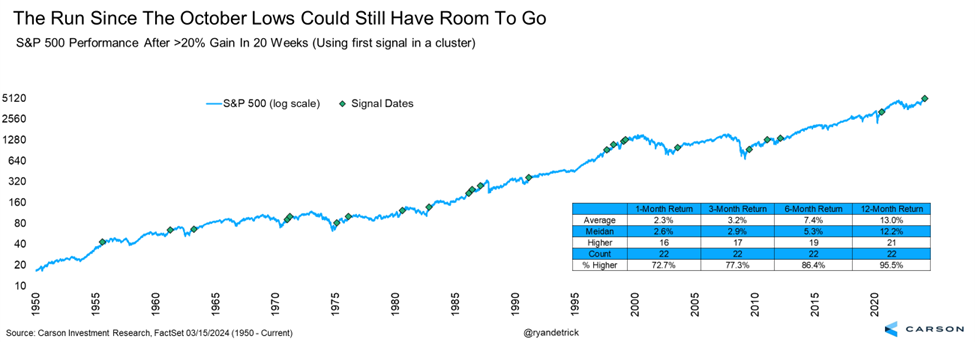
I will leave you with this. Here are two recent studies that suggest the continued path for stocks is indeed higher. The past 20 weeks the S&P 500 was up 24%, which is one of the best 20-week rallies in history. I found 22 other times stocks gained more than 20% in 20 weeks and a year later stocks were higher 21 times. In other words, this strength off of the late October lows is actually consistent with the beginning of longer-term market strength, not the end of bull markets.
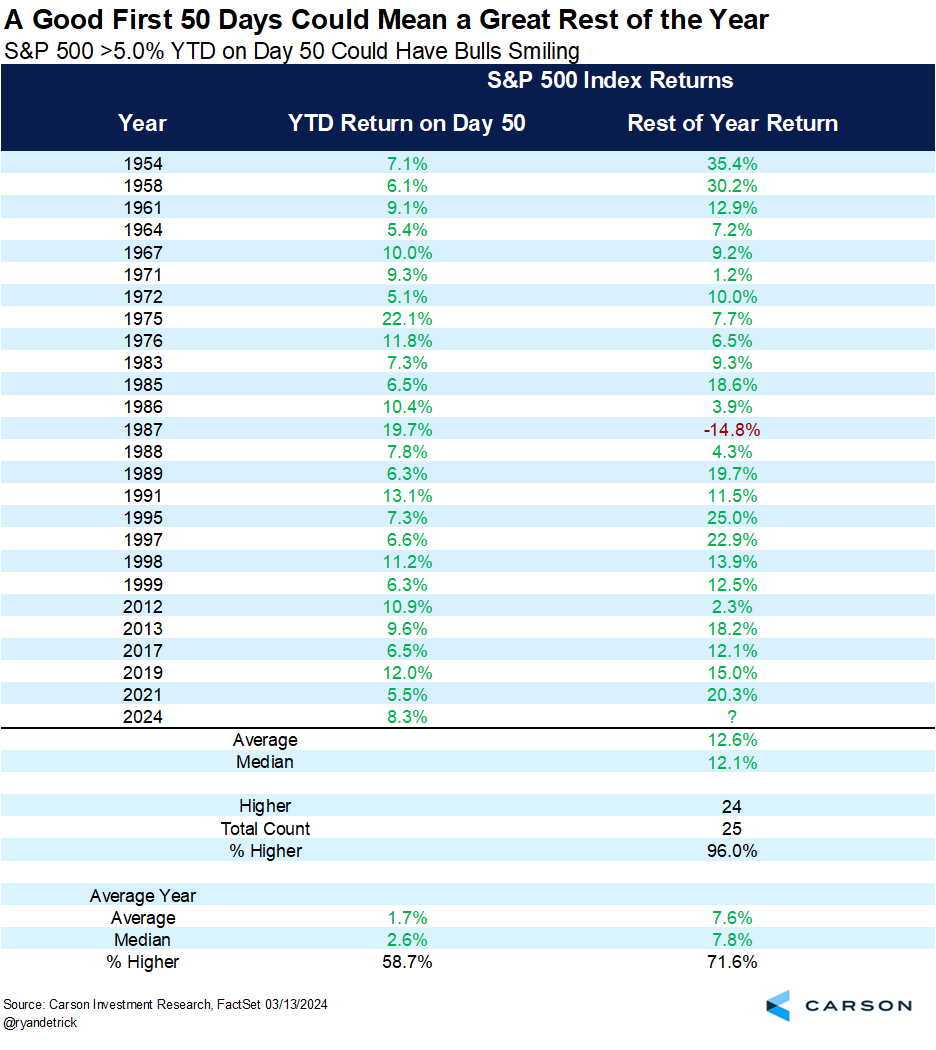
Lastly, it has been a great start to 2024, with the S&P 500 up 8.3% as of the 50th trading day of the year (which was last Wednesday). We found 25 other times stocks were up at least 5% on day 50 and the rest of the year (so about 200 trading days) was up an incredible 24 times and up 12.6% on average the rest of the year versus the average return of 7.6%.
VP, Global Macro Strategist Sonu Varghese and I got to chat with Cliff Asness, Managing and Founding Principal at AQR Capital Management, recently and the topic of bubbles came up (a pet peeve of his is overuse of the term bubble). Take a listen:
For more content by Ryan Detrick, Chief Market Strategist click here.
02162859-0324-A
