
Everyone’s been complaining that the market lacks breadth, and now we have more of it. On October 22, 324 of 500 S&P 500 companies gained, with the median stock up 1.09% (177 gained over 2%). Yet the S&P 500 fell 1.36%, technology plunged 3.3%, and the Goldman Sachs Broad AI Index dropped 6.01%. Nine of 11 sectors beat the index, and six gained, led by defensives: staples, utilities, and health care.
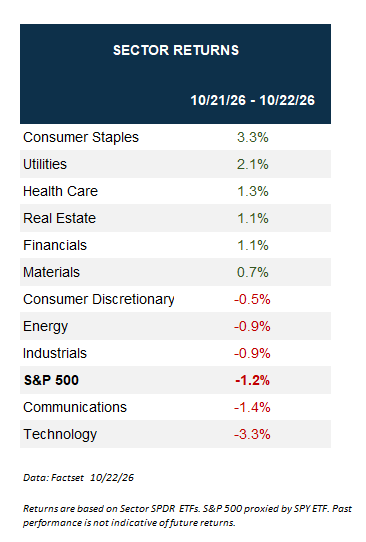
That captures the problem. More breadth is great, except when it is led by defensives and comes with a steep selloff in AI stocks. Be careful what you wish for when you have a concentrated index and a bull market powered largely by AI.
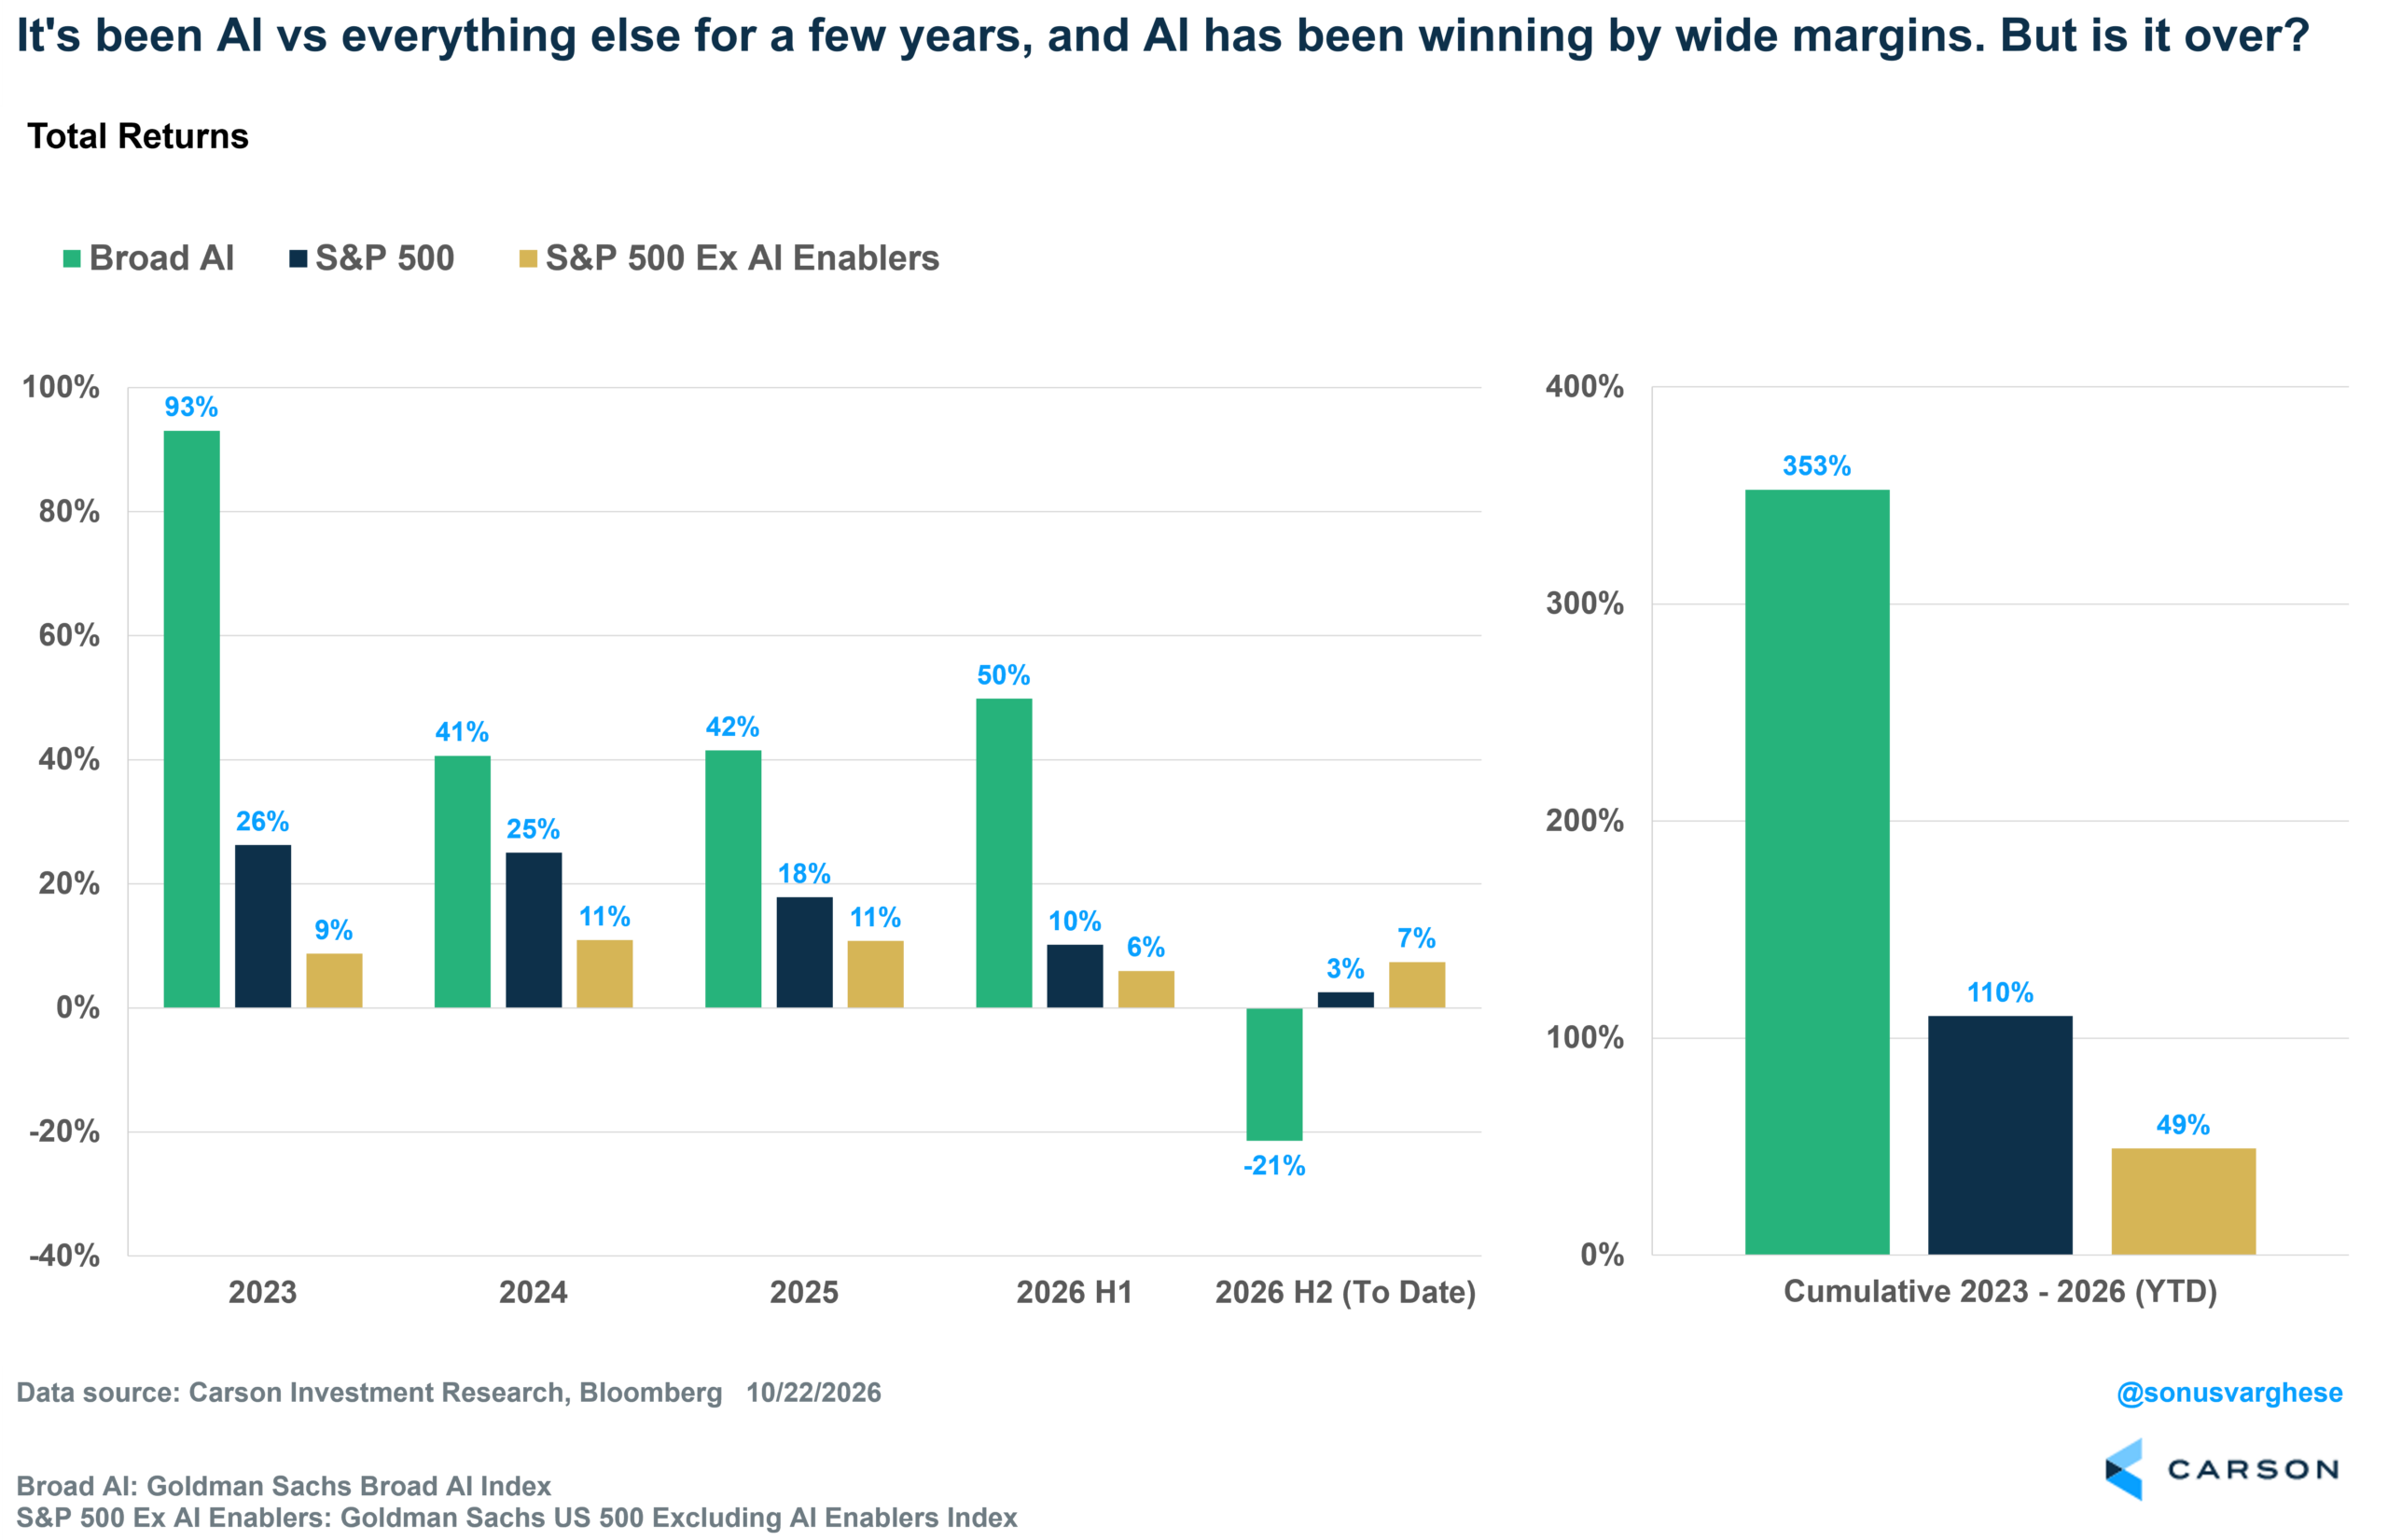
I’ve shared this chart before comparing AI stocks (Goldman Sachs Broad AI Index), the S&P 500, and non-AI stocks (Goldman Sachs S&P 500 Ex AI Enablers Index). AI trounced everything from 2023 through the first half of 2026. But that flipped in the second half: through October 22, non-AI stocks outperformed AI by over 28 percentage points. There’s still an enormous gap to close. Since the end of 2022, AI is up 353%, versus 49% for non-AI stocks (a respectable 11.1% annualized). The S&P 500 is up 110%, powered by AI.
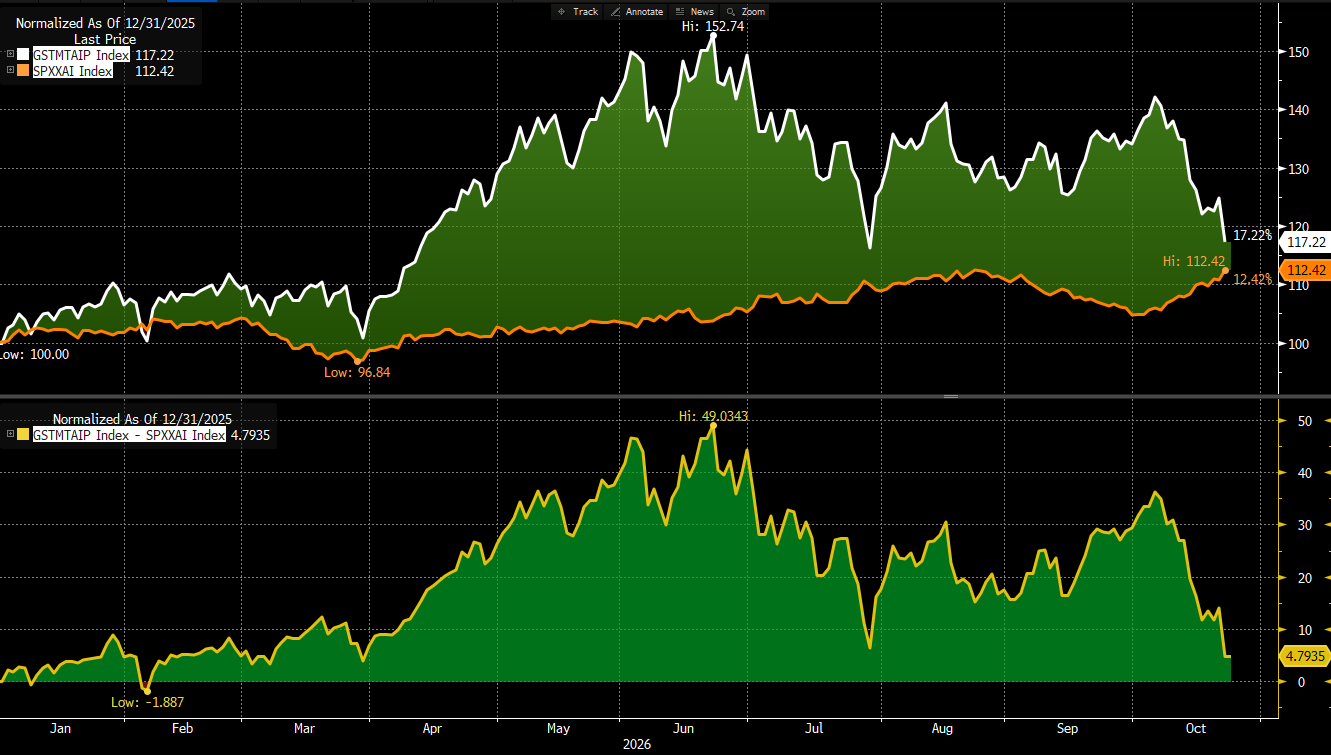
The Tape Doesn’t Look Good
On June 22, AI was outperforming non-AI stocks by a whopping 49 percentage points for the year. That lead has collapsed to just 4.8 points.
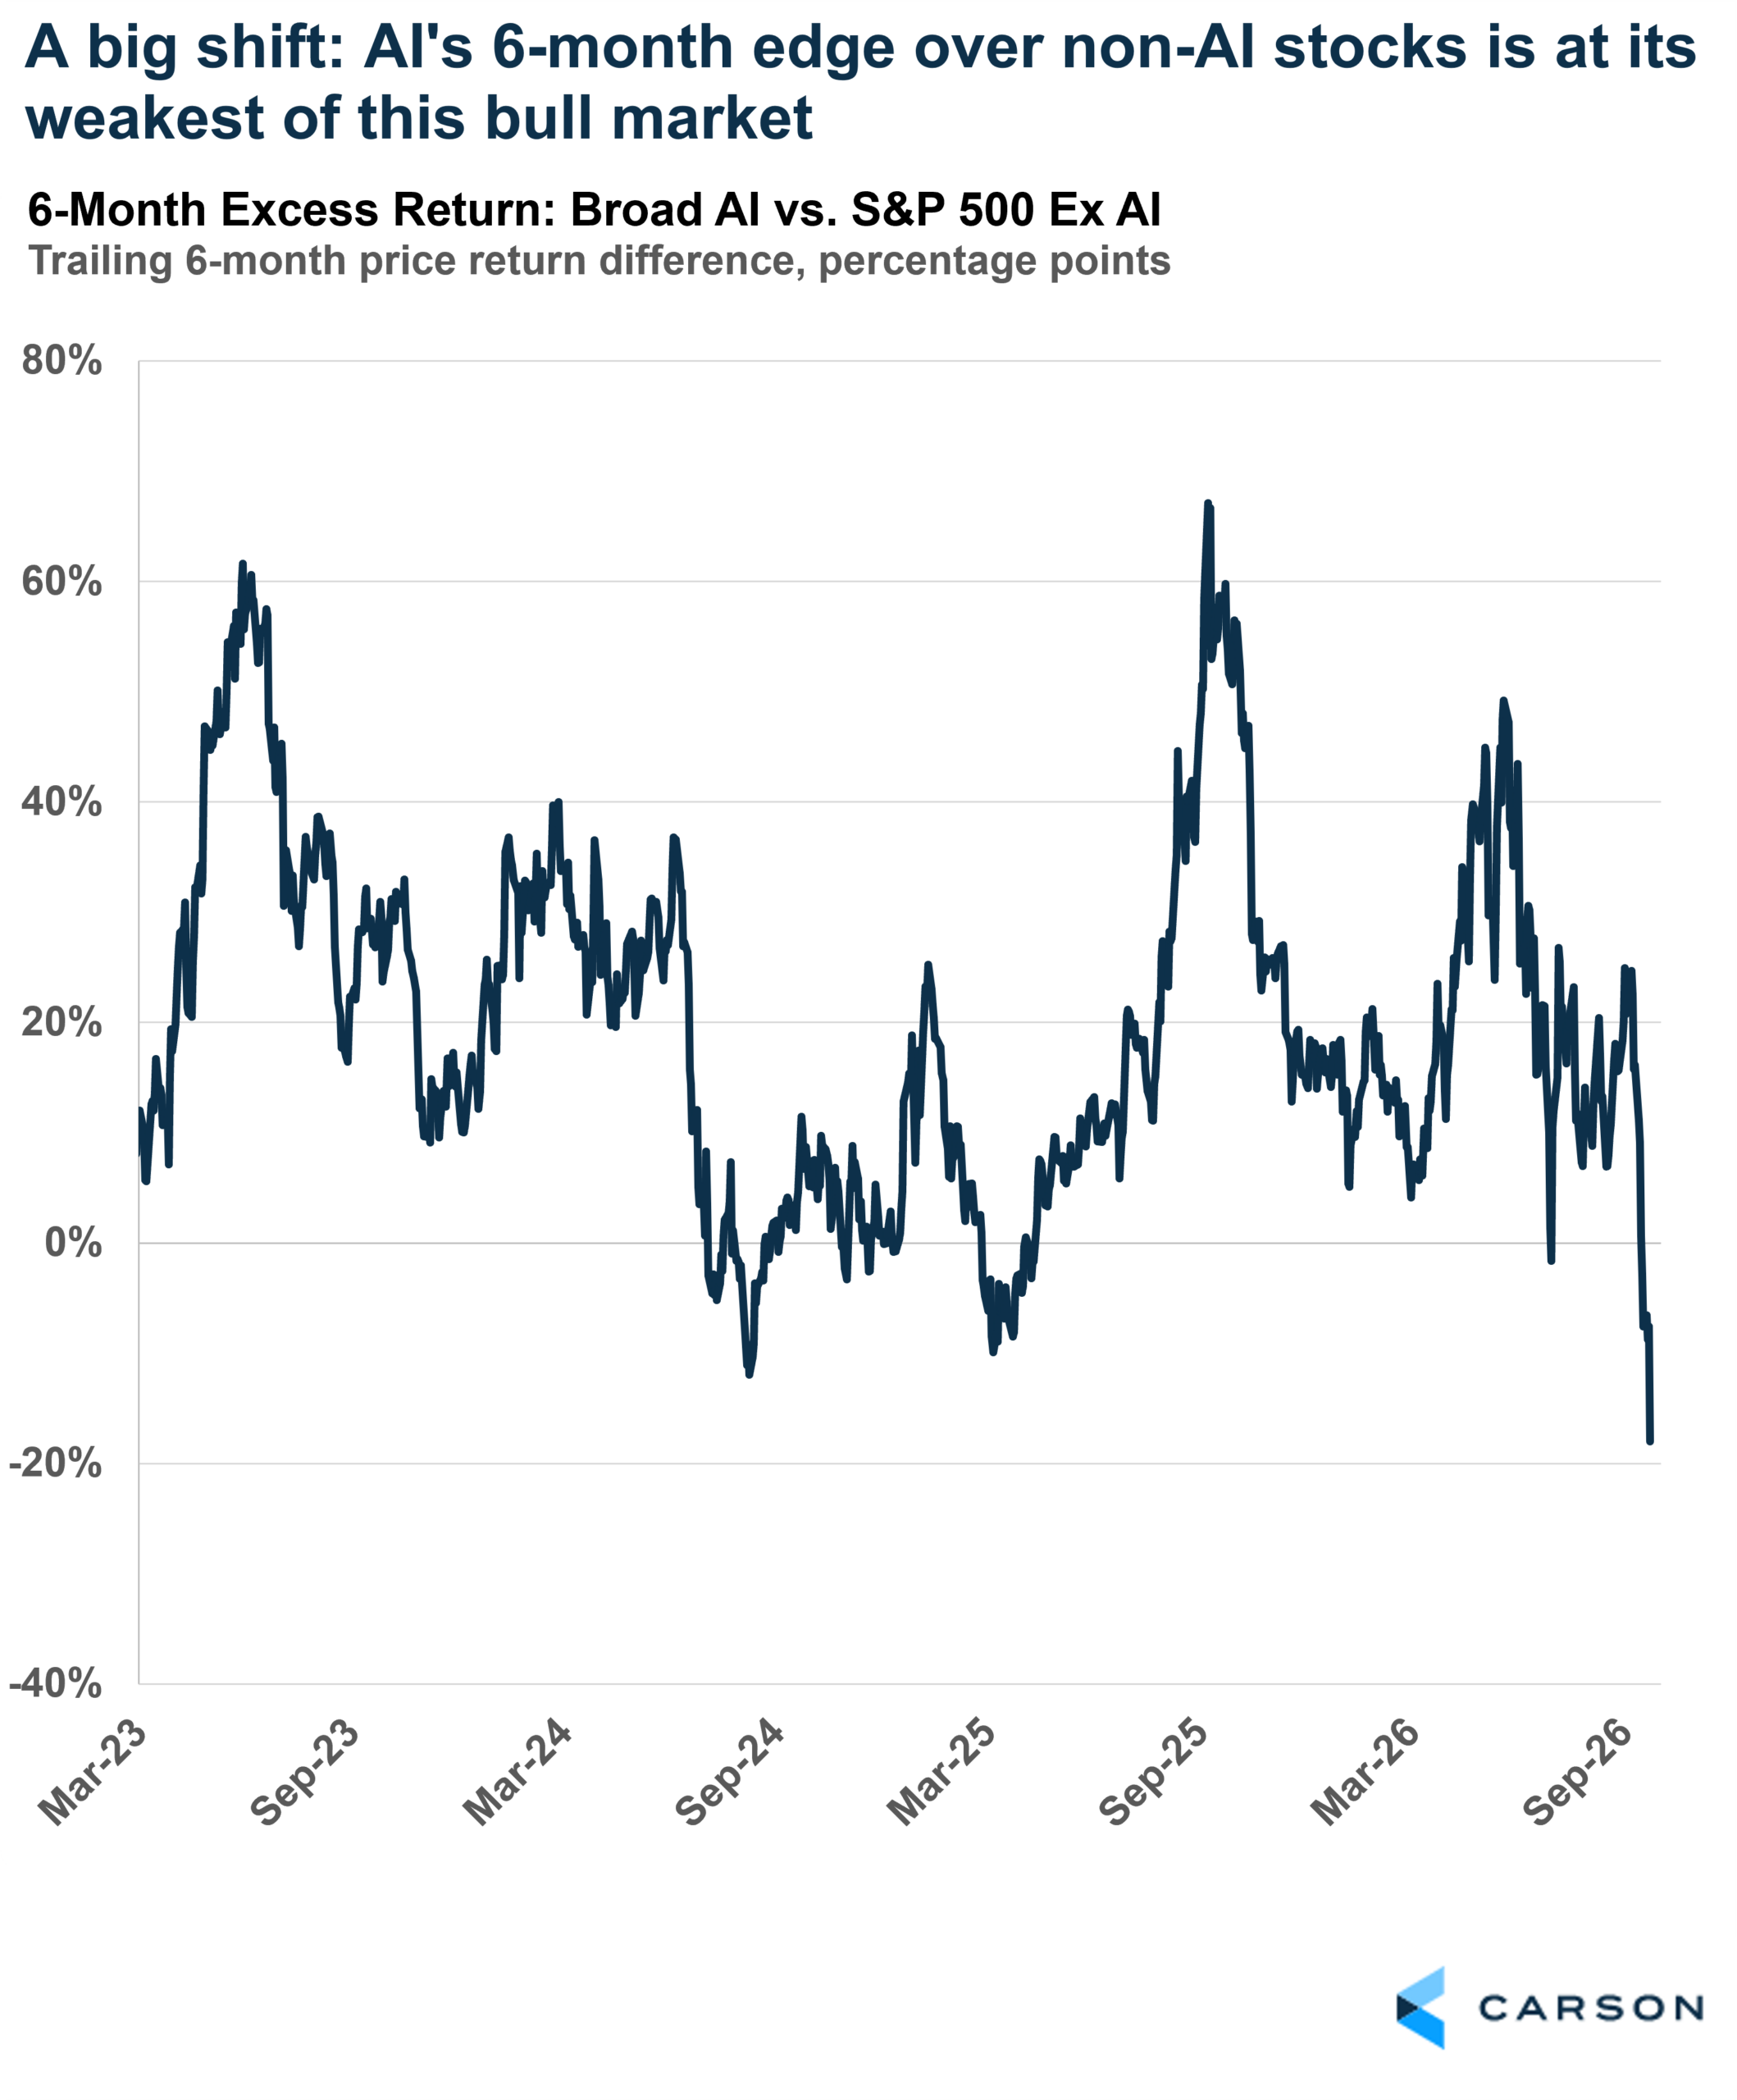
It’s one thing for non-AI stocks to lead for a week or month, but this reversal has lasted longer. The chart below shows AI’s rolling six-month excess return over non-AI stocks since 2023. It’s now at its worst level of this four-year bull market.
Something seems to have shifted.
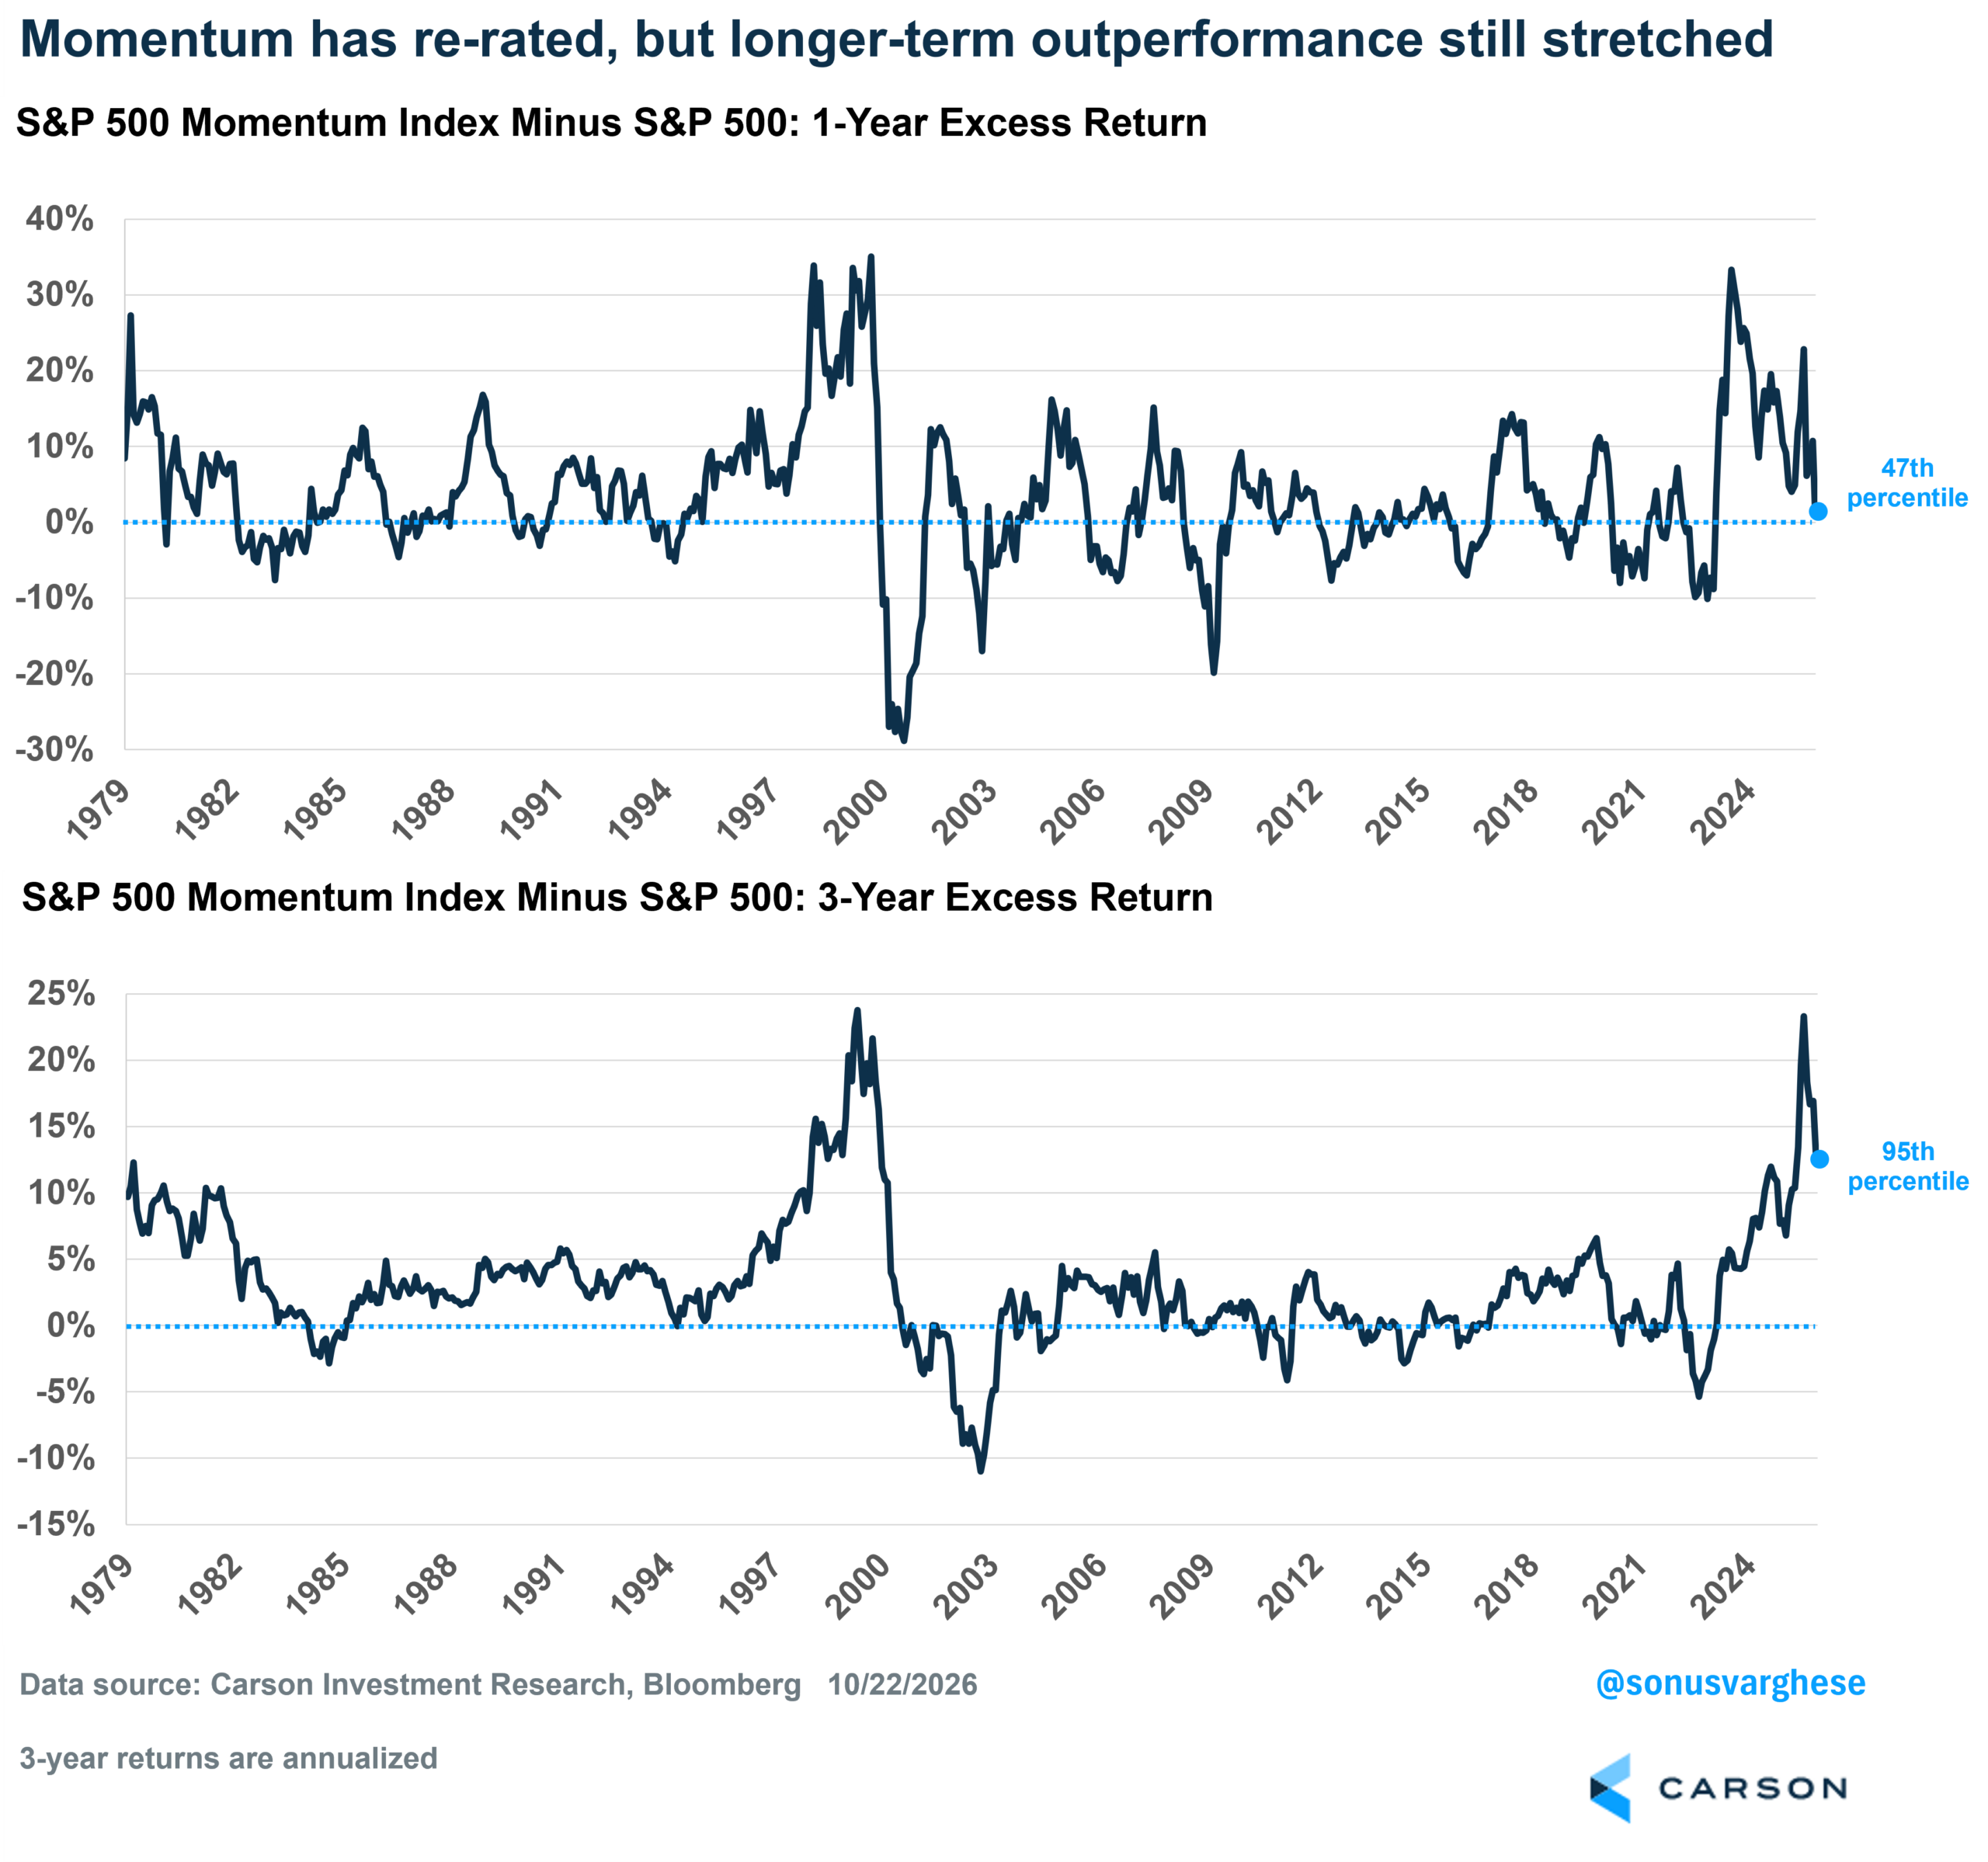
Back in June, I pointed out that AI stocks were far outpacing everything else, lifting momentum stocks with them. At the end of June, momentum looked really stretched:
- The S&P 500 Momentum Index’s one-year excess return was in the 96th percentile of the last 40 years.
- It’s now fallen to the 47th percentile.
But longer-term momentum is still pretty stretched:
- In June, momentum’s three-year excess return was in the 100th percentile of the last 40 years.
- It’s still in the 95th percentile.
In other words, there’s a long way to go before three-year excess performance gets back to the median, let alone below that.
Concentration Is a Problem
My colleague, Grant Engelbart, VP, Strategy Investment Strategy & Research, recently wrote about the volatility hidden beneath the headline index. The S&P 500 hasn’t had a 10% correction this year, yet the median stock has suffered a drawdown exceeding 24%. Concentration helped on the way up as AI surged, and boosted index performance. It can hurt just as much in reverse.
Technology alone is 38% of the S&P 500. Add Alphabet, Meta, Amazon, and Tesla (all tied to the AI story but officially part of other sectors) and you get 51%. And that doesn’t include AI-linked industrials and utilities.

Stay on Top of Market Trends
The Carson Investment Research newsletter offers up-to-date market news, analysis and insights. Subscribe today!
"*" indicates required fields
Let’s put some numbers here.
From January 1, 2024 to September 30, 2026, the S&P 500 gained about 66%. I’m excluding 2023 since that was arguably a recovery from the 2022 bear market. Here’s the breakdown:
- A basket of 47 AI stocks contributed 40%-points (60% of the return)
- Their average index weight was just 33%.
- The remaining 67% of the index contributed 26 points (40% of the return)
- The Magnificent 7, making up 32% of the index, contributed 30 points (46% of the return).
- Note: Five of the Magnificent 7 are in the AI basket (Apple and Tesla aren’t)
The concentration was even more stark in the first half of 2026, when the S&P 500 returned 10.2%:
- The AI basket contributed 7.6 points, or 75% of the return.
- Its average index weight was 37%.
- The other 63% contributed just 2.6 points, or 25% of the return.
- The Magnificent 7 were 33% of the index but contributed almost nothing.
Then things reversed big time in the second half. Of the S&P 500’s 2.5% gain through October 22:
- The AI basket, now 39% of the index, subtracted 1.7 percentage points.
- Non-AI stocks contributed 4.2 points, more than offsetting the AI drag.
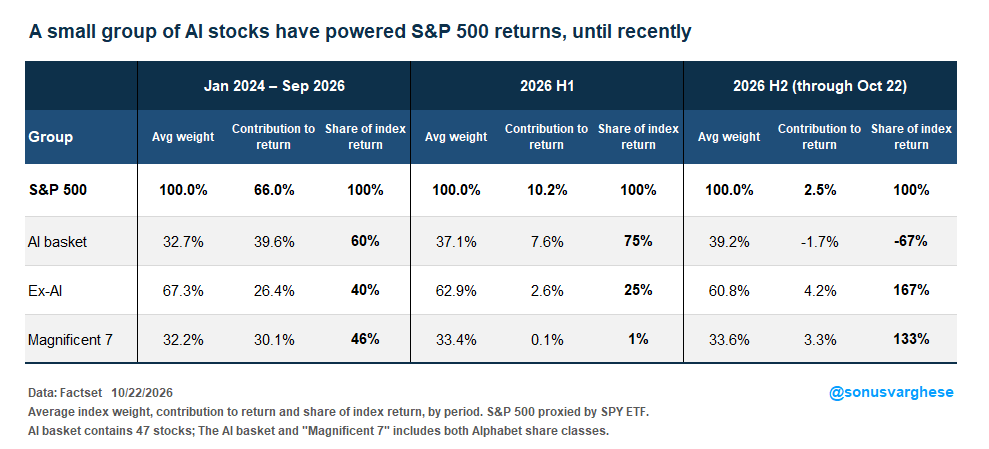
The trouble is that years of outperformance have made AI stocks an increasingly large share of the index. A significant reversal would therefore hit the S&P 500 disproportionately hard.
Rotation & Breadth: Be Careful What You Wish For
At the end of June I wrote about getting comfortable with a ”bubble”, arguing that diversification may be the secret to investing through it. That’s played out faster than I expected. The current selloff may not last, but if this rotation persists, it could signal the end of the AI wave and the bull market.
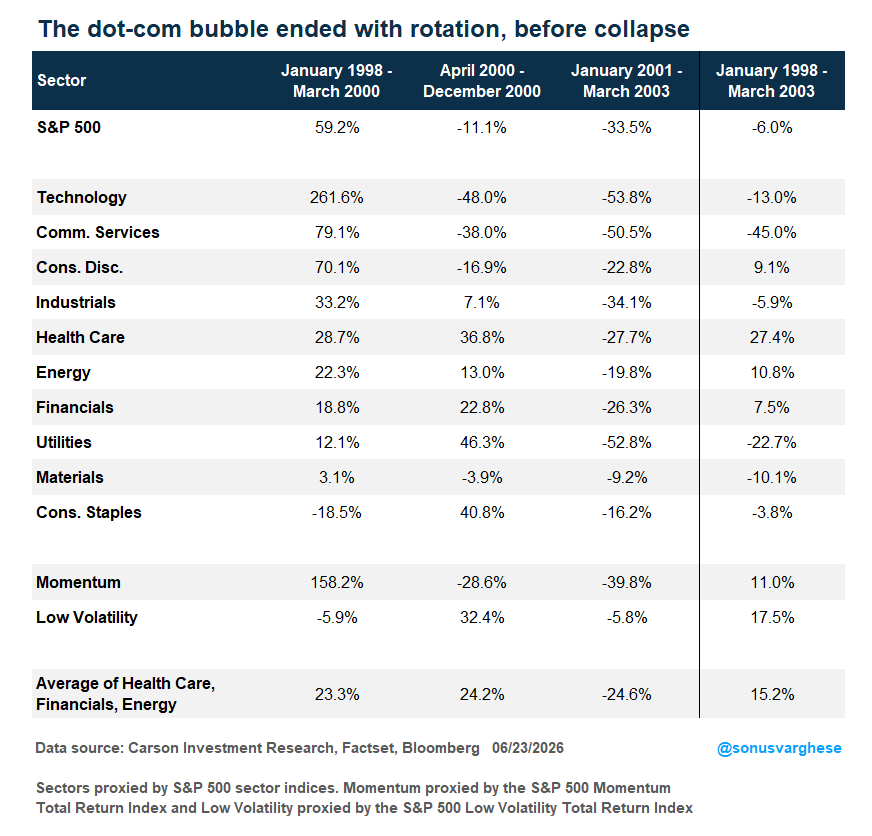
Rotation is also how the late 1990s tech bubble ended, along with an 18-year bull market. I looked at sector returns, momentum, and low volatility factors (both long-only) across three periods:
- January 1998 – March 2000 (the bubble)
- April 2000 – December 2000 (rotation)
- January 2001 – March 2003 (the crash)
A few things stand out:
- Technology and momentum soared during the bubble, alongside tech-adjacent communications and consumer discretionary, then collapsed afterward.
- But there was breadth during the bubble. Most other sectors generated solid returns; only staples and low volatility were negative.
- From April 2000 through December 2000, there was a lot of rotation, as tech-adjacent sectors and momentum sank while most other sectors and low volatility gained.
- During the 2001–03 crash, every sector took a beating, especially tech and momentum.
- Across the full period, what’s interesting is that health care, energy, financials, and even consumer discretionary posted positive returns. Momentum finished positive despite brutal drawdowns, but low volatility did better, as did an equal-weighted mix of health care, financials, and energy.
All this to say, things could get a lot uglier. We’ve barely scratched the surface of a tech selloff. I can make a solid macro case for AI to keep running, driven by more capex and profit growth. But in this business, you have to weigh that against the message from the market, and right now, the tape for AI doesn’t look good. If this continues, it could mean the end of the bull market as well. As I wrote in my prior blog, it’s still AI or bust. Perhaps now more than ever, it’s important to keep an eye on the tape.
For more content by Sonu Varghese, Chief Macro Strategist, click here.
9198589.1. – 23OCT26A