One of the hardest things to do as an investor is to look forward rather than look backward, which is why having a long-term plan is always so important. Still, there’s a lot we can learn about looking backwards if we’re focused on what it means for what comes next. Sometimes, that means going with the trend, but sometimes it means being contrarian and patient. Here are a few observations about first quarter performance that might hold some clues about what comes next.
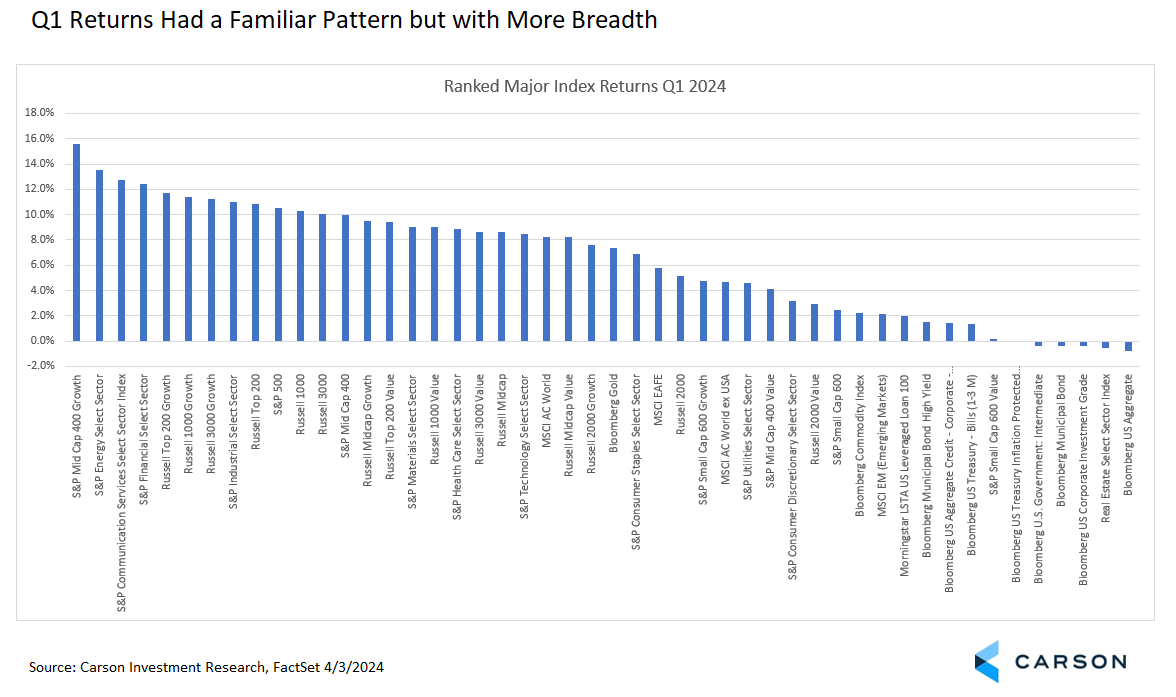
First, while some themes persisted over the quarter, there was more breadth and the story was clearly no longer about a handful of large cap technology-oriented stocks. A broadening market was a theme in our 2024 Outlook and we expect that theme to continue. Yes, growth still outperformed value, the US led international, and stocks were much better than bonds. But these stood out for us when looking back at Q1 performance:
- Mid-cap growth stocks led among the 48 major indexes we track
- The technology sector underperformed the S&P 500
- Cyclical sectors like financials, industrials, and energy were among the outperformers.
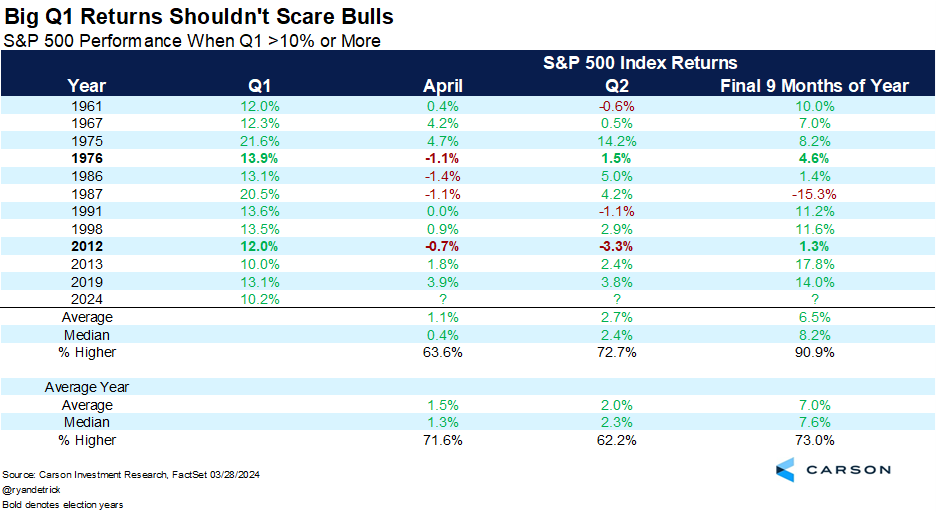
Second, the S&P 500 just had two consecutive quarters with double digit gains (more then 10%). See my colleague and Carson’s Chief Market Strategist, Ryan Detrick’s excellent blog from yesterday on what that has meant historically going forward. The basic takeaway: Returns over the next quarter have been above average and slightly below average over the rest of the year but still solid and consistently higher. After all, a little consolidation would be reasonable and even healthy after such a strong stretch and you can’t have blowout quarters forever. But there’s nothing at all in general to be scared of just from two quarters of strong gains. To the contrary, as Ryan puts it, it should have the bulls smiling.
Third, yes, bonds did have another negative quarter. But it’s important to keep in mind that even during normal times bonds do have some risk. Since inception in 1976, the Bloomberg US Aggregate Bond Index (“Agg”) has been negative 24% of the time. That’s better than the S&P 500 over the same period (32% of the time on a price return basis), but roughly in the same territory. (Keep in mind that bonds still have much less volatility.) Part of this was likely some mean reversion after the Agg had its 11th best quarter ever in Q4 2023. Obviously, bonds are off to a rough start so far in Q2 just a couple of days in, but a higher coupon to offset losses, lower rate sensitivity than at its peak, and a Federal Reserve that is very likely done raising rates and likely to start cutting this year all help cap the downside. We don’t think this is a restart of 2022’s Bondageddon. To the contrary, we would actually be on the lookout for opportunities, even if we still strongly favor stocks over bonds.
Two minor pieces of consolation on bonds. First, the Agg is still positive on a four-quarter rolling basis, although it underperformed short-term Treasuries over that period. Second, for the first quarter at least, bonds were uncorrelated with stocks, although not in the way that’s important. It was an above average quarter for the S&P 500, but a below average quarter for the Agg. The five-year rolling quarterly correlation between intermediate Treasuries and the S&P 500 is still near 0 and almost identical with its long-term average (although that will change when 2020 rolls off).
Fourth, let’s look at the sector picture. Energy was in the top 3 or bottom 3 sectors for the 17th consecutive quarter. Granted, there are only 11 sectors, but the odds of that happening are still infinitesimal all else equal. Of those 17 quarters, 10 are in the top 3 and 7 are in the bottom 3. It’s good to keep in mind energy stocks go their own way and can be subject to big swings in relative performance.
Also on the sector front, both utilities and consumer staples underperformed the S&P 500 for the fifth consecutive quarter, including the third quarter of 2023 when the S&P 500 was down. Our sector history doesn’t go back far (just 2011), but in that time period it ties the longest quarterly streak of underperformance for utilities and is one quarter short for staples. We still favor cyclicals due to the favorable economic outlook, but it’s another signal that a short stretch of outperformance by defensives would be normal and would not be a warning sign to change course more broadly in itself.
Stay on Top of Market Trends
The Carson Investment Research newsletter offers up-to-date market news, analysis and insights. Subscribe today!
"*" indicates required fields
Finally, let’s talk growth and value. After getting beaten up badly in 2022, growth stocks have come back with a vengeance and the Russell 1000 Growth Index has outperformed the Russell 1000 Value Index for the fifth consecutive quarter. Outperformance was large the first two quarters of last year and has moderated since. That five quarter streak is not that special. From Q1 2017 to Q3 2020 growth outperformed 14 out of 15 quarters with two streaks of seven consecutive quarters. Despite strong value outperformance in 2022, growth has been on a 10-year tear relative to value that is even larger than the peak of the tech bubble at the end of the first quarter of 2000. Growth had outperformed by 5.64% annualized over the prior 10 years then. Now it’s 7.0%, only slightly lower than the peak of 7.3% at the end of the third quarter in 2020.
Our view? There have been structural changes to the economy that make growth and value look different than they were 25 years ago (although value did have one really nice extended stretch of outperformance since then). There are also some accounting challenges in dealing with technological investment that may distort some measure of value. “Value” itself is an odd category, since it includes some of the least economically sensitive stocks (for example, utilities) and some of the most economically sensitive (potentially over-discounted “deep value” cyclicals). But the principle of value is enduring. It’s better to invest in something when it’s cheap than when it’s expensive. It just can be challenging to have the right measure of when something is cheap or expensive.
We like to think of value more in terms of three different areas:
- Overly discounted cyclicals
- Low volatility stocks, and
- Quality stocks based on characteristics like earnings stability and strong balance sheets.
These aren’t necessarily going to correspond to traditional value categories, although there will be meaningful crossover, and each still has its merits. There’s also another category of businesses that are bid down because of technological transitions, which can be a source of “value traps” in an environment where technology is evolving ever more rapidly. Those may be stocks to avoid. We don’t think value is dead. It’s just a question of what kind of value you’re talking about. We still favor value, from the factor perspective above, over a strategic time frame, but tactically, we are more sensitive to more recent trends and are neutral style.
For another perspective on how different investors have varying ideas of what constitutes “value”, take a listen to Ryan and Sonu on their latest Facts vs Feelings podcast episode, in which they chat with ARK Investment’s Chief Investment Officer, Cathie Wood. Cathie and her team have a very contrarian view on which parts of the market are currently undervalued right now.
For more content by Barry Gilbert, VP, Asset Allocation Strategist click here.
02184800-0424-A