
“When the facts change, I change my mind. What do you do, sir?” John Maynard Keynes
Stocks are off to a roaring start to 2023, which has many claiming this is just a bear market rally and one that will likely end with new lows. Carson Investment Research has quietly been taking the other side to these vocal bears, saying many times that October was likely the end of the bear market and that better times were potentially in the cards. In fact, we upgraded our view on equities to overweight from neutral in late December and added equity risk to the models we run for our Partners as a result.
Two big reasons for our optimism are that we don’t see a recession this year, and everyone is bearish. Regarding the macro outlook, last week’s 517k jobs number does little to change our stance. Additionally, I’ve done this for a long time, and I’ve never quite seen everyone as bearish as they were late last year. Remember, the crowd is rarely right, as we discussed in Is Anyone Bullish?
The S&P 500 is up 17% from the October lows, the same magnitude as the 17% rally we saw last summer. Back then, stocks rolled back over and made new lows, something most strategists on tv are saying will happen again.
Well, the facts are changing for us, and as Keynes told us in the quote above, we had better change our minds as well. So here are five clues that this rally is on firmer footing and will likely continue.
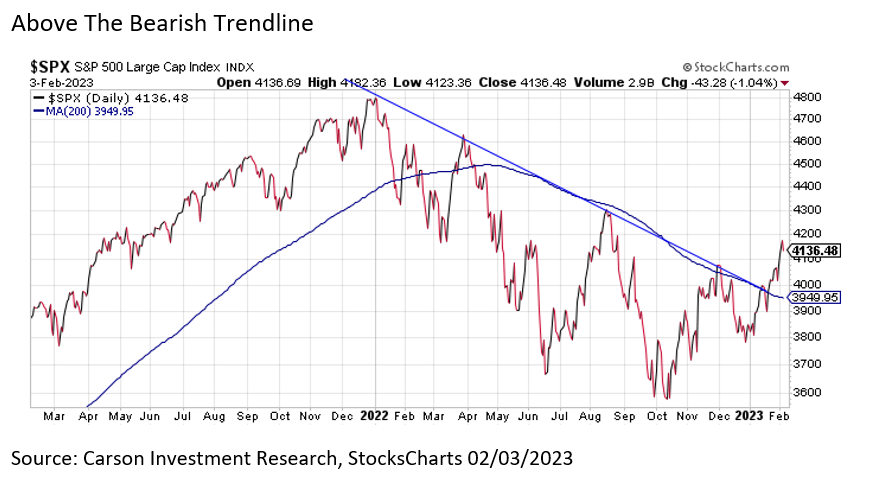
The Trendline
The S&P 500 finally broke above the bearish trendline from 2022. As you can see below, each time this trendline was touched, stocks sold off, usually hard. However, this time, stocks broke above the trendline and accelerated higher, a clear change in trend. Not to mention, the S&P 500 also moved significantly above the 200-day moving average, which clues that the trend has changed.
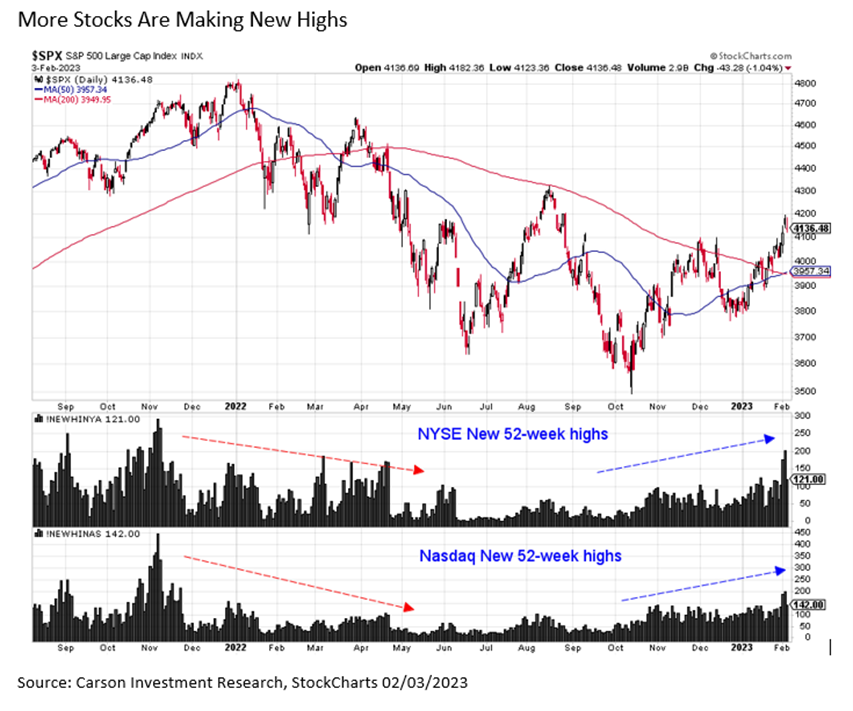
More stocks are going up.
Even though the S&P 500 is still more than 10% away from a new all-time high, we are seeing more and more stocks making new 52-week highs, yet another sign that this rally, indeed, is different. As you can see below, the first part of last year saw less and less stocks making new highs, a potential warning sign under the surface. Well, today is near 180, with more and more stocks breaking out to the upside. With more stocks strong, the likelihood that the overall indexes follow is potentially quite high.
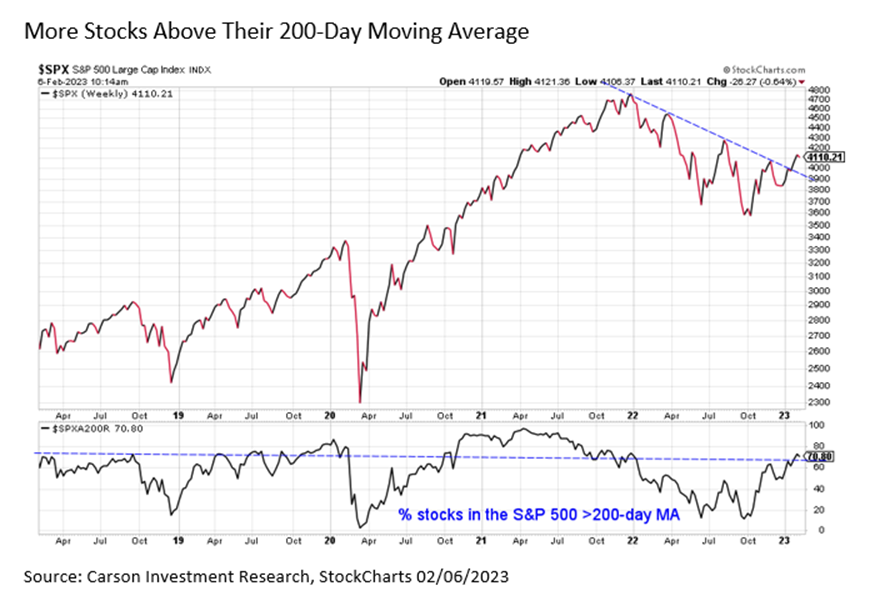
Wider breadth and participation
Another clue that more and more stocks are trending higher is that more than 70% of the stocks in the S&P 500 are above their 200-day moving average. This is the most since 2021; in other words, more participation than any time we saw last year. As the chart below shows, when this gets above 65%, it signals a potential shift to a stronger trending market. For example, we saw this above 65% for much of the bull market of 2021. Once this broke beneath 65% in late 2021, it was a warning sign of potential trouble brewing.
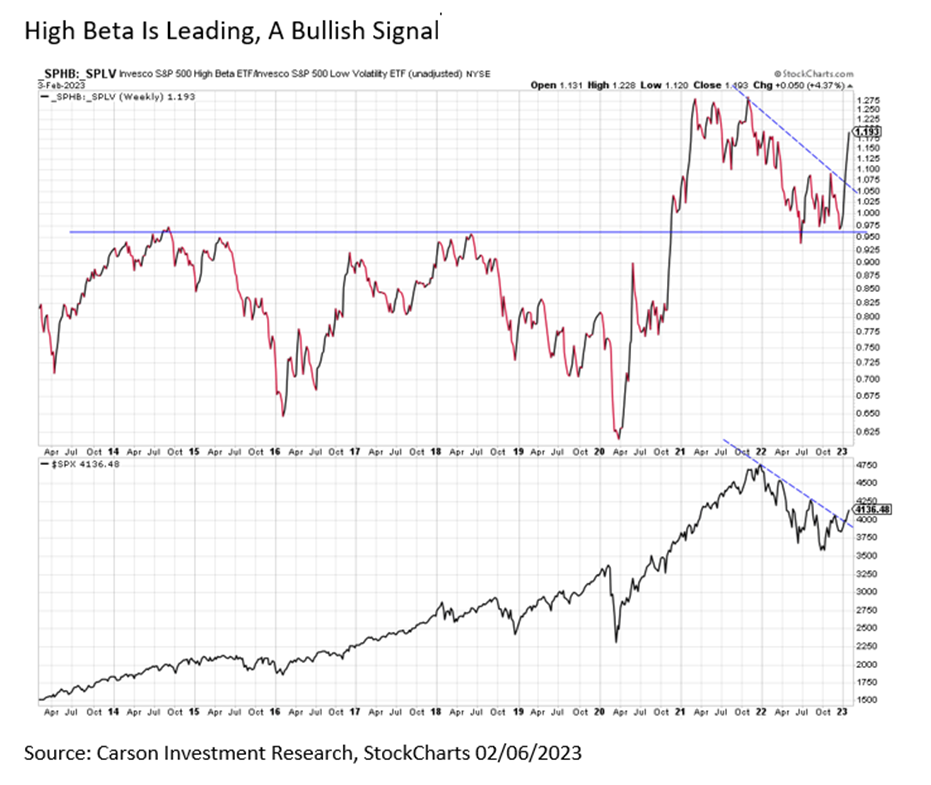
High beta is doing better.
We saw leadership from things like utilities, healthcare, and staples this time a year ago. In other words, the defensive part of the market. Today we are seeing those groups underperform, with high-beta names doing well, another clue that this rally is on better footing. So let’s sum it up like this, you don’t want the defensive stuff leading to a proper healthy bull market.
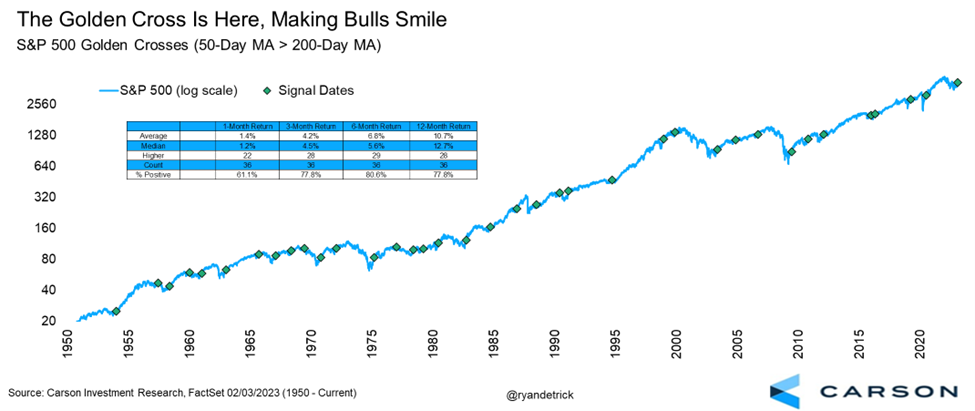
The Golden Cross
Lastly, a rare technical development took place last week on the S&P 500, as the 50-day moving average moved above the slower-trending 200-day moving average. This development is known as a “Golden Cross,” which has tended to resolve bullishly for stocks.
Since 1950, there have been 36 other Golden Crosses on the S&P 500 and the future returns have been strong, with the S&P 500 higher a year later nearly 78% of the time and up 10.7% on average, with a median return of close to 13%. The bottom line is that this is another sign that things appear to be improving more than anytime we saw last year.
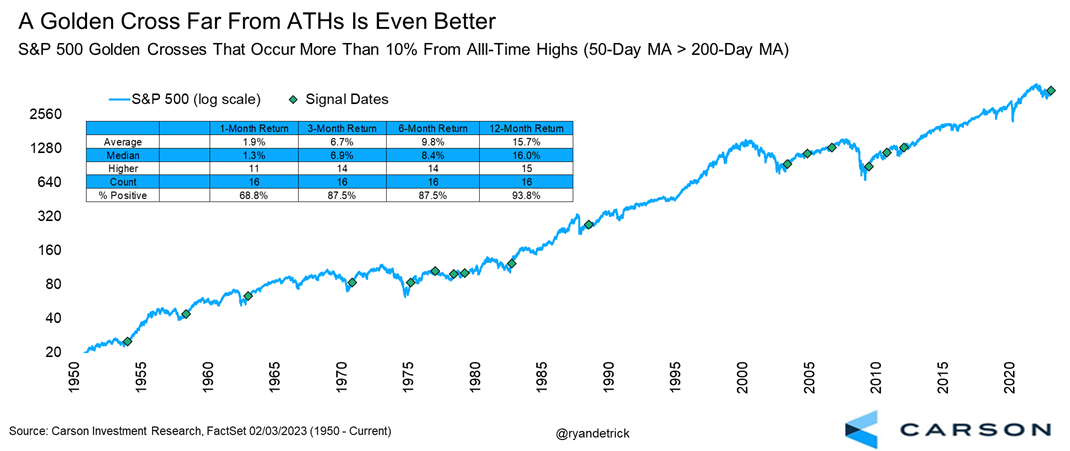
Taking it a step further, historically, this Golden Cross took place nearly 13% away from all-time highs. We looked, and when Golden Crosses happened more than 10% or more away from new highs, the future returns got better. Higher a year later, 15 out of 16 times (93.8%) and up a very solid 15.7% on average is something most bulls would likely take, I’m sure.
Let’s be clear, after this huge start to the year, and we wouldn’t be surprised at all if we saw some type of weakness or consolidation in February. That would be perfectly normal action after the run we’ve seen, but the bigger picture, we see many clues that this looks like more than a bear market rally, and continued strength in stocks in 2023 is potentially likely.
