Recession calls have increased since the Liberation Day tariff extravaganza, with most economists increasing the odds of a recession in the next 12 months quite significantly relative to odds at the beginning of the year. The Wall Street Journal’s panel of economists raised the probability of a recession in the next 12 months to 45% (it was close to 20% at the beginning of the year).

Now, 45% odds is as good as a coin toss, and for those of us focused on markets, it’s not really helpful — it’s akin to saying “we don’t know”. Now you could say that the stock market is not the economy, but at the end of the day, the stock market will be driven by profit growth and profits come from the economy, which is why it’d be useful to know whether the economy is close to, or in, a recession.
Since it’s profits that matter, one approach is to simply look at earnings. However, earnings lag. For one thing it’s the prior quarter’s data, and we get most of it only about 30-40 days after quarter end. You could look at forward earnings, based on analyst estimates, but as you can see below, that may also be too late. For example, in 2008, forward (next 12-month) earnings estimates didn’t collapse until after September (the gray shaded areas show periods of recession).

Don’t Wait on GDP To Tell You About a Recession
One thing to keep in mind is that the gray shaded areas that identify recessions in the chart above are known only well after the fact. While a typical rule of thumb is that two consecutive quarters of GDP growth is indicative of a recession, that is not how recessions are identified in the US. For one thing, GDP is released only a month after quarter end (so it lags a lot), and that’s only the first estimate. It can be revised over the next couple of months, and again over the next few years.
Case in point: the first and second quarters of 2022 saw two consecutive quarters of GDP growth as initially reported. However, as we got further revisions, real GDP growth in Q2 2022 was revised to +0.3%. Not to mention that GDP growth across those two quarters was extremely noisy and dominated by skewed net exports and inventories data, amid the post-Covid bullwhip. On the other hand, gross domestic income (GDI) was positive in Q1 2022 and negative in Q2 2022. GDI is only released 60 days after the quarter end, and so it’s even more lagging than GDP. And it can also be heavily revised.
In the US, a recession is called by a recession dating committee at the National Bureau of Economic Research (NBER). And they don’t use GDP (or GDI for that matter). THE NBER actually considers six other economic indicators, including
- Employment growth, across the establishment and household surveys
- Real consumption
- Real personal income ex government transfers
- Industrial production
- Real wholesale and retail sales
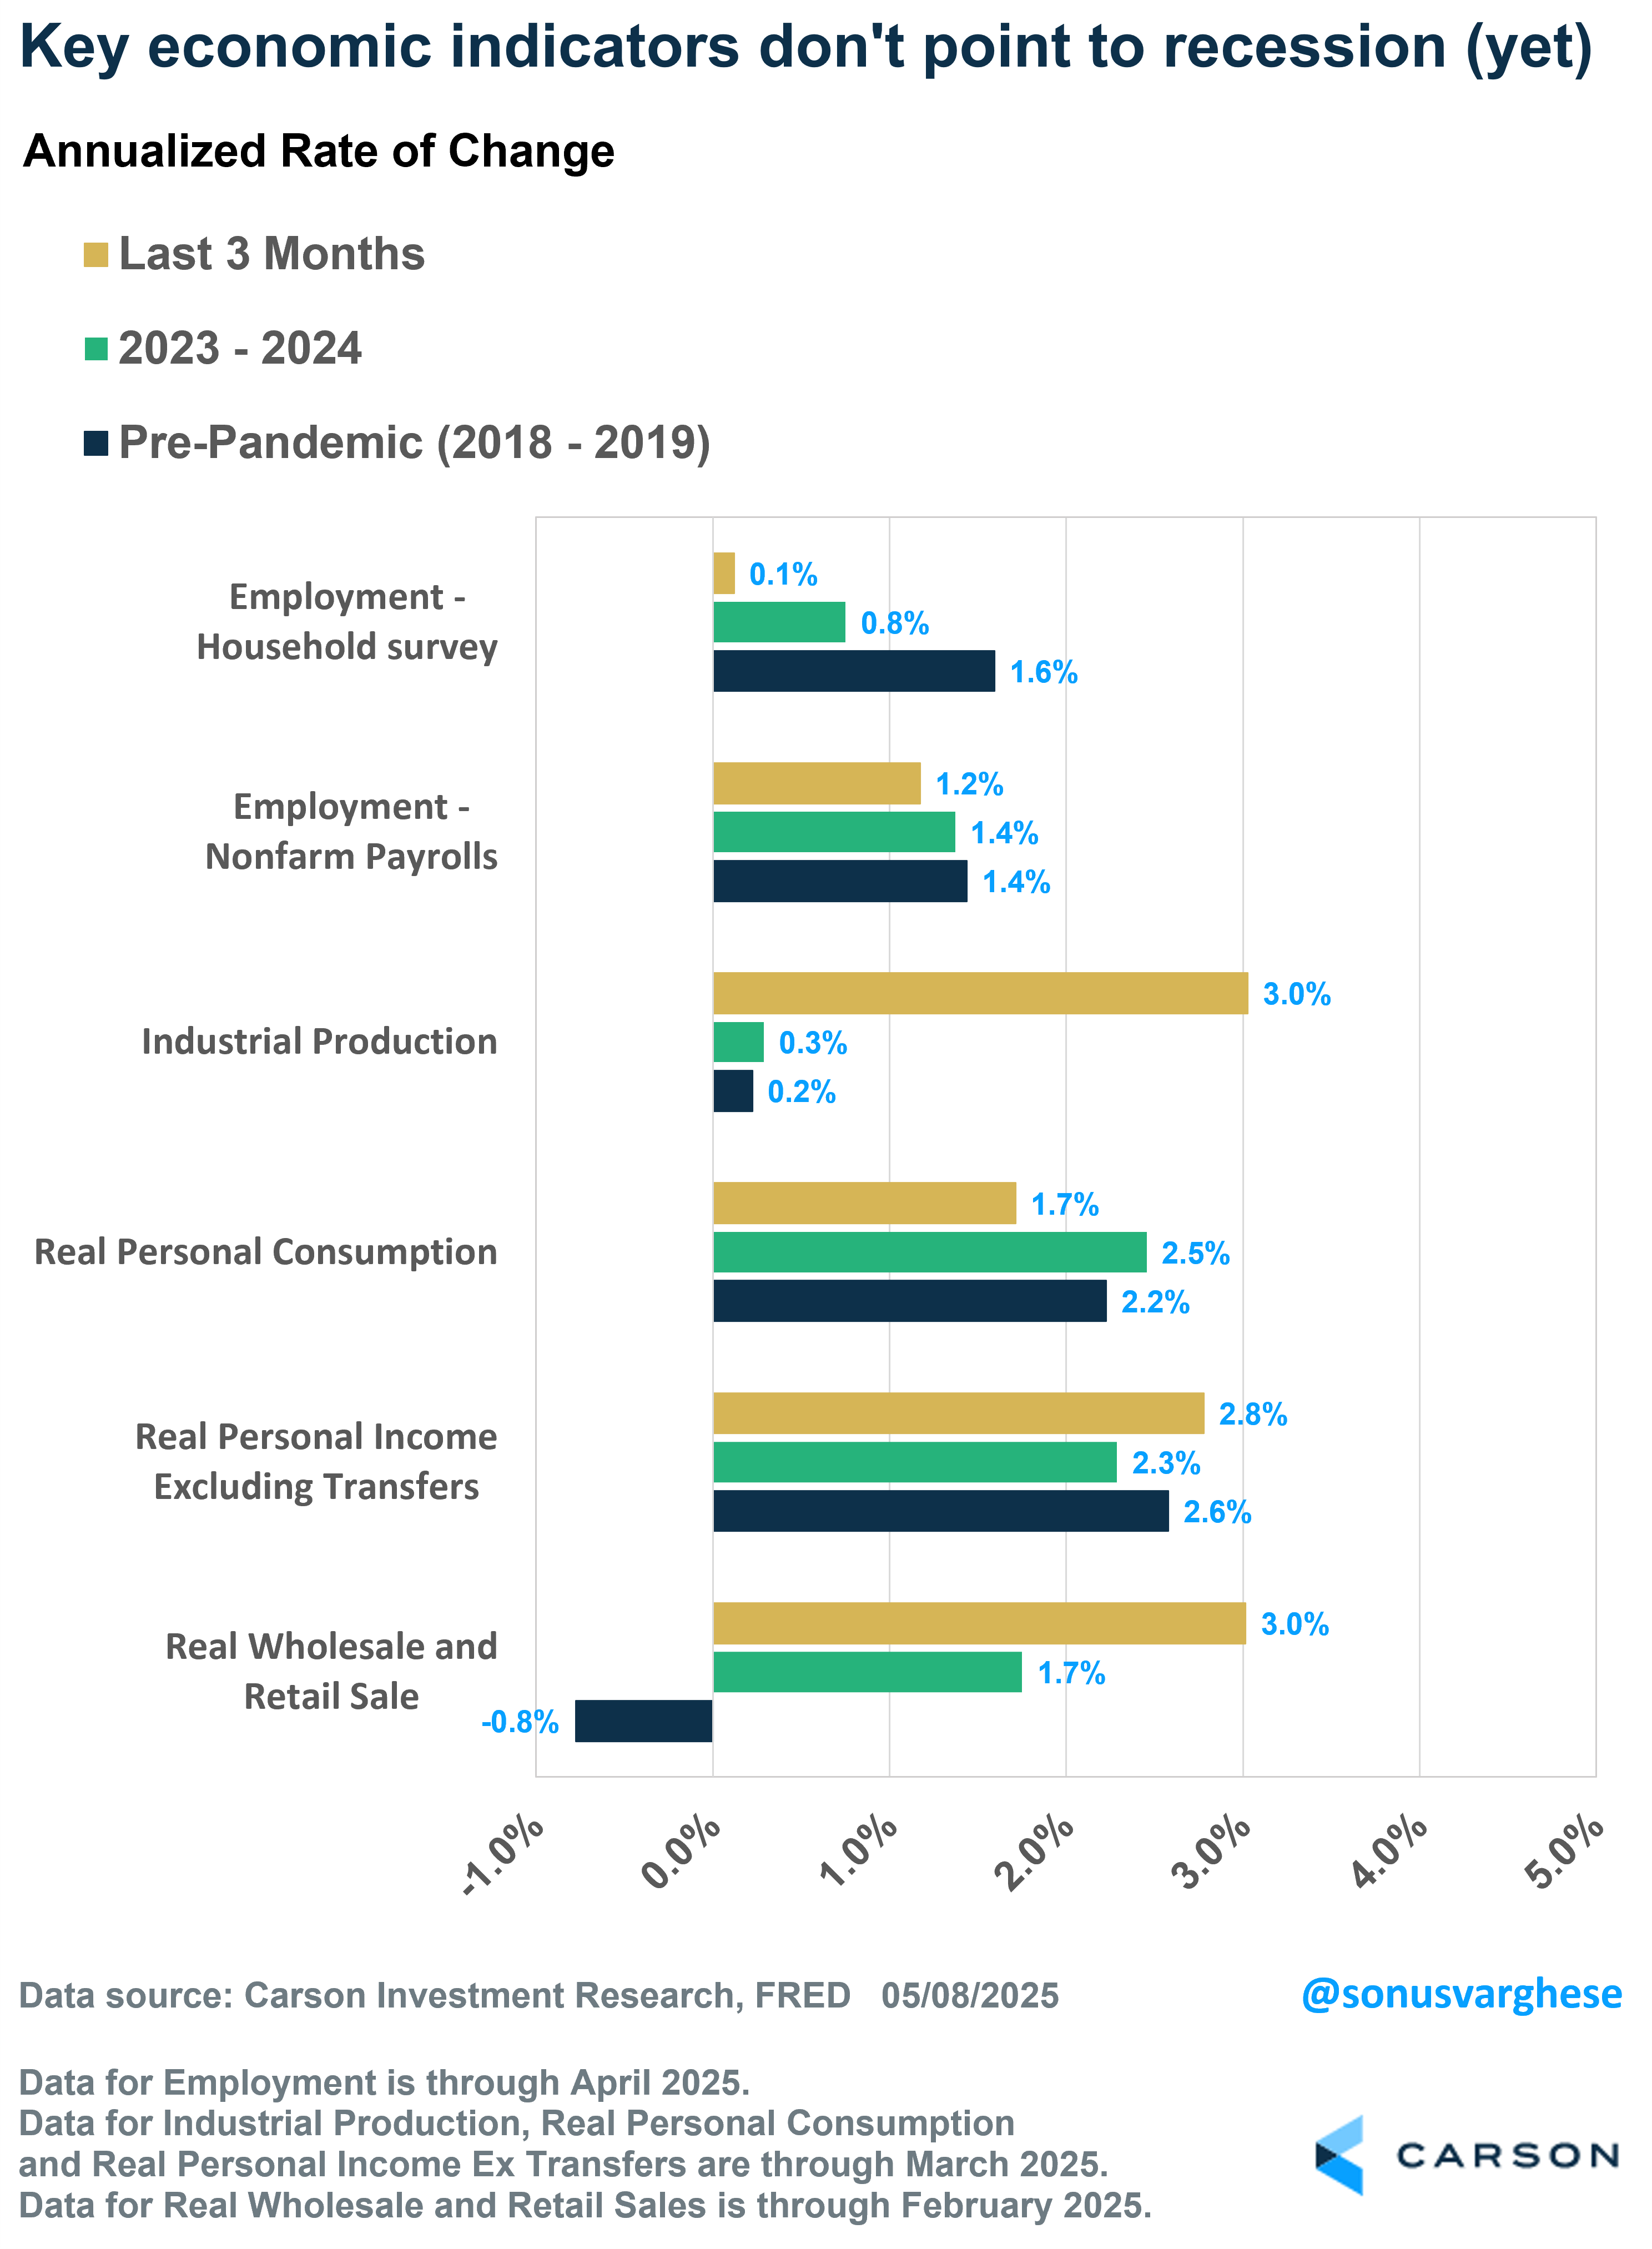
Right now, none of these indicators point to a recession. In fact, half of these metrics (3 out of 6) are running at an annualized pace (over the last three months) that is faster than what we saw in 2023-2024 and 2018-2019.
Note that NBER has no fixed rule about what measures contribute information to their process or how these datapoints are weighted. They note that in recent decades, two measures they’ve put more weight on are real personal income less transfers and nonfarm payroll employment.
At the same time, these data can be revised quite significantly (including payrolls), and they are not exactly timely (especially real wholesale and retail sales). So, it takes a while for NBER to “date” a recession. You don’t want to wait for the NBER call, because that can happen well after the fact, and sometimes after a recession is over.
- 2020 Feb-Apr recession: They called the start in June 2020 and the end of it in July 2021.
- 2007 Dec – 2009 Jun recession: They called the start in December 2008 and the end in April 2010.
Waiting for GDP data or NBER calls is meaningless within the context of investing. A recession, and a bear market, may be well underway by the time NBER decides to tell us a recession started. And a bull market may have begun well before they call the end of a recession.
Stay on Top of Market Trends
The Carson Investment Research newsletter offers up-to-date market news, analysis and insights. Subscribe today!
"*" indicates required fields
More Timely Economic Data Can Help
The good news is that we typically get more timely data without having to wait for GDP data or NBER calls to gauge whether the economy is close to or in a recession, or even recovering for that matter. This includes data like initial unemployment claims, unemployment rate, survey data, housing starts and permits, factory activity and new orders, etc. A recession is a broad-based decline in economic activity and so you want to use a wide swath of data to capture the aggregate economy.
This is the approach we use with our Carson proprietary leading economic index (LEI). We create a leading economic index for the US and 28 other countries across the world (we used to have one for Russia but not anymore).
- Each one is custom built to capture the dynamics of those economies, and we roll them up to form an aggregate measure for different regions (example, developed and emerging markets) and the world overall.
- Our LEIs Includes both soft data (like consumer and business sentiment) and hard data (though the US version doesn’t include any of the six NBER indicators).
- Our LEIS even Include even market data. Stock prices can be a useful part of the mix, as they potentially carry information about the economy before economic data reflects what’s happening (though market data typically forms less than 5% of our index).
Our LEI is an important piece of the puzzle as we form our Carson House Views since it encapsulates a lot of significant macroeconomic information. I do want to stress that it is only one input into our asset allocation, portfolio, and risk management decisions. Our process also has other pillars such as monetary and fiscal policy, technical factors, and valuations.
Our proprietary leading economic index for the US has not pointed to a recession at any point over the last three years (though the risk was on the higher side in late 2022). This was in sharp contrast to all the recession calls you saw in 2022 and 2023, including signals from other popular leading economic indicators.
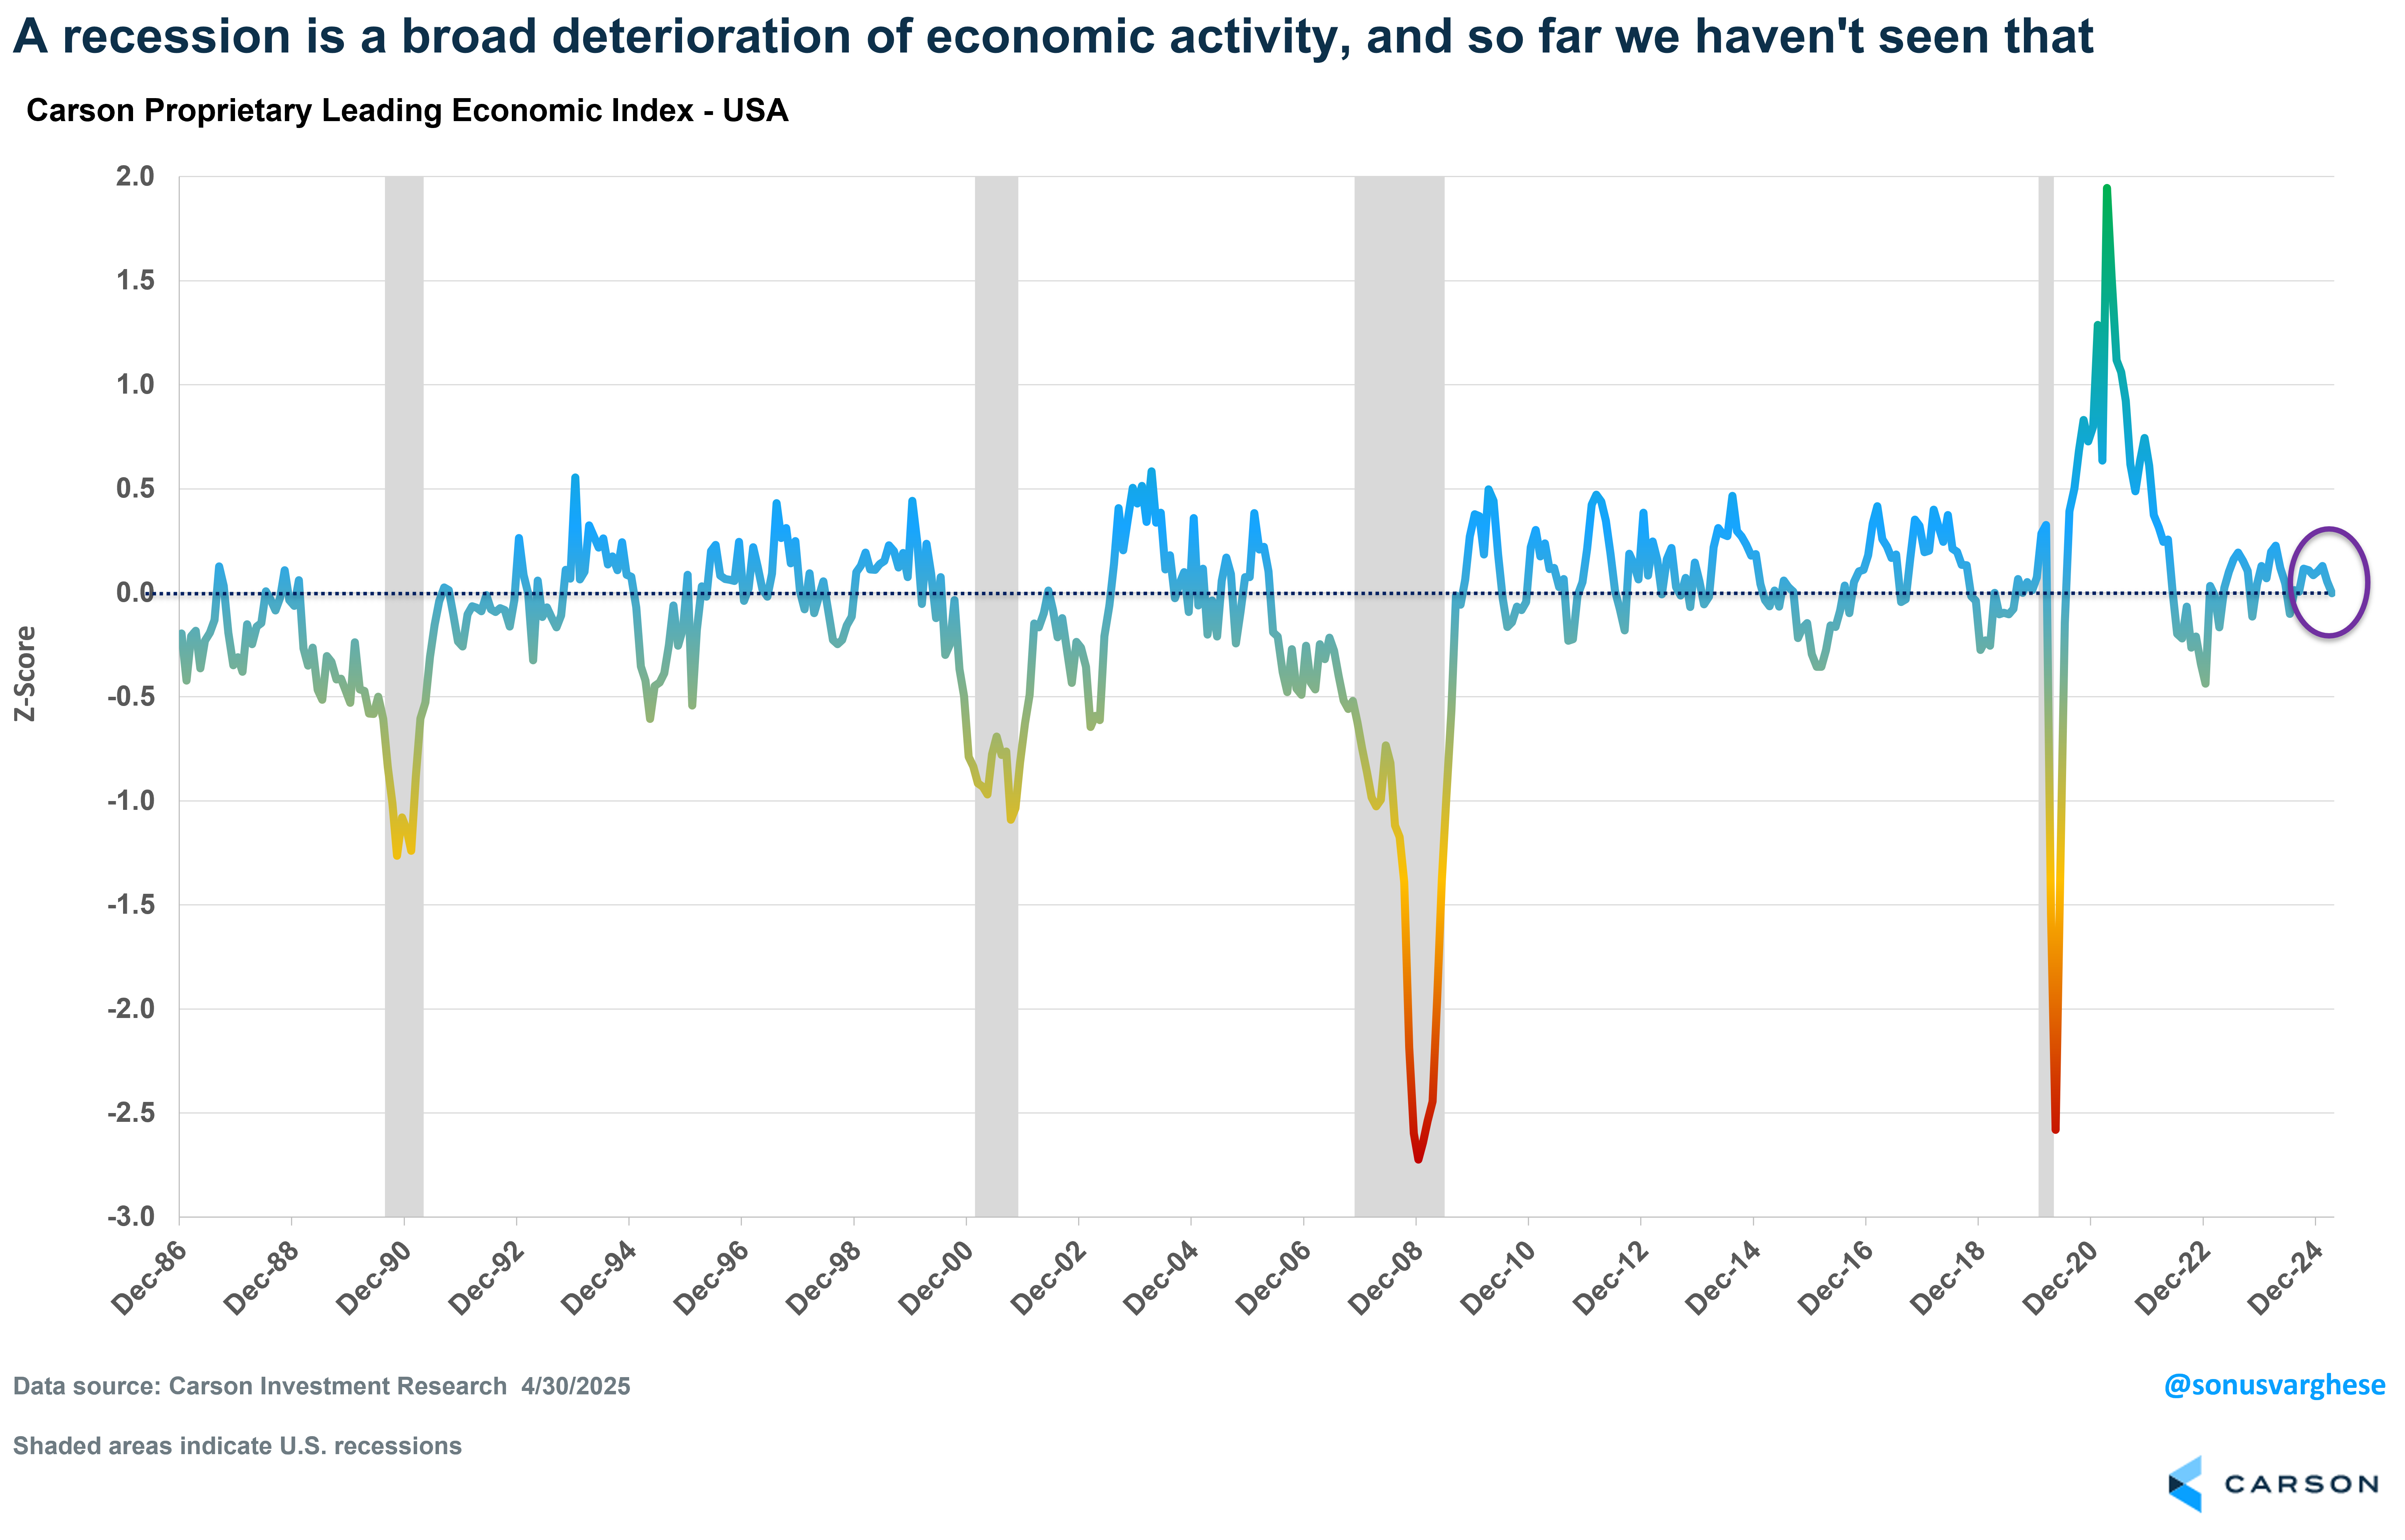
Right now, our proprietary LEI for the US is telling us that the economy is growing close to trend. In fact, it’s been saying that for a few months now, though there’s been a slight slowdown recently. But we’re yet to see a broad and deep deterioration of economic activity. This is not to say it will stay that way, but it’s as good a gauge as any with respect to capturing what’s happening in the broad economy.
Here’s a chart of the LEI going back to 1986. You can see how the big declines coincide with recessions (gray shaded areas). The LEI actually started plunging ahead of the 3 recessions prior to Covid (1990, 2001, and 2007), though keep in mind that the dates for those recessions aren’t known until well after the fact.
Here’s a closer look at the last four recessions, along with the cumulative gains for the S&P 500 starting 12 months ahead of the official start of the recession.
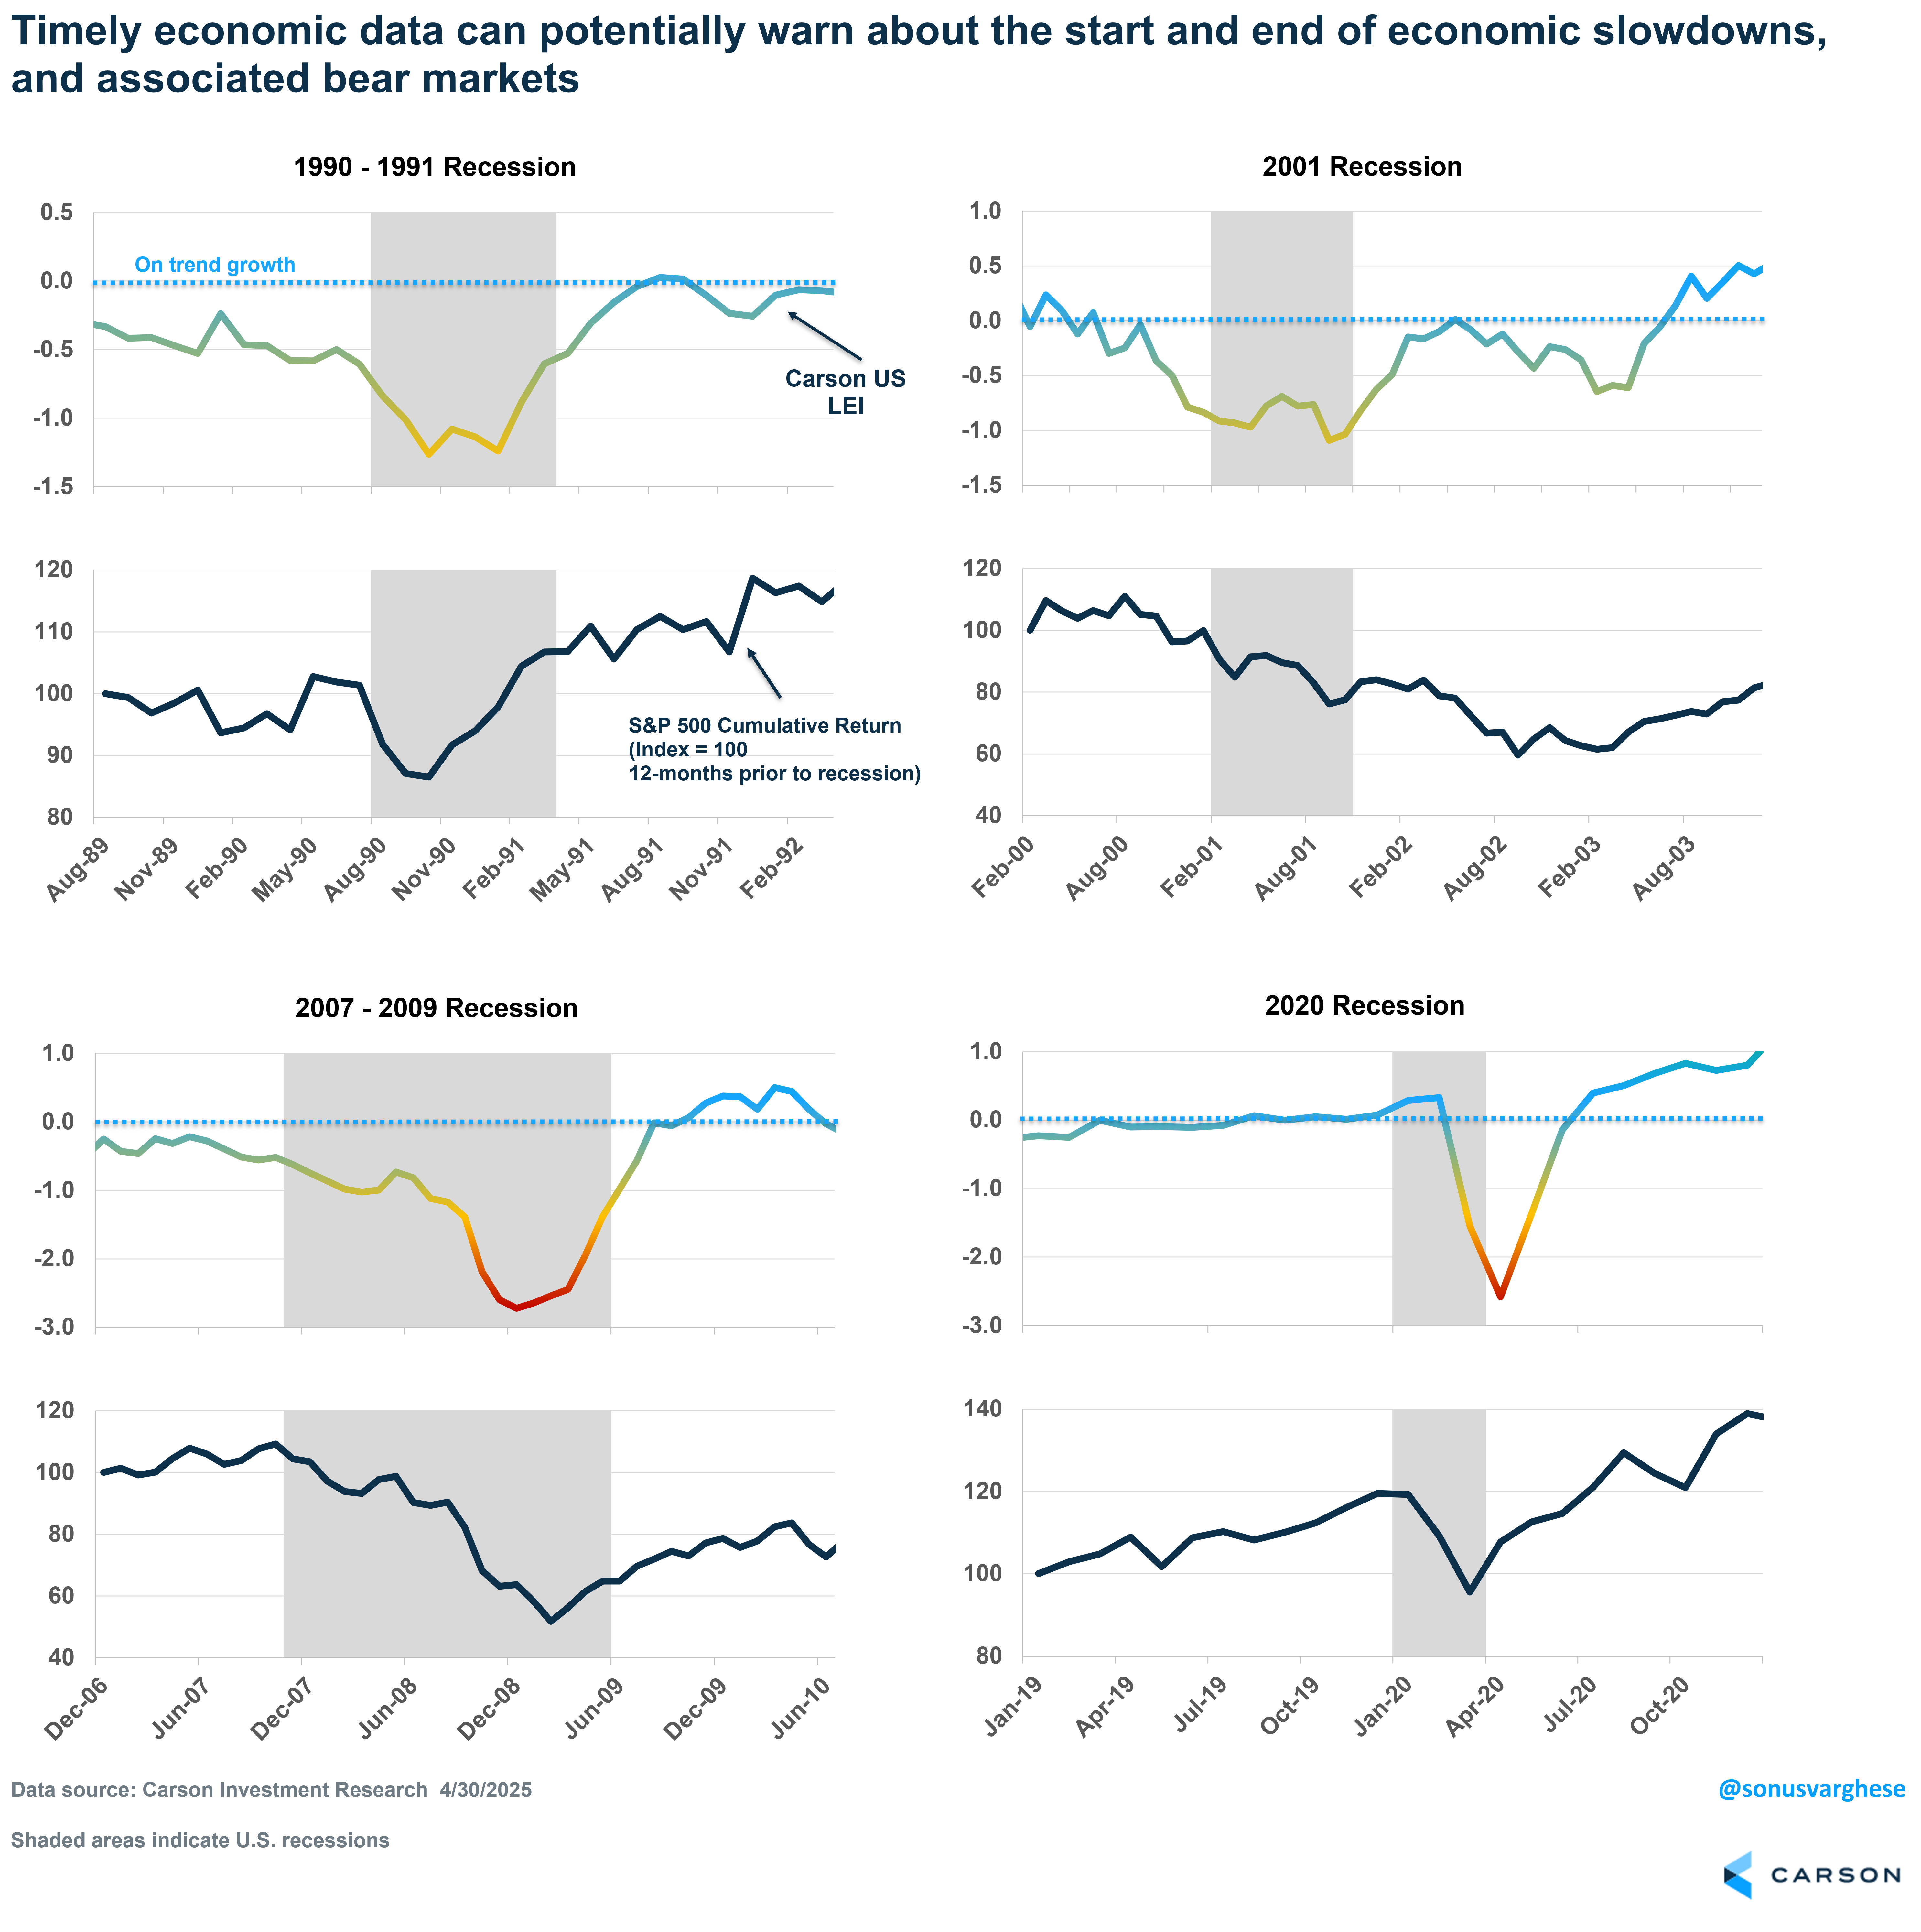
In each case, except for the Covid recession, the Carson LEI was running well below trend ahead of the official recession, indicating economic growth was slowing quite rapidly. Even prior to the 1990-’91 recession, our LEI had deteriorated well below trend. The S&P 500 did not experience a bear market back then, but the index was flat for about a year and half, eventually surging higher as the economy recovered (the LEI had also bottomed around then).
On the other hand, the 2001 recession officially lasted only 9 months (February – October 2001), but the slowdown lasted way longer than that (along with the bear market). We all know what happened in 2008. One interesting thing about 2001 and 2008 was that the recession, the drawdown, and eventual recovery, was a long drawn-out process, essentially occurring in four stages:
- Stage 1: Markets sense a recession and a drawdown starts
- Stage 2: As things get progressively bad, policymakers step in and markets stage a rally
- Stage 3: Then the data starts to get really bad and markets pull back in a bigger way, and we get even more policy support
- Stage 4: Policy support starts acting with a lag (housing typically being the first out of the gate) and markets recover before the broad economy does
The Covid recession was completely different, with unprecedented monetary and fiscal stimulus thrown at the economy (and markets) as soon as everyone sensed a steep downturn. That’s another reason why we don’t use our LEI as a silver bullet indicator and instead complement it with our fiscal and monetary policy outlook, which can be key as during Covid. Market sentiment is also useful as it can tell us how markets are assessing policy rescue.
Coming to the current situation, it looks like markets sense an economic (and profits) slowdown but the broad economic data hasn’t deteriorated yet. We’re already getting some policy support in the form of a pullback from extreme tariffs (with potentially more to come). Of course, the tariffs created the problem in the first place. We may well be in “Stage 2” of the process I outlined above, but that is not to say we ever get to Stage 3. As I wrote in my bull versus bear case blog, the bull case is that the administration completely withdraws tariffs. But the longer they stay on, the greater the damage to the economy. This is likely to be more drawn out rather than an immediate shock. Companies have already been preparing for some level of tariffs for a while, in part by building inventories (so we may not immediately see empty shelves), but things can get progressively worse. Moreover, if inflation picks up, even policy support from the Fed may not be forthcoming. That would only prolong the damage.
There’s a lot of uncertainty right now but the onus is clearly on the data to tell us that the widely anticipated broad economic slowdown (or recession) is happening. So far, that’s not happening but it’s early days yet.
For more content by Sonu Varghese, VP, Global Macro Strategist click here.
7953749.1-0525-A
