
With the huge run-up in AI-related stocks, the obvious comparison everyone makes is to the 1990s. However, beyond the fact that we have transformational technology in the works now, akin to the internet in the 1990s, there’s not a lot else that’s common.
For one thing, real GDP growth averaged 4.5% from 1996-1999, whereas it’s clocked in at an annualized pace of 2.5% from 2023-2026 (Q1), which is not too different from the 2010-2019 trend when economic growth was lackluster. In fact, despite even more proliferation of AI over the past year, real GDP growth has slowed from an annualized pace of 2.9% in 2023-2024 to 1.9% over the past five quarters (2025 Q1 – 2026 Q1). At the same time, nominal GDP (which is what matters for company revenues and profits) looks very similar.
- Nominal GDP growth averaged 6.1% from 1996-1999
- Nominal GDP growth has averaged 5.5% from 2023-2026 (Q1)
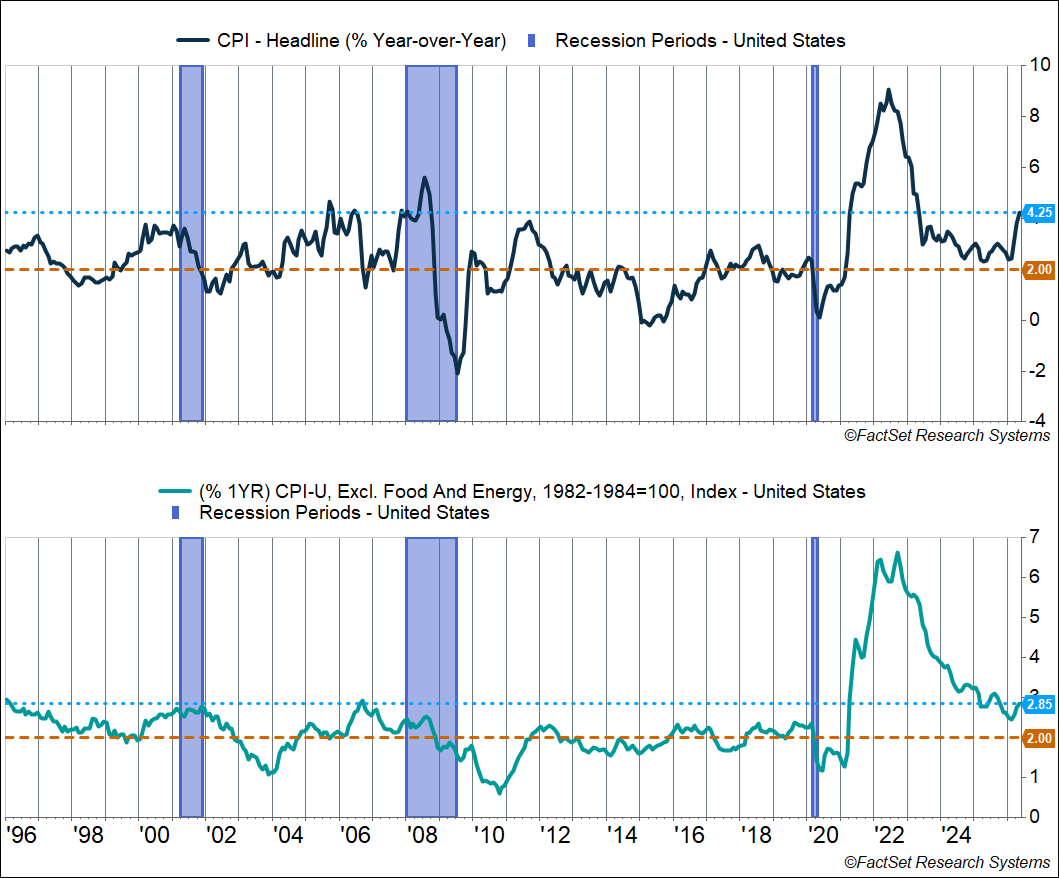
Of course, the difference between nominal and real GDP growth is inflation, and that gets to a key difference between the current environment and the late 1990s: inflation’s running way hotter right now. The headline consumer price index (CPI) averaged about 2.3% from 1996-1999. We just got the latest inflation data for May, and headline CPI is up 4.2% from last year and running at an annualized pace of 8.2% over the past three months. These readings are well above anything we saw in the late 1990s.
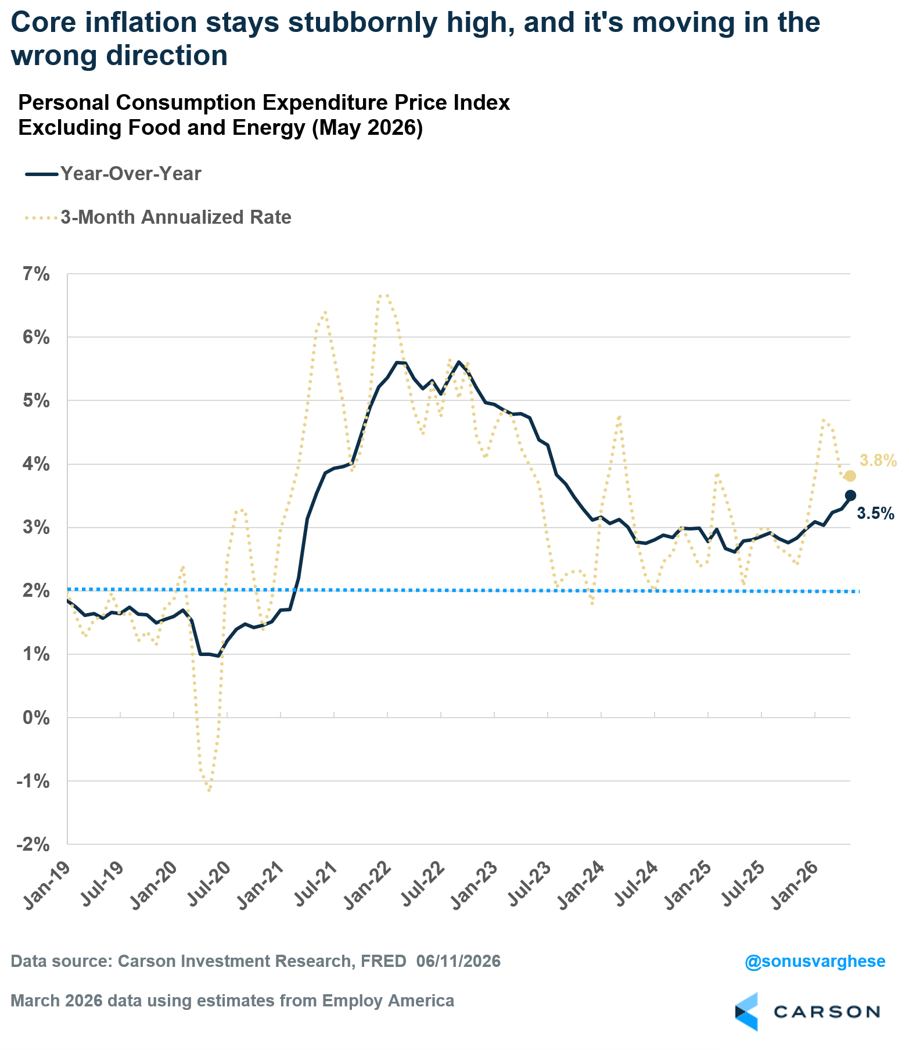
Headline inflation is running hot in large part due to higher energy prices, but there’s heat in food prices and core services outside of housing as well. Core CPI is up 2.9% year-over-year and running at an annualized pace of 3.2% annualized over the past three months. From 1996-1999, core CPI averaged just 2.3% across 1996-2000. The current pace of core inflation is well below what we saw in 2022, but, as you can see in the chart below, it’s above peak levels we saw in the late 1990s and even in the 2000s expansion. Moreover, it’s trending higher now.
We also got a hot producer price index reading for May, and combining the CPI/PPI data suggests the Fed’s preferred inflation gauge, the personal consumption expenditures (PCE) index, will also come in hot. In fact, the core PCE index is going to be hotter than even core CPI, with a 3.5% year-over-year increase and a 3.8% annualized pace over the last three months.
Where’s The Productivity Boom?
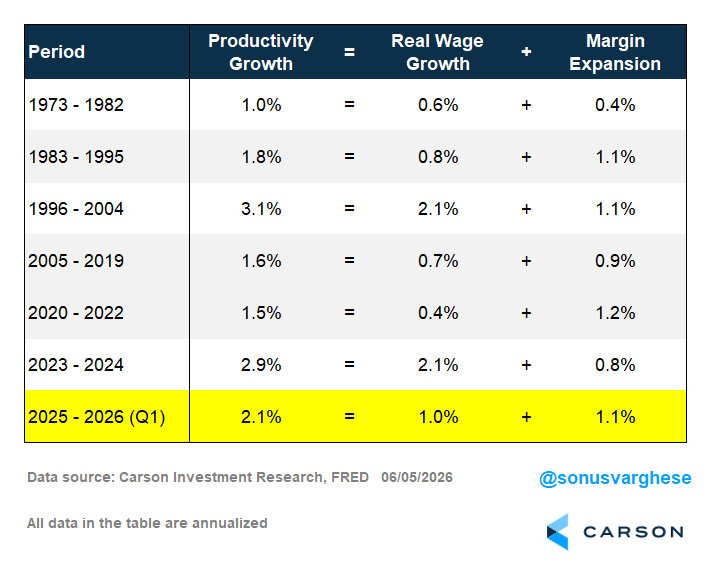
The problem with elevated inflation is that it implies weak inflation-adjusted income growth. That’s not what you’d expect if productivity growth is running strong, which is what the narrative around AI is. If productivity growth is strong, you should see living standards grow amid strong real wage growth. This has been the case historically, too:
- 1996-2004: productivity growth averaged 3.1% annually, while real wages grew 2.1% a year
- 2023-2024: productivity growth averaged 2.9% annually, while real wage growth grew 2.1% a year.
On the other hand, periods of weak productivity growth have coincided with weak real income growth.
- 1973-1982: productivity growth averaged just 1.0%, and real wage growth grew just 0.6% annually amid high inflation in the 1970s
- 1983-1995: productivity growth clocked in around 1.8% annually, but real wage growth picked up to just 0.8% a year
- 2005-2019: another period when you had lackluster economic growth, with productivity growth clocking in at 1.6% and real wage growth growing 0.7% annually
- 2020-2022: productivity growth averaged 1.5%, not too different from the prior decade and a half trend, but strong nominal wage growth was almost entirely eaten up by inflation, and so real wages grew just 0.4% annually
Stay on Top of Market Trends
The Carson Investment Research newsletter offers up-to-date market news, analysis and insights. Subscribe today!
"*" indicates required fields
The last five quarters have been interesting from two angles:
- One: productivity growth has averaged 2.1%, which is above the 2005-2022 trend but a step down from the 2023-2024 pace of 2.9% (contrary to the AI narrative)
- Two: despite above-trend productivity growth, real wage growth has been weak amid elevated inflation (about 1.0% annualized pace)
Time to bring in some national accounting math: productivity growth is essentially the sum of real wage growth and margin expansion. Margin expansion is essentially the opposite of a change in labor’s share of national income; more simply put, if margins are expanding, then labor’s share of national income is falling (and vice versa). We’ve always seen some margin expansion, including periods when productivity growth ran strong (1996-2004 and 2023-2024). However, margin expansion has run especially strongly over the past five quarters, and that’s good for stocks. But one company’s margin expansion is someone else’s inflation, and thanks to elevated inflation, real wage growth is weak.
Could this continue? It’s hard to say because we really haven’t seen a situation like this in recent history, i.e., when productivity growth is stronger but most of that goes toward margin expansion rather than real wage growth. Over the short term, productivity growth is likely to run strong with all the AI-related capex spending, and that’s going to keep profit margins strong. But by the same token, we’re also likely to see elevated inflation and weak real wage growth.
How This Cycle Could End: The 1960s Analogy
One thing that could end this current expansion is the Fed, and from that perspective, we do have an historical analogy: the late 1960s. We wrote about this in our 2026 Outlook. The policy picture leading into 1967-68 was similar to that of today. Thanks to Great Society programs (Medicare, Medicaid, education, poverty, and housing programs), fiscal deficits were running high, around 2.0-2.5% of GDP. (Seems laughably low compared to the current level of 6.5%. Oh, and the largest publicly traded companies? Tech innovation giants IBM and Bell Telephone.) The Fed also cut rates by almost 2 percentage points between the end of 1966 and mid-1967, believing they had squelched inflation.
But they had not, and inflation picked up over the next two years, rising from a low of 2% to almost 6%. The Fed kept chasing inflation higher, raising rates from 3.5% to 7.9% across 1968 and 1969, slowing the economy in the process (the recession began in December 1969). The S&P 500 had rallied about 50% from its prior bear-market low in October 1966 to November 1968. But a hawkish Fed that was trying to get a handle on inflation sent the index down by 37% from November 1968 through May 1970 – an 18-month bear market that saw the S&P 500 fall back to where it was in 1963! Bonds didn’t fare well during this period, either, as rates were rising.
We’re not saying the expansion will end in 2026. We think the Fed will remain dovish under Mr. Warsh and will simply stand pat on rates this year. But there’s the risk of higher inflation volatility, especially if the Fed remains accommodative and then has to correct for it as the 2020s draw to a close.
For now, we ride the wave of a hot economy (in nominal terms) and momentum-driven markets. But we’re increasingly careful about portfolio construction and aim to be as diversified as possible to avoid a wipeout down the road.
For more content by Sonu Varghese, Chief Macro Strategist, click here.
