
“A body at rest stays at rest and a body in motion stays in motion unless acted upon by an external force.” Sir Isaac Newton, First Law of Motion
The incredible rally continues, justified with some spectacular earnings results. Yes, we are looking at a six-month win streak for the S&P 500, but as we noted in Why Stocks Could Gain 20% In 2025, a year-end rally is quite common after a big first 10 months.
Now we look at the calendar and we see November just ahead, which historically is a very strong month and kicks off a run of some of the strongest months of the year. Yes, we’ve seen a huge rally into this usually bullish period, but does that mean the bull will tire? Maybe not, as we discuss below.
So Much for Sell in May
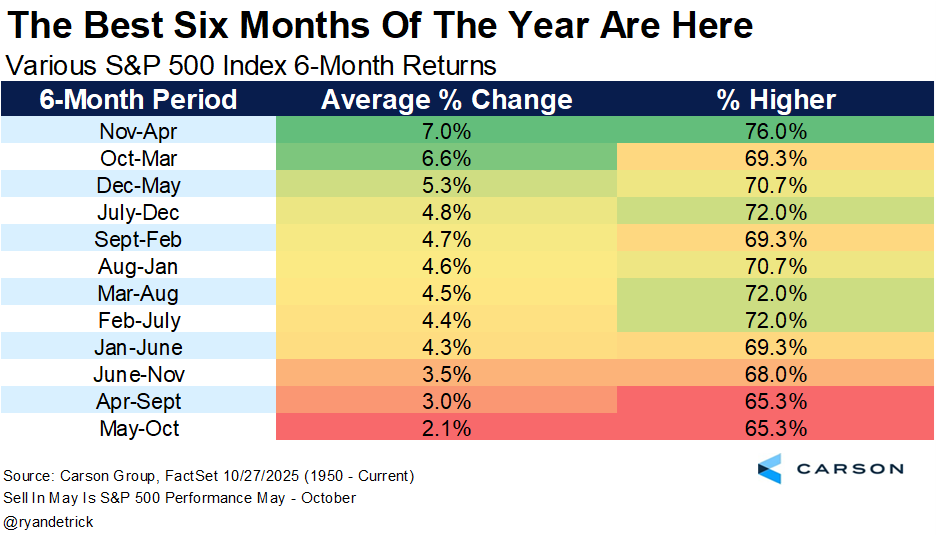
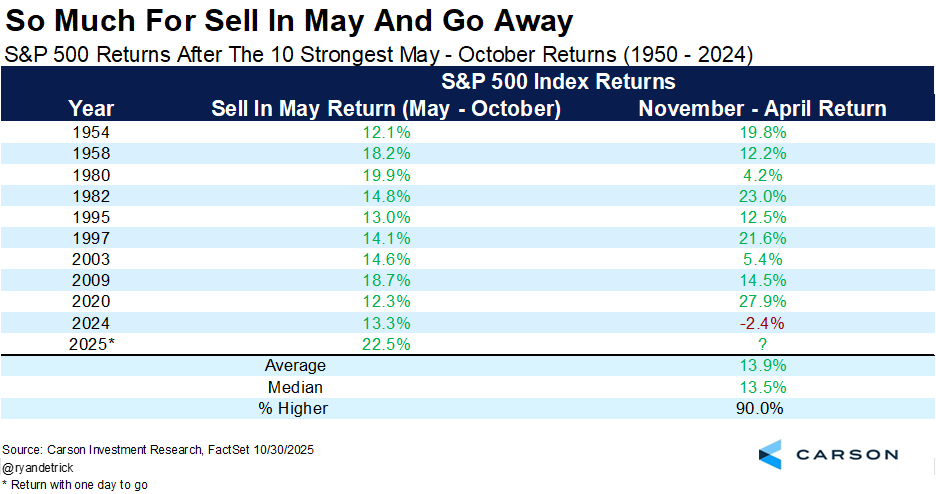
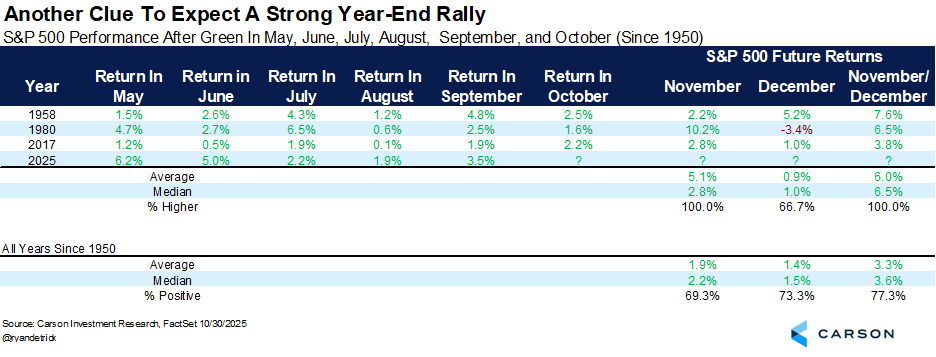
Remember when the media meme machine told you to “Sell in May and go away”? Well, it does have data to back it (even if “go away” isn’t the right answer, as I discussed at the time in Why We Think You Shouldn’t Sell in May). Historically the six months from May through October are the weakest six consecutive months of the year (chart on that below), but that sure wasn’t true this time! In fact, the S&P 500 gained all six months for only the fourth time ever, joining 1958, 1980, and 2017 in the record books. But even more incredible, the S&P 500 is up more than 22% during these historically weak months, the best “Sell in May” return ever!
Here’s a nice table that shows that indeed May through October is the worst six months for the S&P 500 historically. But that means the next six months are the best, up 7.0% on average and higher 76% of the time.
Logically you’d think when these usually weak six months do well, it could steal some gains from the usually bullish months that follow, right? To quote Lou Corso, not so fast my friends. We looked at the 10 best “Sell in May” periods and the next six months were higher nine out of 10 times and up a very impressive 13.9% on average, nearly double the average return of 7.0%. So maybe this strength in the normally weak period could actually be a clue that we may have continued strength.
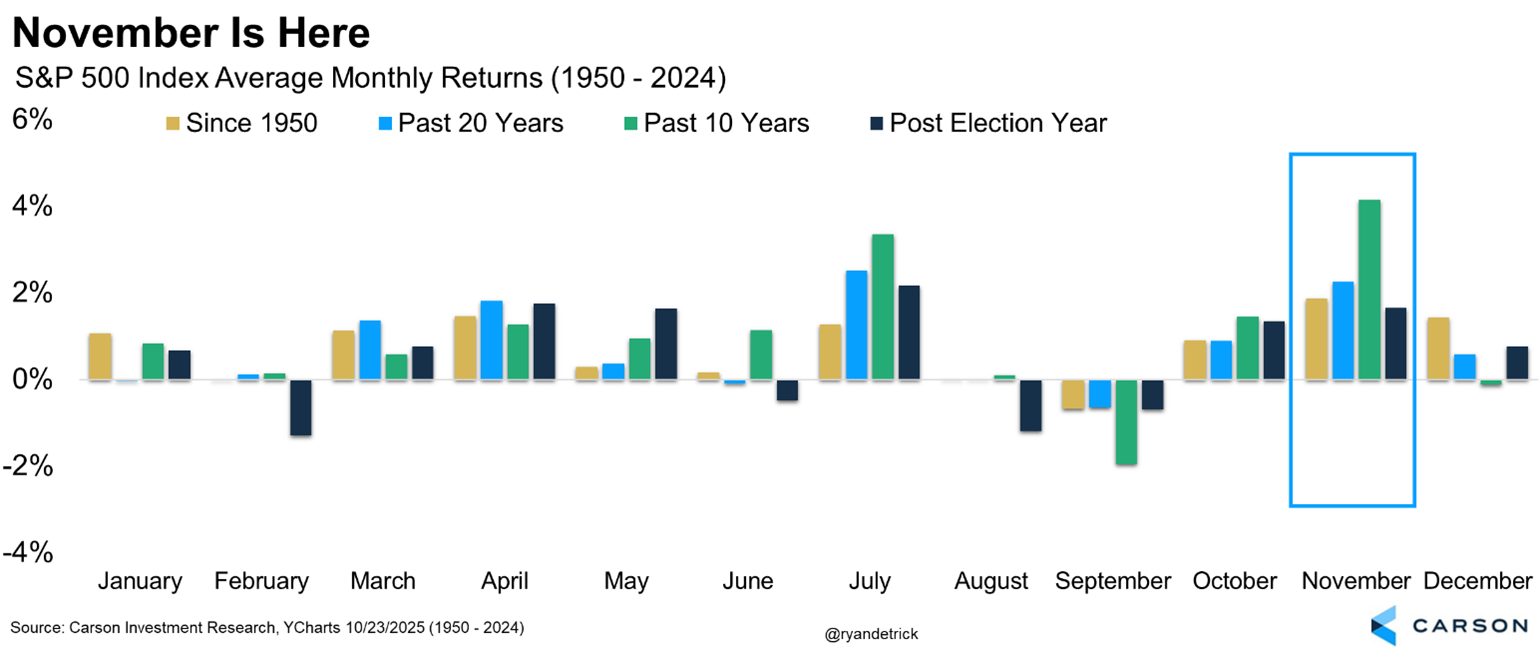
Historically The Best Month of the Year
November is the best month on average since 1950, the second best the past 20 years, the best the past decade, and the third best in a post-election year.
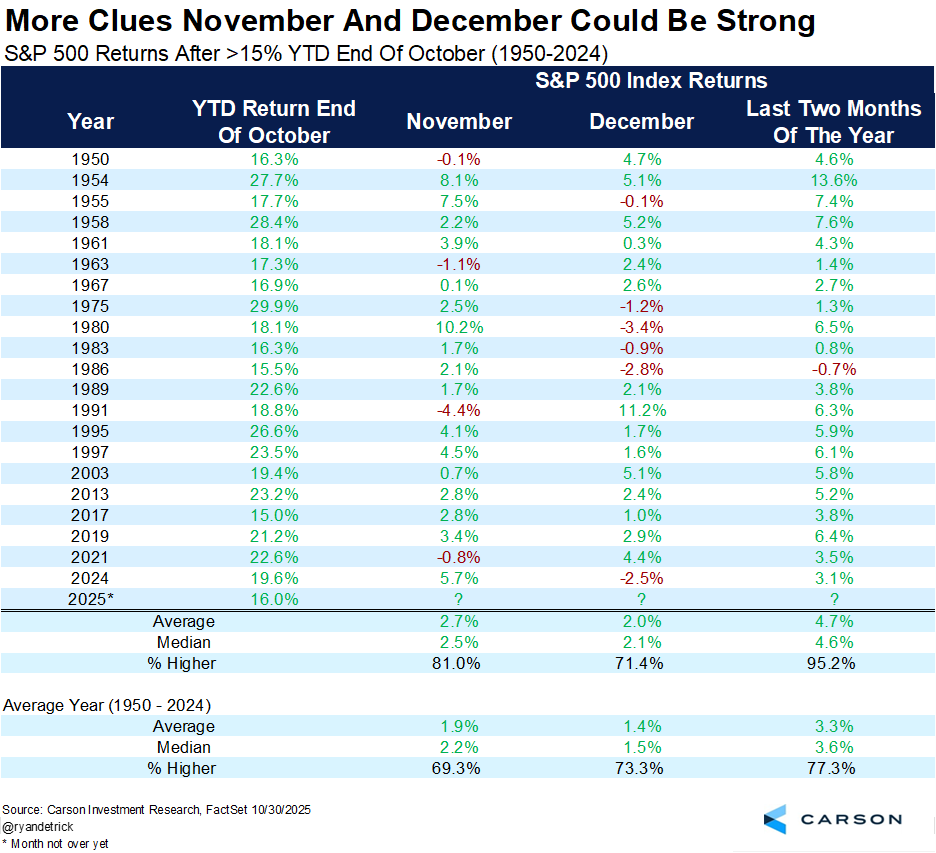
Adding to the fun, when the S&P 500 is up more than 15% for the year heading into the usually bullish month of November, the eleventh month of the year does even better than average at 2.7% versus 1.9% (and so does December).
Lastly, when all six months during the “Sell in May” period are higher (which has only happened three other times), once again a very strong November is possible, up more than five percent on average!
It has been a great year so far for investors and the good news is we don’t think the ride is over yet. For our current thoughts on this bull market, be sure to watch our latest Facts vs Feelings below and if you really want to help us out, give a comment! Algos love those comments. HAPPY HALLOWEEN!
For more content by Ryan Detrick, Chief Market Strategist click here.
8562406.1.-31OCT2025