
“I look to the future because that’s where I’m going to spend the rest of my life.” George Burns, Actor and Comedian
Thanks to the near bear market back in April around the Liberation Day crash, 2025 joined the ranks of basically every other year in history that had some scary headlines and market volatility. We came into 2025 and were on record that stocks would have another solid year, but to be on the lookout for more volatility than we’d seen the past few years.
Think about just the past two years, as stocks gained more than 20% each year, yet there were some real freakout moments for investors. In 2023, March saw the regional bank crisis and there was legitimate but very exaggerated fear that the entire system was going to collapse because of what was happening at just a few regional banks.
Sounds silly now, but if you were there, then you know exactly what I’m talking about. Then 2024 saw more spectacular gains, but for a few days in early August many investors suddenly became panicked about the ‘yen carry trade unwind.’ We won’t get into all of that, but know that the Japanese Nikkei had its worst day since the 1987 crash and global markets were melting down. Then a few days later it was over and we were off to the races again.
You can do yourself a big favor if you go into each year expecting to see some scary headlines and big down days.
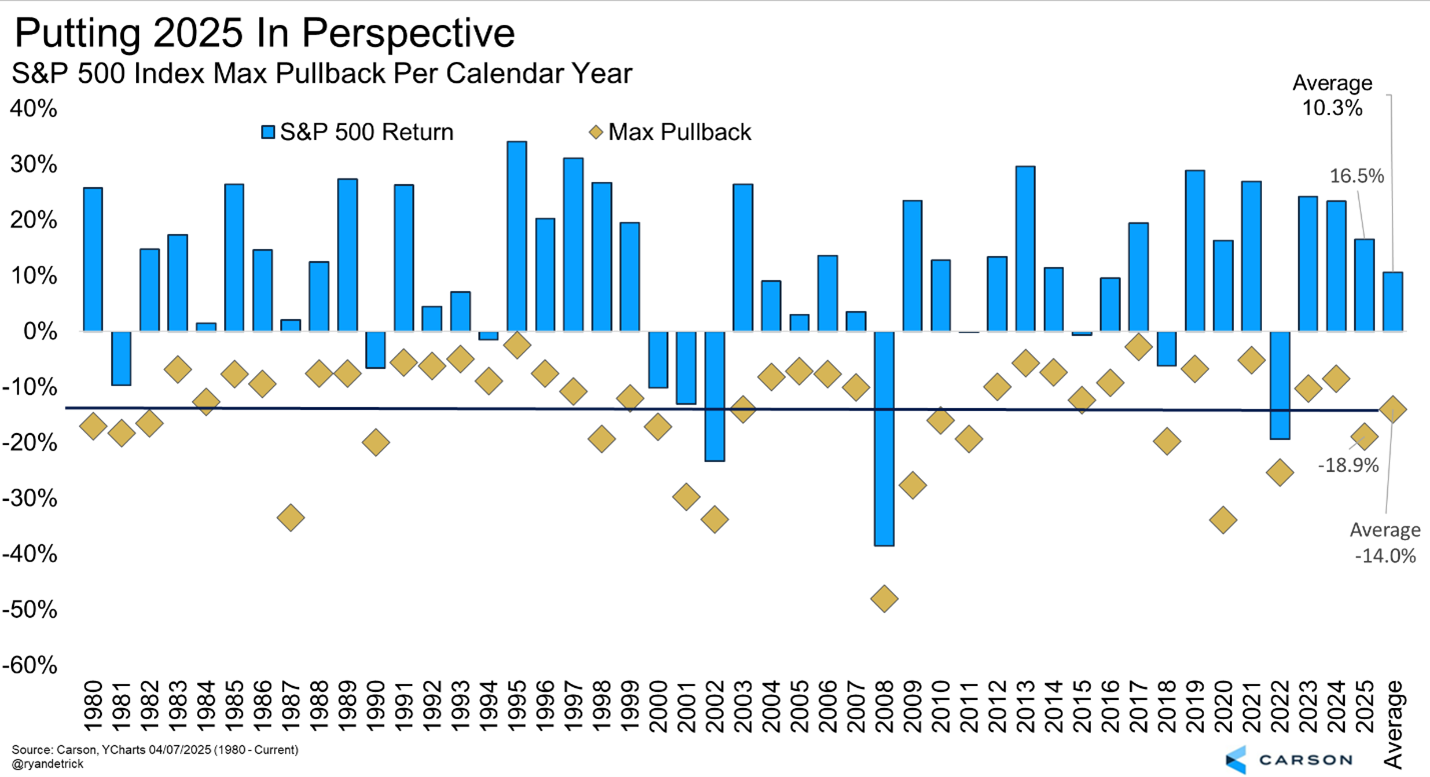
Putting It in Perspective
We said a correction in the range of 12-15% was quite possible in 2025, likely during the first half of the year. One of our main reasons was we hadn’t had a 15% correction for multiple years. Well, that sure played out. Here’s a nice chart that shows the average year since 1980 has gained double digits, but also saw an average peak-to-trough decline of 14%.
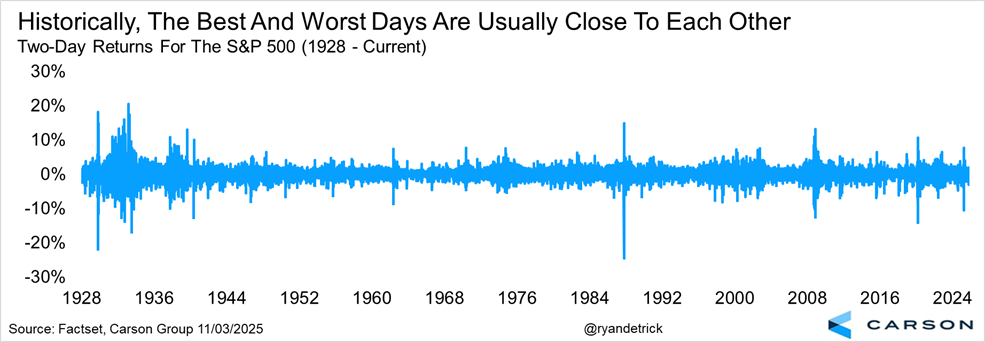
Even Good Years Have Bad Days
Another way to show this is to highlight that the worst days of the year tend to take place around the best days of the year. We noted this many times in March and April, as we noted selling then would likely mean you’ll miss the eventual good days. In fact, we found that the worst days tended to usually happen before the best days, so if you sold, you’d miss out. Once again, this played out to script, as we had one of the worst two-day selloffs ever after Liberation Day, but just a few days later was one of the best two-day rallies.
Stay on Top of Market Trends
The Carson Investment Research newsletter offers up-to-date market news, analysis and insights. Subscribe today!
"*" indicates required fields
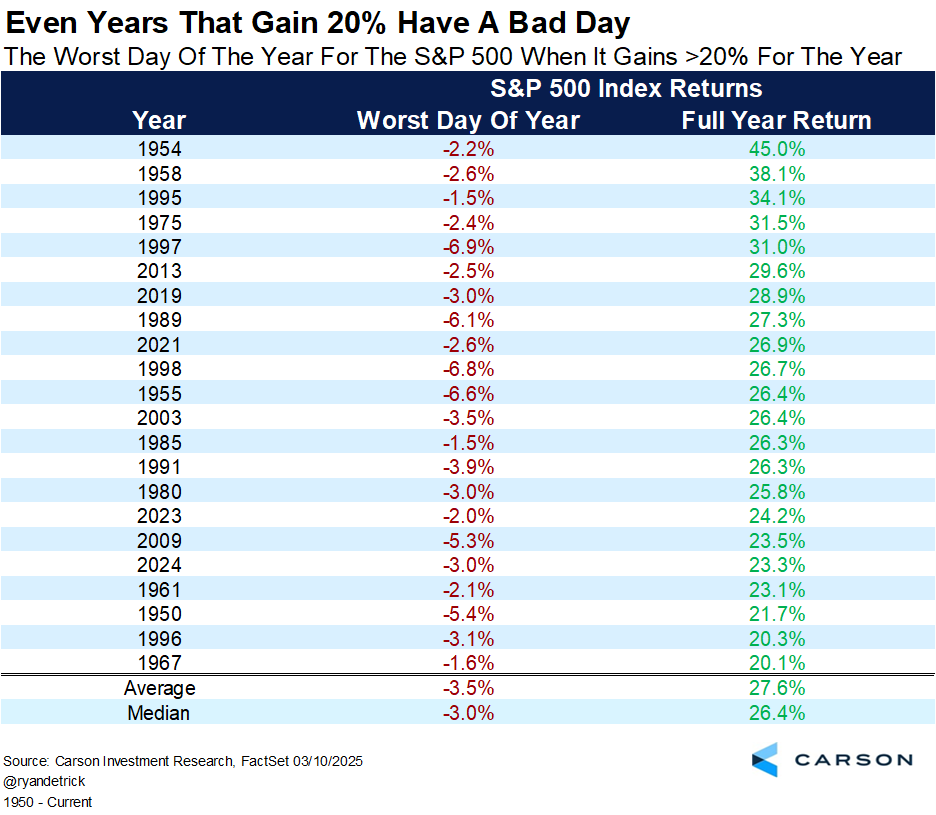
We shared this table back in March. It looks at all the years that gained 20% and sure enough, even some of the best years ever had some really big down days. Look at 1997, as one day lost nearly seven percent, yet the full year gained more than 30%! Once again, if you go into each year expecting some big down days, you’ll do yourself a favor and not panic as much when they happen.
What If You Sell?
Ah, the next question is what happens if you sell after some bad days? As we said, the odds favor you’ll now miss the eventual snapback rally. I’ve done this for 26 years and time and time again I hear from investors who regret selling at major lows. I heard from so many people back in April that they couldn’t take it and just had to sell. They heard on TV that tariffs were going to crush our economy, President Trump was willing to cause a market collapse to win the trade war, and so on. I heard it all. Sure enough, all of those investors that sold missed out on one of the most historic rallies in history.
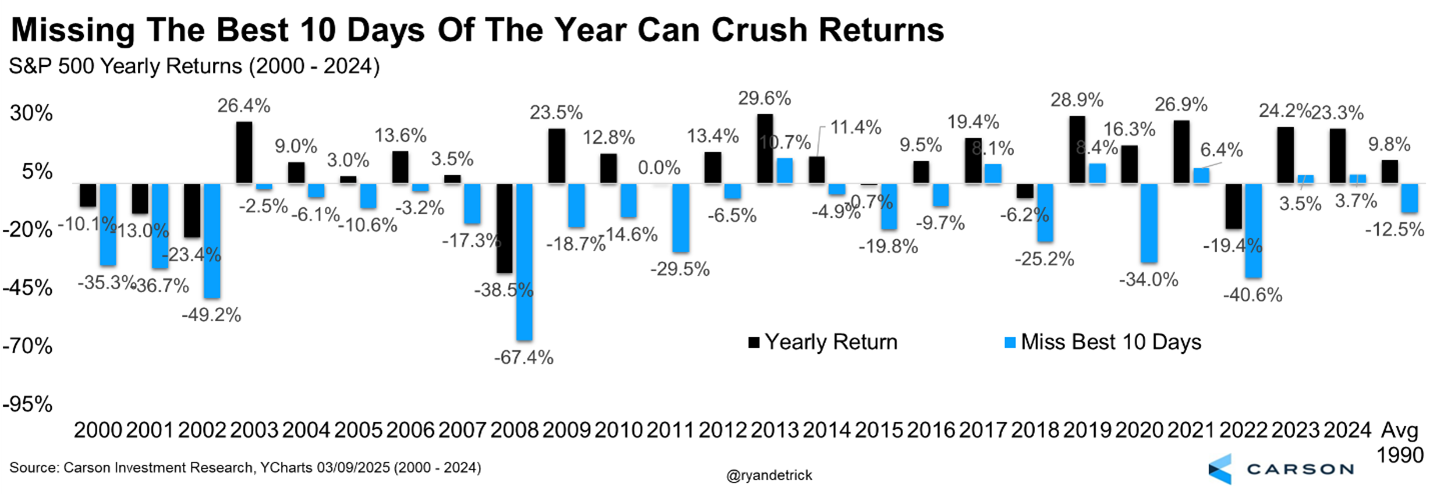
Since 2000, the average year for the S&P 500 gained just under 10%, but if you sold and missed the best 10 days of the year that dropped all the way down to -12.7%. Yes, I’m aware these numbers are much different (and better) if you missed the 10 worst days. But for this exercise, we are stressing don’t try to find the best and or worst days. Stick with your plan and embrace the volatility that each year will have.
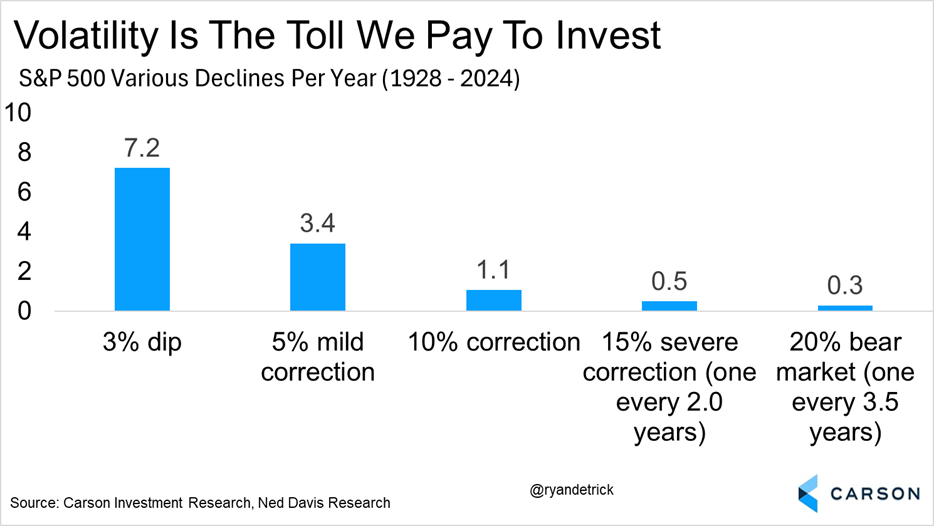
The Price We Pay
Here’s a very popular chart we’ve shared many times and it is still one of my favorites. We like to say that volatility is the toll we pay to invest. In order to benefit from longer-term gains, you may need to deal with some short-term pain. This is one you should print off and put on your desk to always remember when those scary days happen.
The Slingshot Is Real
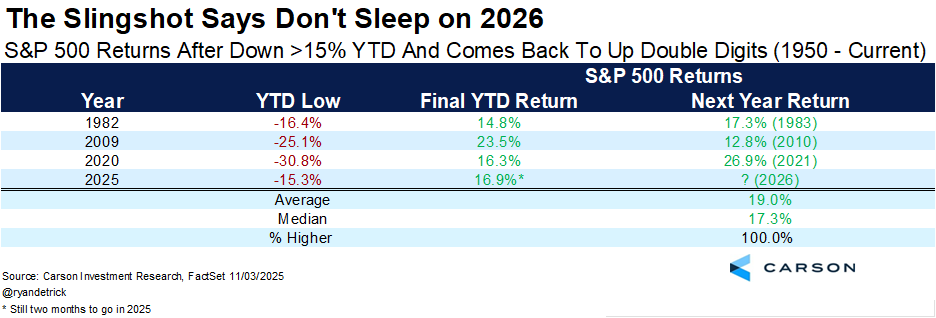
Lastly, this year is shaping up to be quite historic for being down more than 15% at some point during the year, yet closing up double digits. Yes, the year isn’t over yet, but should this year remain strong (as we expect) it will join 1982, 2009, and 2020 as the only other years to achieve this incredible feat.
Like a slingshot, stretching it one way builds up energy for strong momentum in the other direction once you let the slingshot go. And it’s not just the immediate rebound—the next calendar year also tends to do well too (so 2026 in this case). All three prior instances of going from 15% down to a double-digit gain in the same year also saw at least a double-digit gain the following year with a very impressive average gain of 19.0%. File this one under reasons to be bullish as we head into 2026.
Thanks for reading and for trusting our team for your investment and economic analysis. Be sure to watch or listen to the very special Halloween themed Facts vs Feelings livestream we did last week, if for no other reason to hear me as an “Angry Bear.”

For more content by Ryan Detrick, Chief Market Strategist click here
8572167.1.-04NOV2025
