
It’s not been a good couple of years for macro forecasters in general. First, they said inflation would be transitory, but it persisted longer than most people anticipated (including the Fed). The other big call was for a recession in 2023, which obviously hasn’t panned out. Granted, the year is not done yet, but safe to say a recession is highly unlikely in the next 3-6 months thanks to renewed economic momentum. Though don’t be surprised if a lot of 2024 outlooks are similar to 2023 outlooks, with predictions of a recession. The Carson Investment Research Team went the other way in 2023, and without giving too much away, we’re still in the camp that a recession is unlikely any time soon.
The puzzle for a lot of economists’ is why the Fed’s aggressive rate hikes haven’t caused a recession. What’s really held up the economy is consumer spending. The traditional models say that if the Fed raises rates, companies will pull back hiring, and the unemployment rate will increase. And that’s going to pull down spending – beyond workers who are laid off and no longer have regular incomes, workers who have steady jobs become more fearful of losing them and decrease spending (dampened “animal spirits”).
Obviously, none of that has happened. Consumers continue to spend, and since one person’s spending is another person’s income, businesses continue to hire to meet higher demand, which in turn leads to more income across the economy, and more spending.
The big question then is why households haven’t really been fearful and pulled back spending, despite all the headlines of an impending recession. Simple answer: they’re worth a lot more now and feel less need to save.
Stay on Top of Market Trends
The Carson Investment Research newsletter offers up-to-date market news, analysis and insights. Subscribe today!
"*" indicates required fields
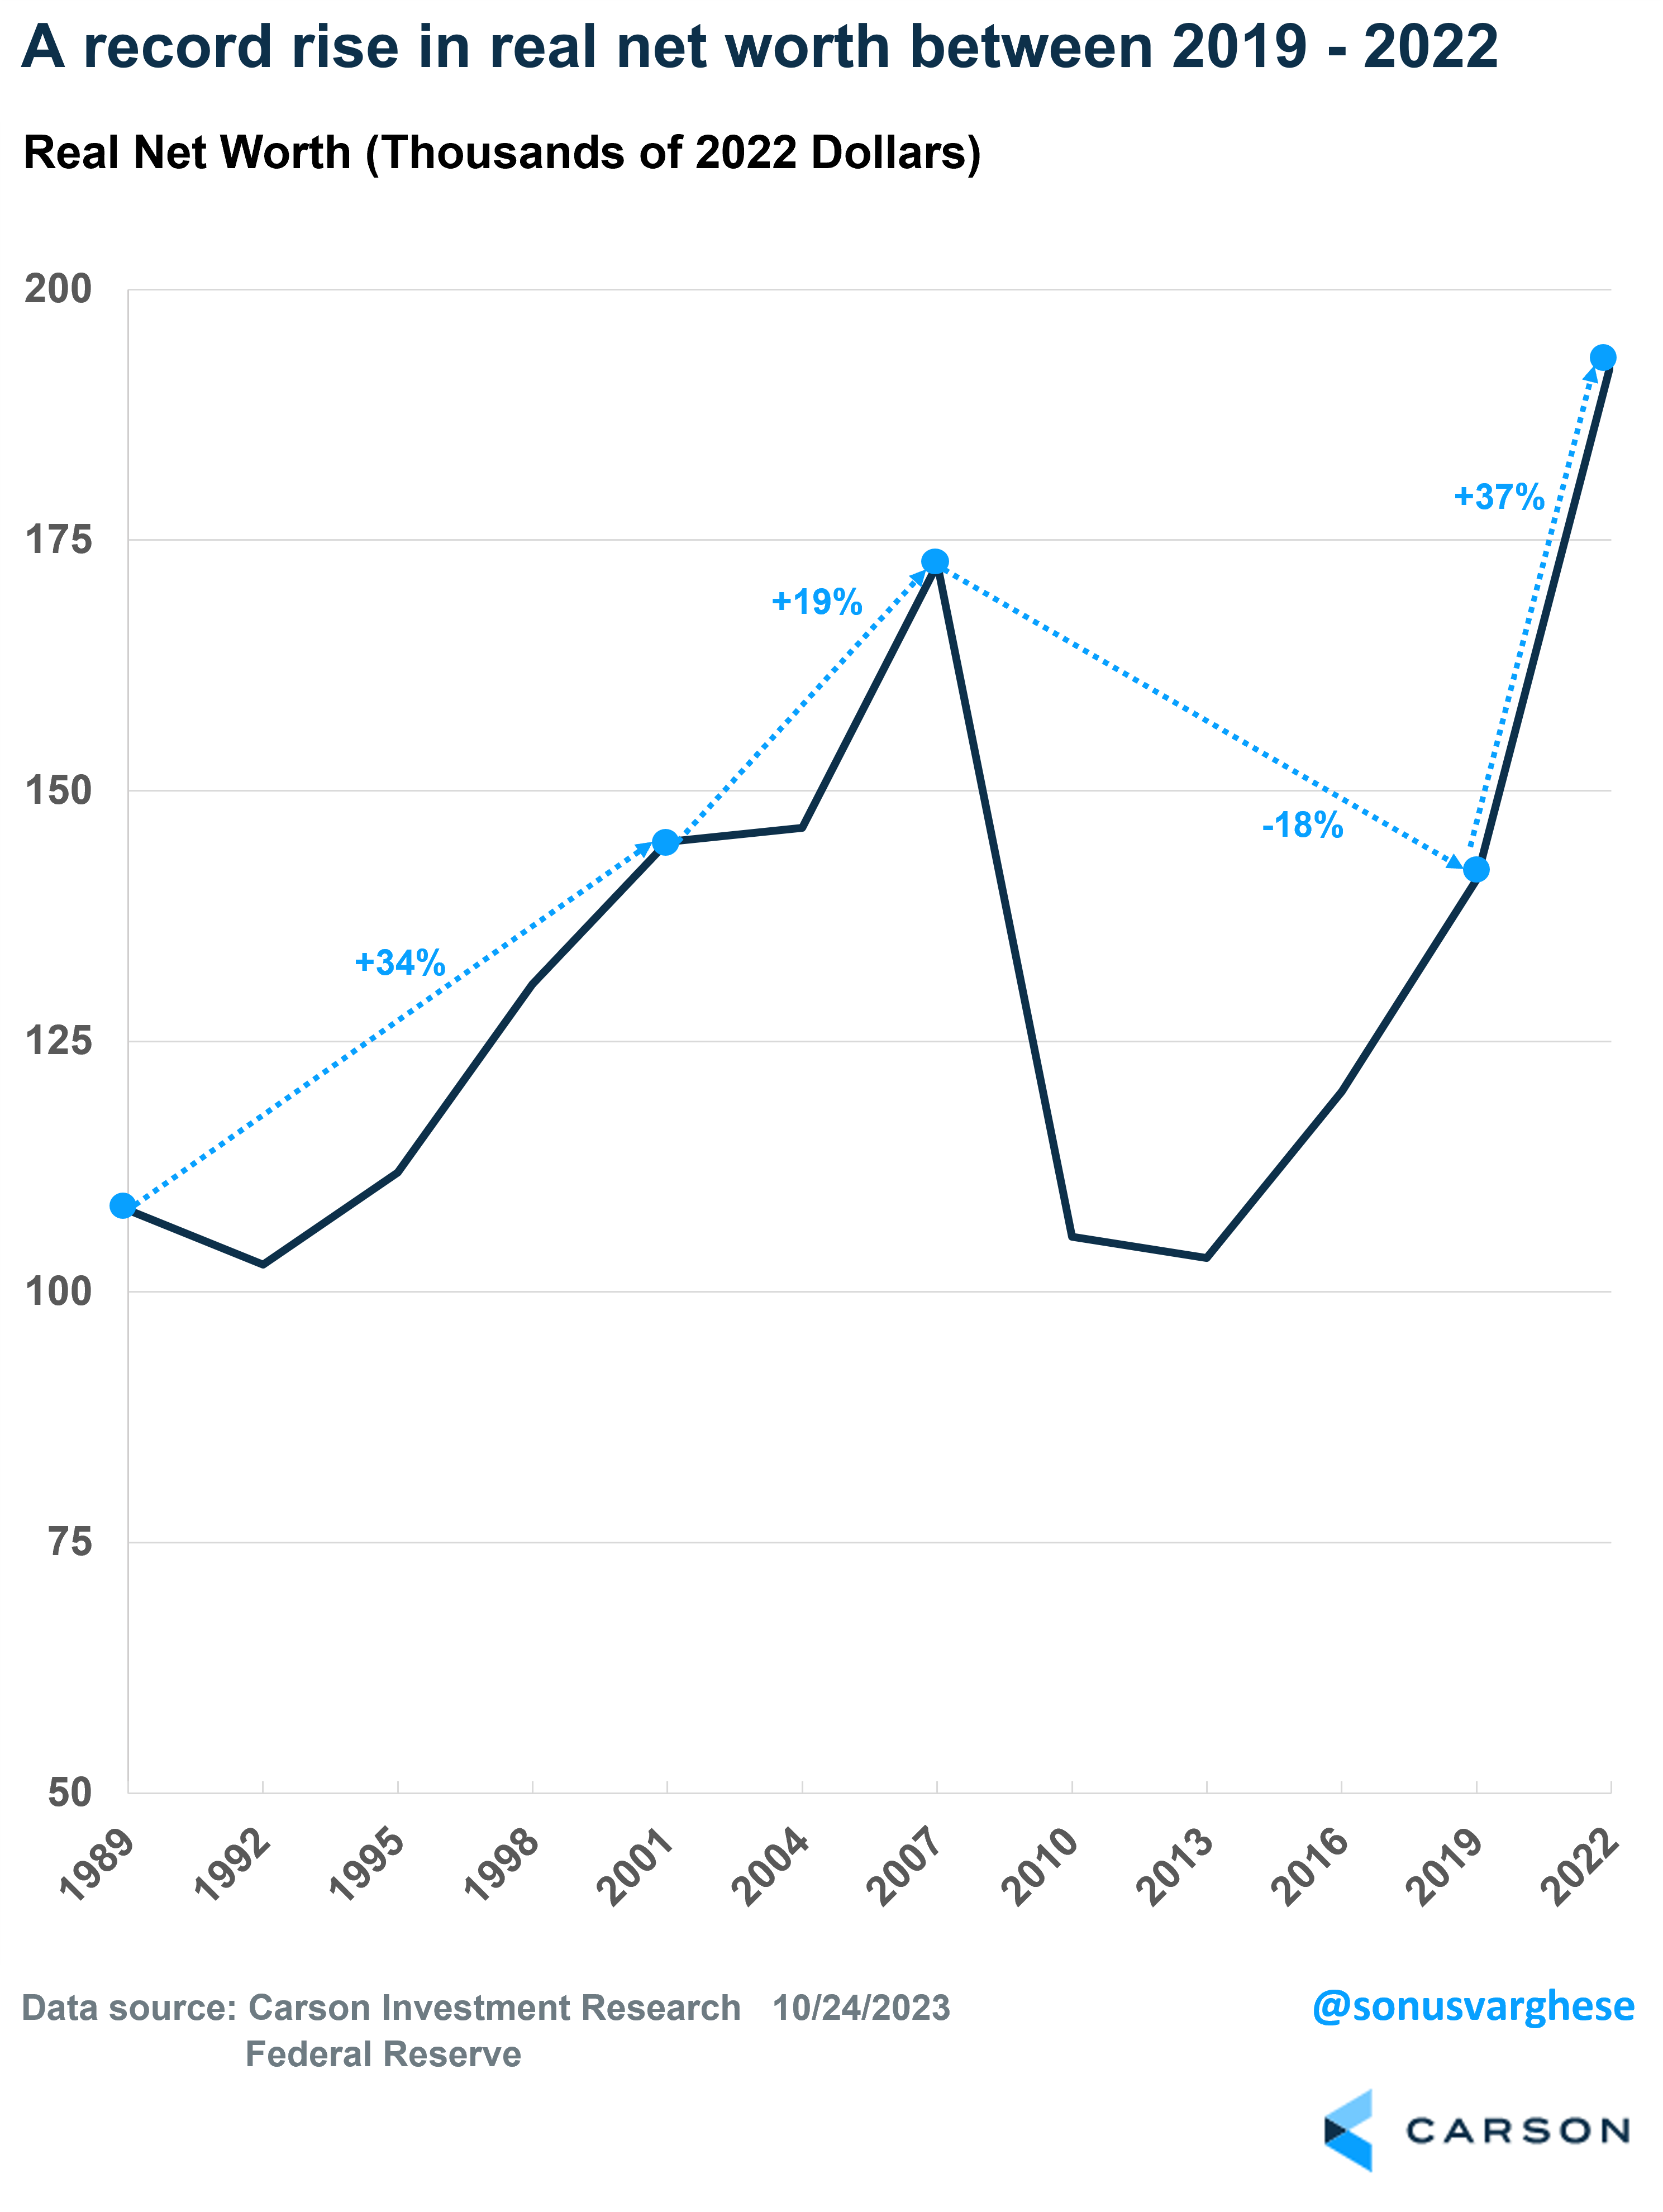
The Federal Reserve just released their triennial “Survey of Consumer Finances” (SCF) last week, which is the gold standard of data related to Americans’ financial condition. After adjusting for inflation, median net worth jumped by 37% between 2019 and 2022. Median “real” net worth (removing gains just from inflation) rose from $141,000 in 2019 to $193,000 in 2022. This is the largest 3-year increase since the survey began in 1989 and stands in sharp contrast to the 2007-2019 period when net worth fell 18%. No wonder that household savings rose during the last decade, which put a limit on economic growth. In fact, the 2019-2022 increase is actually larger than what we saw during the 12 years from 1989 to 2001, amid an economic boom.
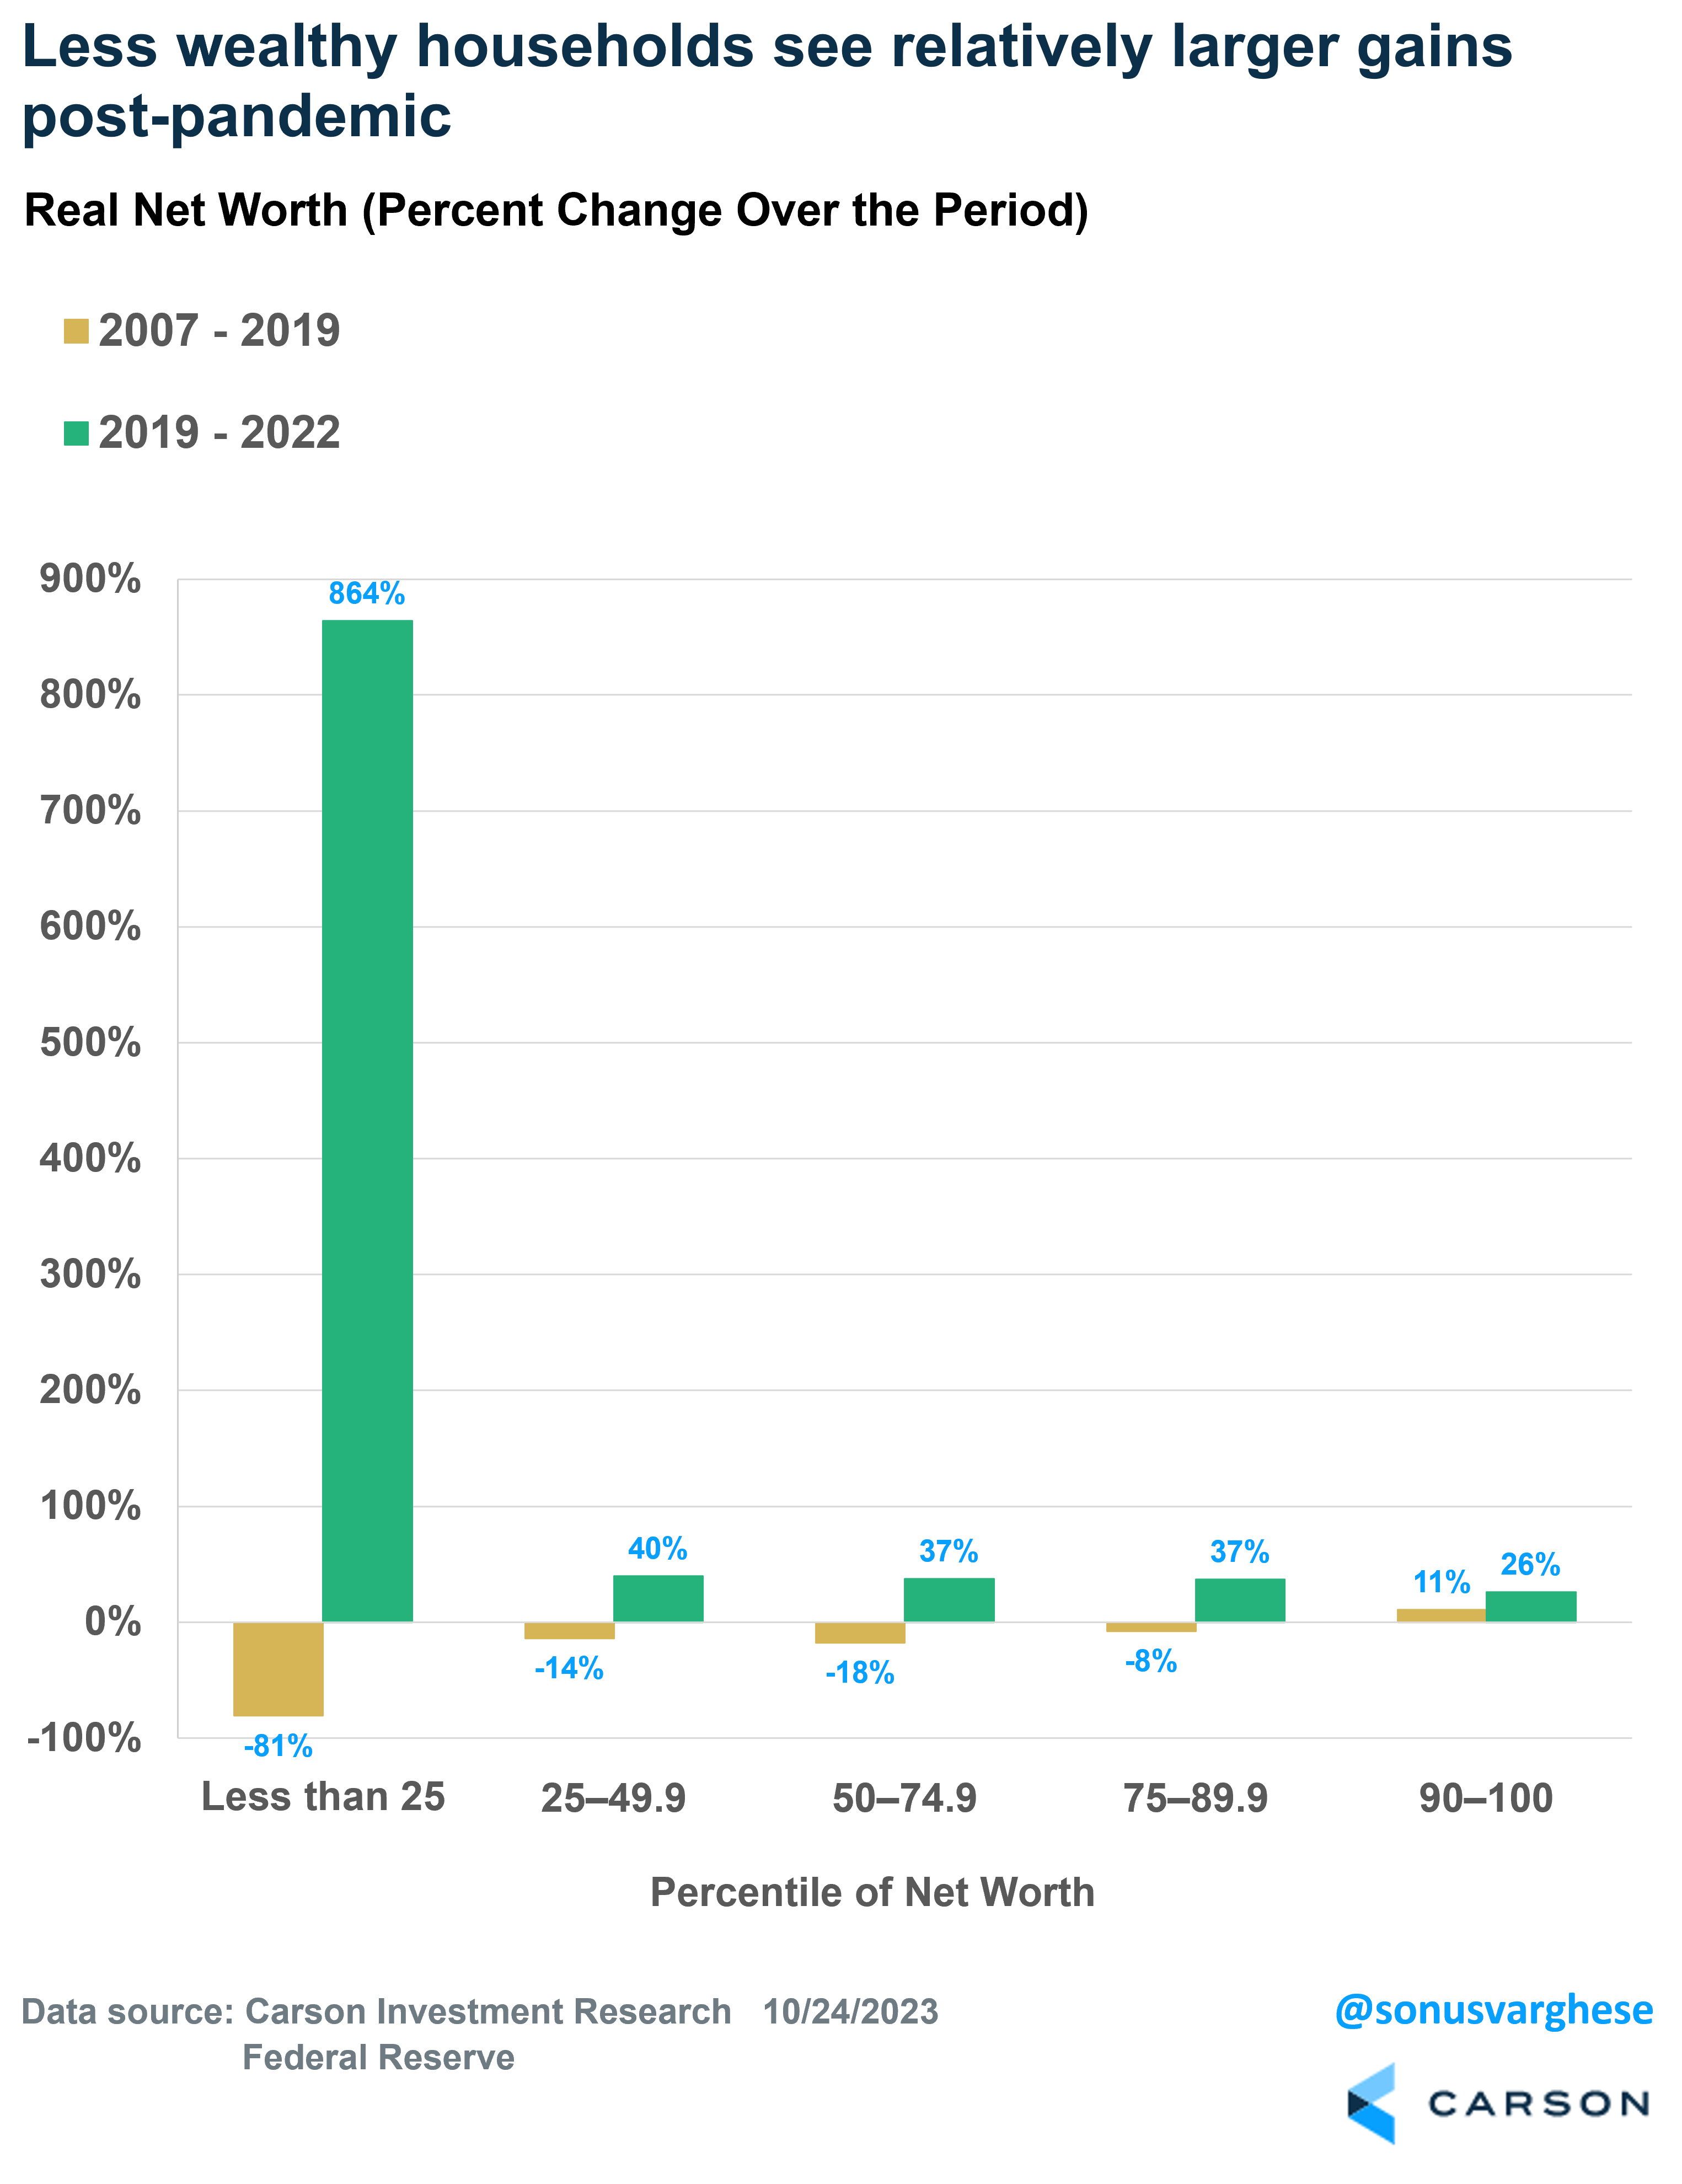
Here’s another statistic which shows how this economy is different from the one we experienced over the last decade. Families in the lowest quartile of wealth, saw median real net worth jump 864% between 2019 and 2022, whereas the wealthiest 10% of families saw relative gains of 26%. This is not to say there’s a big shift in inequality, because the actual numbers show median real net worth for the bottom quartile rose from $400 in 2019 to $3,500 in 2022. Still, that’s a welcome change from the 81% decline we saw between 2007 and 2019.
Another Big Source of Net Worth Gains: Rising Home Prices
For families that owned a home, the median net housing value, i.e. the value of a home minus home-secured debt, rose from $139,100 in 2019 to $201,000 in 2022 – a 45% increase. That was because home values increased significantly even as housing debt was flat.
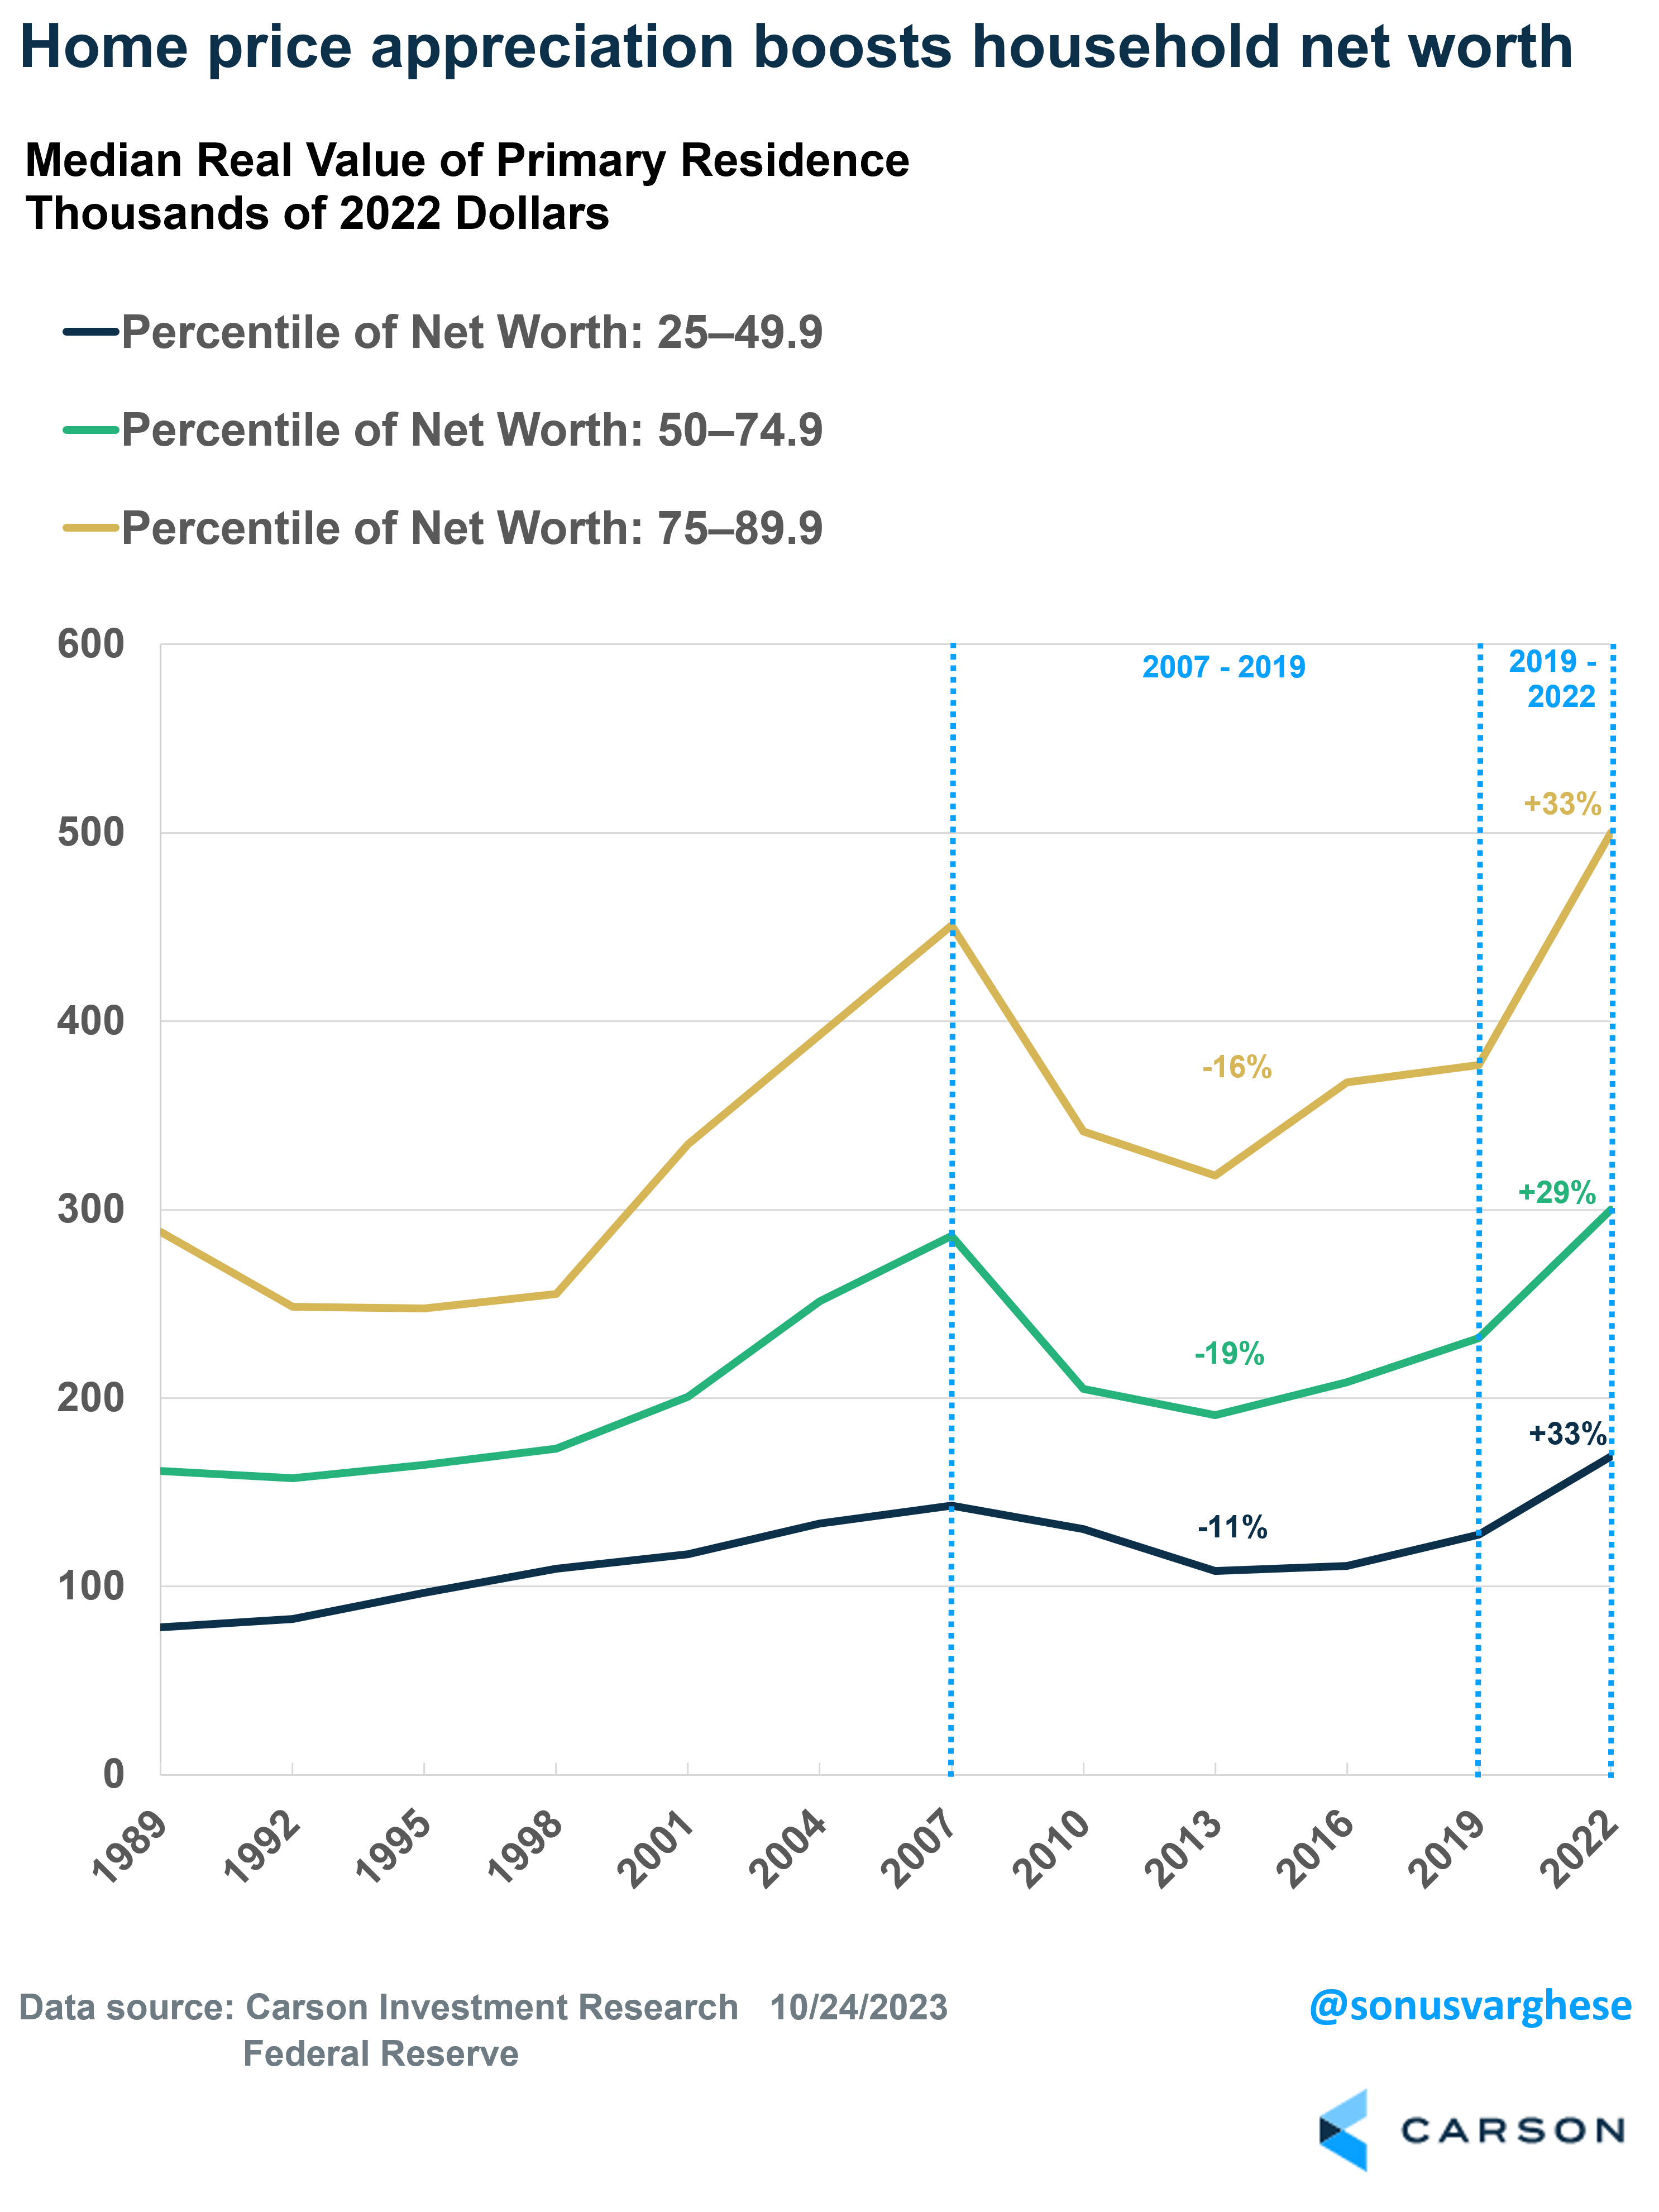
Now, only about 8% of households in the lowest quartile of wealth own homes. But that jumps to 70% for households in the 25th – 50th percentile, and above 90% for households in the top half of the wealth distribution. Households in the middle of the distribution, between the 25th and 90th percentile of wealth, are responsible for the majority of consumer spending in the economy. As you can see below, this group of families saw their home values increase significantly (the chart below adjusts for inflation).
American Households Are Less Financially Fragile
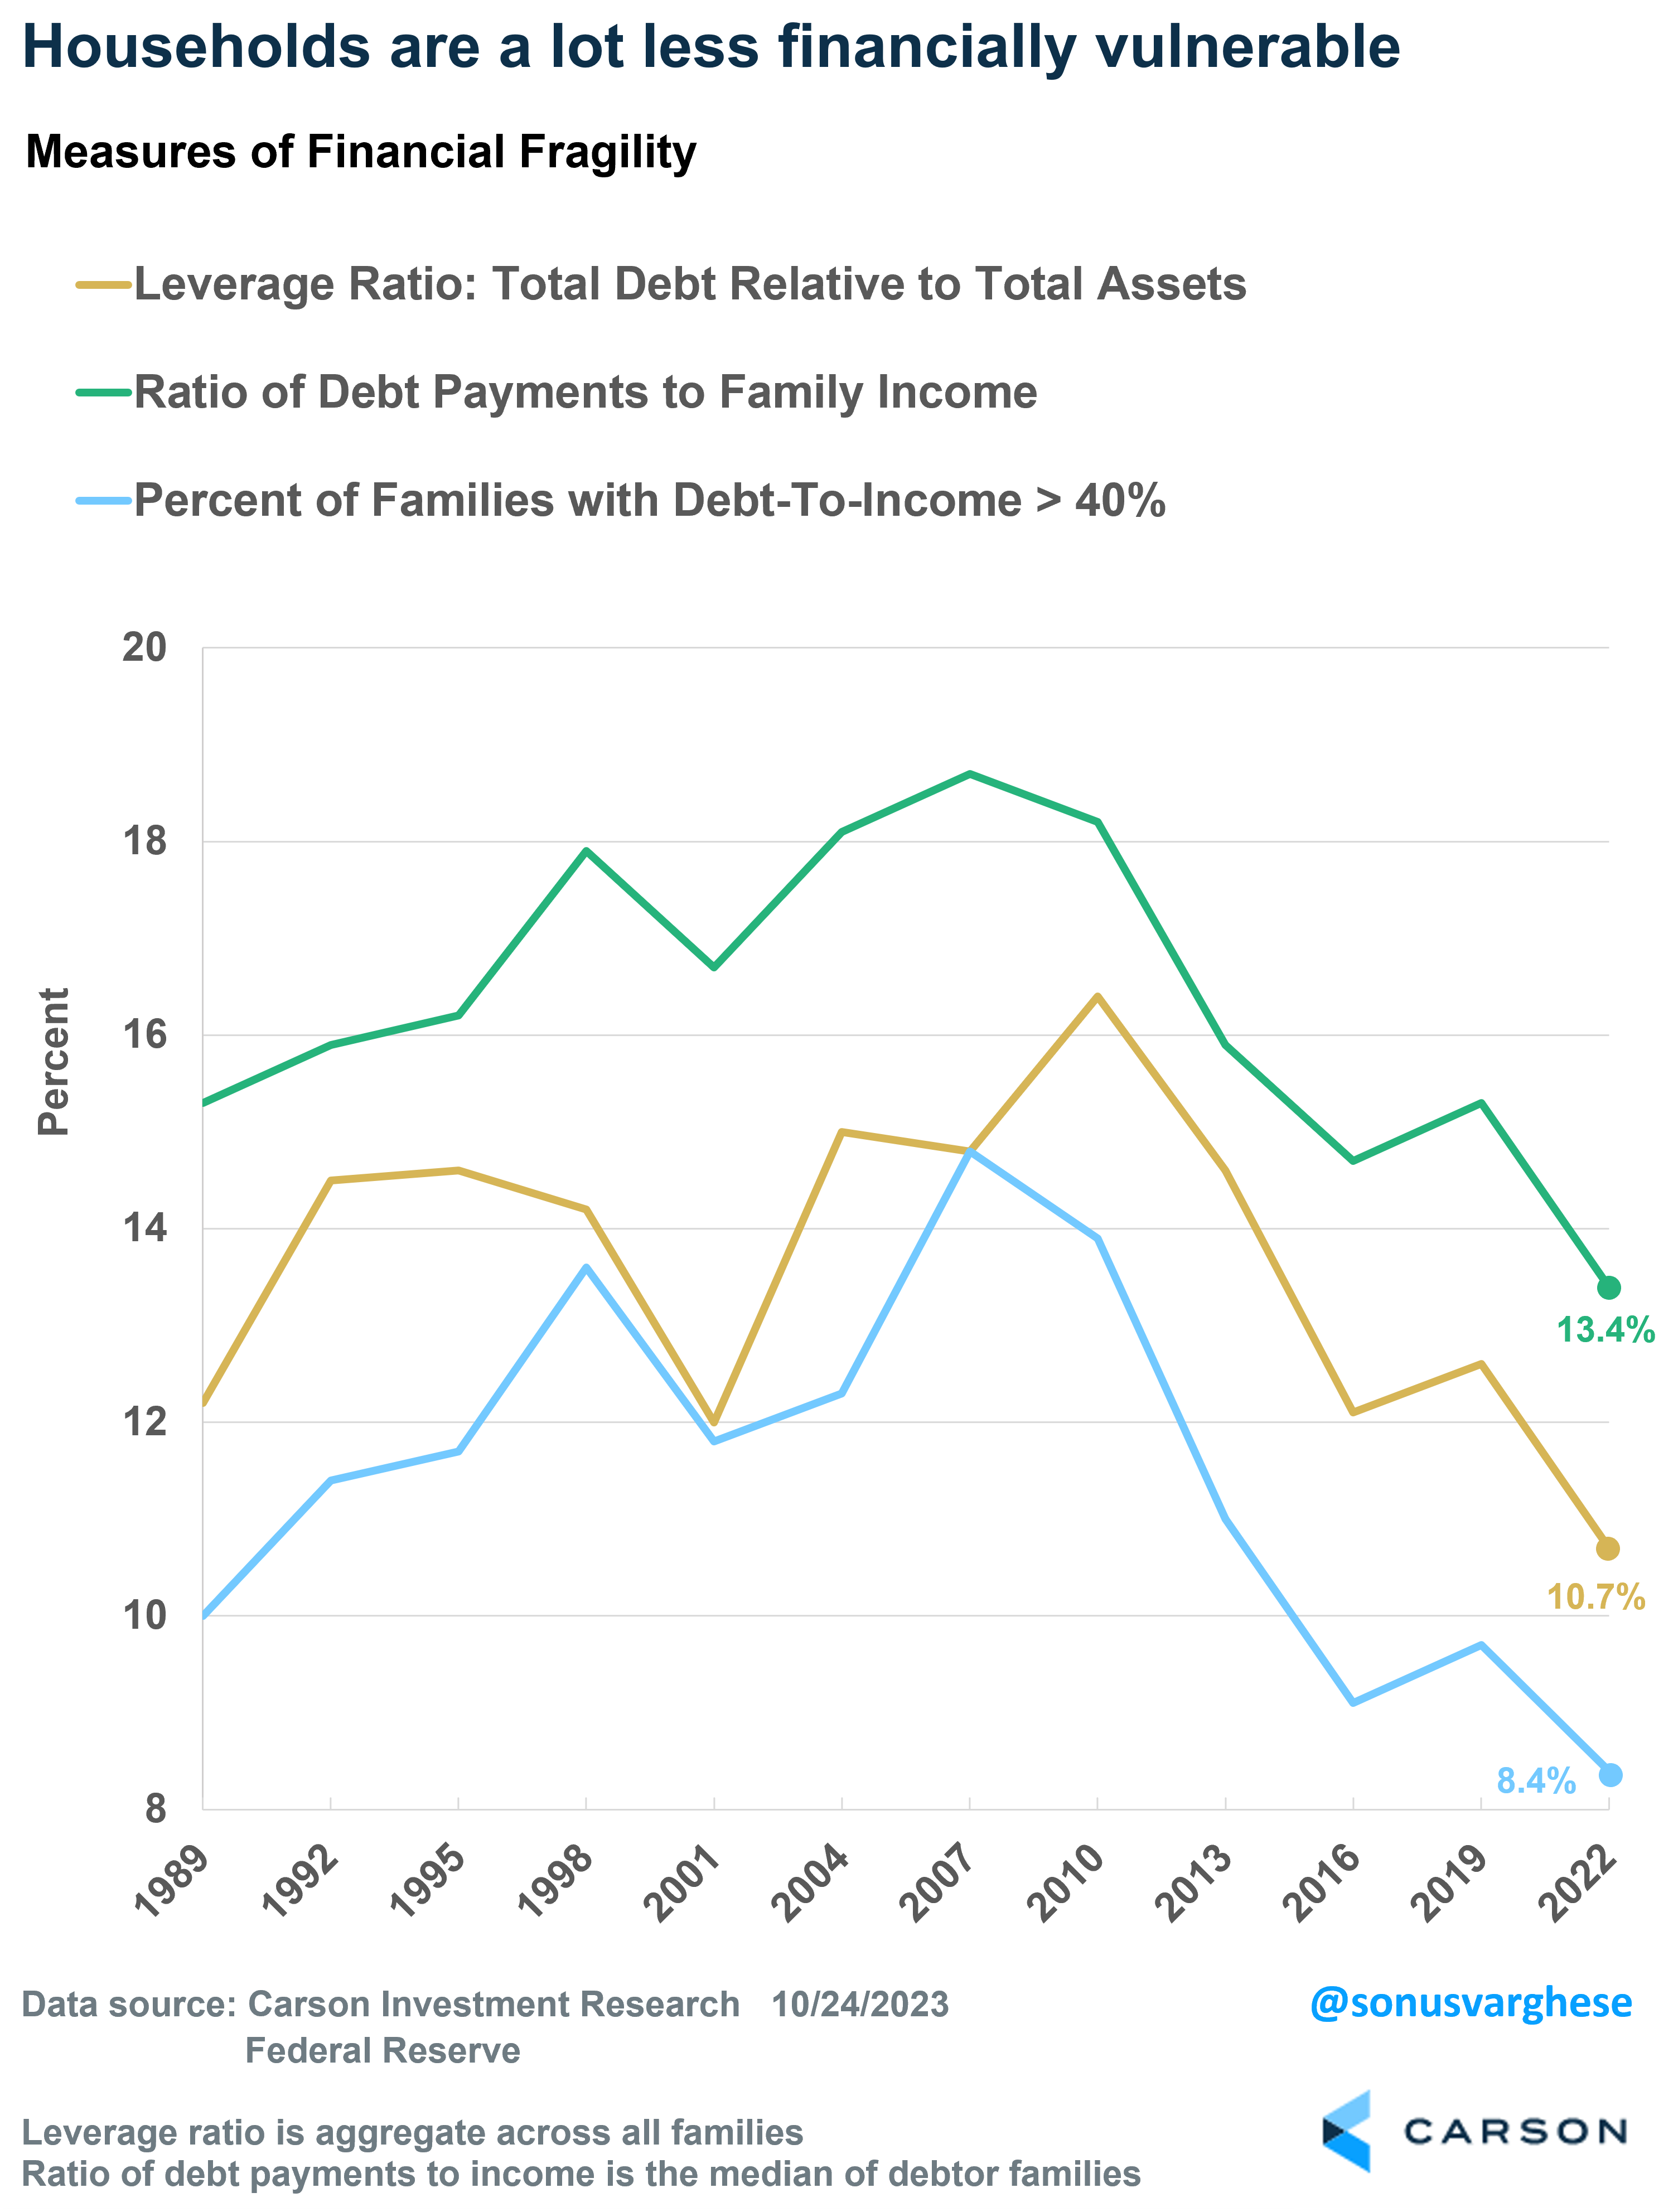
The share of households with credit card balances was stable at around 45%, while the median value of card balances was unchanged at $2,700. Beyond this, the SCF also gives us various measures of financial fragility, and all of them have fallen below pre-pandemic levels.
- The leverage ratio is debt as a percent of total assets (aggregate across all families with debt). This is now at 10.7%, down from 12.6% in 2019. That is the lowest in the history of this survey
- The median ratio of debt payments to family income across all families fell to 13.4% from 15.3% in 2019. This measure is also the lowest in the history of the survey
- The percent of debtors with debt-to-income ratio greater than 40% has also fallen from 9.7% to 8.4%, another all-time survey low.
All in all, the survey data explains why consumption has remained strong: household balance sheets are strong, which is why they’ve continued to spend and not save as much as they did before the pandemic. The last decade was a period when households were trying to recover from a massive housing crash and financial market crisis that crushed asset values. That’s not where we are today. Of course, this data is now dated but inflation has pulled back over the past year, and inflation-adjusted incomes have continued to rise. So, the overall picture of household balance sheets is unlikely to have deteriorated much since this data was collected, which is why we believe that the economy can remain resilient despite higher interest rates, and avoid a recession.
1949796-1023-A